Author: 0xBrooker
Since the interest rate cut in September, BTC initiated a rising surge at the beginning of October, reaching a historical high of $126,296.00 on October 6. Since then, BTC suddenly reversed downward, with a slowdown in capital inflow and continuous selling by holders, forcing the price to rebalance downward. As of this week, BTC has dropped a maximum of 21%, reaching a moderate level of adjustment in this bull market (the extreme level is around 30%).
Technically, BTC has fallen below the 200-day moving average that it held firm last week, once again entering the "Trump bottom" (between $90,000 and $110,000). The most severe aspect is that the BTC price has dropped below the lower edge of the rising channel established since the bull market began in November 2022. This lower edge overlaps with the 360-day moving average, which is crucial for long-term investors. The competition around this price level is bound to be very tough.
If this support is broken, BTC will technically complete a "bull-bear" transition and officially enter a "downward phase."
Policy, Macroeconomic Finance, and Economic Data
As a highly volatile emerging asset, BTC and crypto assets respond most agilely to macro liquidity and risk appetite. This has been particularly evident in this round of adjustments.
The first round of sell-offs that began on October 10 was triggered by Trump’s declaration on social media of a 100% tariff on China. This round of sell-offs led to the outbreak of the "Binance USDe" incident, causing significant damage to the internal structure of the crypto market.
The second round of sell-offs, which started on November 3 (this past Monday), was caused by hawkish comments from Federal Reserve officials (decreased probability of a rate cut in December) and the impending record government shutdown leading to a liquidity crisis in the U.S.
During this period, due to the government shutdown, expenditures were difficult to carry out, and the Federal Reserve's TGA account balance continuously reached historical highs.
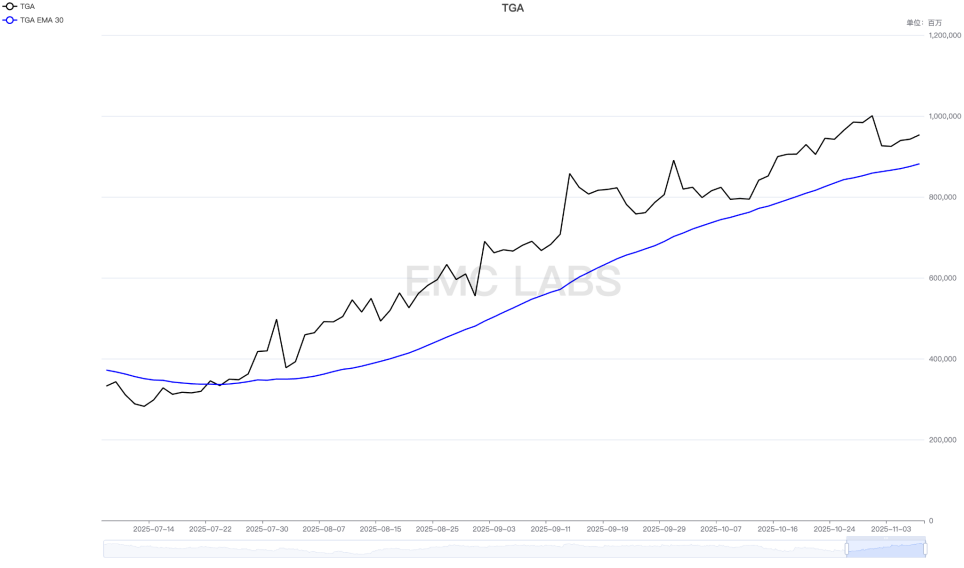
Market liquidity has been continuously "sucked away," with SOFR briefly exceeding 4.3% (on October 28), far above the federal rate, indicating that bank liquidity is very tight. The dollar index briefly rose to 100.364 (on November 5).
Under heavy pressure, risk assets have been passively devalued. Just last week, the Nasdaq experienced its worst weekly performance since April, falling 3.04% over the week.
Due to the government shutdown, economic and employment data from the government cannot be released in a timely manner, leaving the market to focus only on relevant data released by the private sector.
The ADP data released on Wednesday showed signs of stabilization in the U.S. job market after two months of consecutive declines, with the October ADP employment number increasing by 42,000, significantly exceeding the expected 30,000, and reversing last month's decrease of 32,000 (which was revised to 29,000). This adds uncertainty to whether the Federal Reserve will continue to cut rates in December.
The consumer confidence index from the University of Michigan released on Friday showed that consumer confidence in November hit a three-year low, the second lowest since records began in 1978. This also provides some support for a rate cut in December.
Last week, the subjective comments from Federal Reserve officials leaned towards uncertainty regarding a rate cut in December. After a week, FedWatch data shows that the probability of a rate cut in December has decreased by more than 30%, currently at 66.9%.
Regarding the federal government shutdown, this week the Democrats have proposed clear conditions, which the Republicans have failed to pass. The "conditions proposed" have been seen by the market as an important breakthrough towards ending the shutdown. On Friday, U.S. stocks and BTC experienced a deep V-shaped recovery, positively responding to this "progress." Trump also proposed using the "nuclear option" to end the dispute, passing the funding bill with a "simple majority" and immediately restarting the government. Over the weekend, the Senate held emergency meetings, and by Sunday, there were reports of clearer progress in "negotiations."
Both sides are nearing their limits. Goldman Sachs expects the U.S. government to end the shutdown within two weeks.
We believe that the fundamental reason for the adjustment in the U.S. stock market is the decreased probability of a mid-term rate cut and the recent liquidity tightening under the backdrop of the federal government shutdown. The government shutdown issue may be resolved within one to two weeks, but whether there will be another rate cut in December will depend on the economic and employment data released after the shutdown ends.
Turmoil and uncertainty remain the themes of the market in November. However, expectations are approaching a turning point.
Crypto Market
BTC plummeted by 5.28% this week, with a rebound in price on Sunday, closing at $104,694.95, with increased trading volume.
Technically, BTC violently dropped below the $100,000 mark on Tuesday, spending most of the remaining time fluctuating around this price, which is also the 360-day moving average. This price is also the lower edge of the rising channel we have been monitoring in this bull market. If this price is effectively broken, the current BTC bull market will officially come to an end.
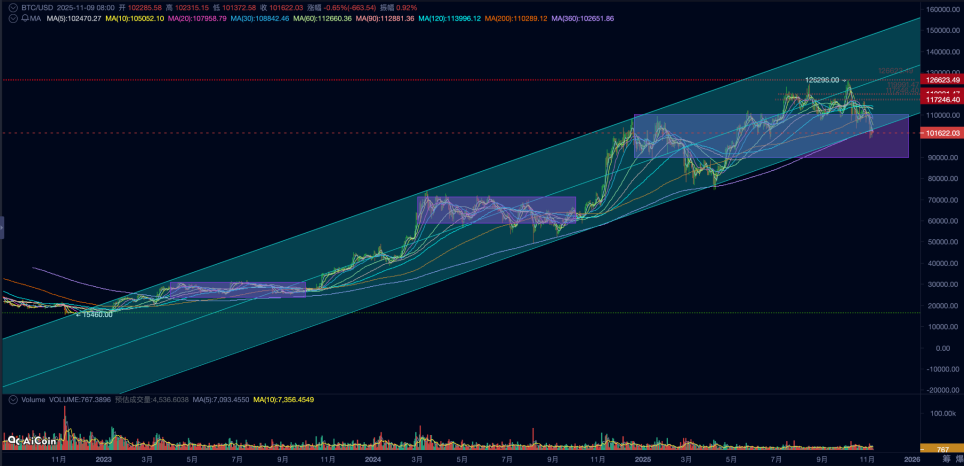
BTC Daily Chart
The adjustment in market risk appetite is ultimately reflected in the decrease in capital inflow and the increase in selling pressure.
In the past week, both long and short positions transferred a total of 170,602 BTC to exchanges, with selling pressure increasing for three consecutive weeks, while buying pressure failed to effectively expand, leading to a weak outflow of only 967 BTC from exchanges.
Looking at the capital side, this week’s outflow reached $2.06 billion, continuing to expand compared to last week. Among the types of capital, only the DATs channel saw a slight inflow, while the BTC Spot ETF and stablecoin channels experienced significant outflows. Of course, this capital outflow has already been factored into the BTC price. In September 2024 and April 2025, there were severe weekly outflows across all market channels, but after the negative factors reached a turning point, they all turned into inflows, leading to a new round of increases. However, if inflows cannot be achieved, based on historical data, it can be confirmed that a bear market has officially arrived.
The long-held positions monitored over the period saw a significant drop of nearly 120,000 BTC this week, indicating that the long position group still believes the bull market cycle has ended, responding to both rises and falls with selling. In the adjustments of September 2024 and April 2025, long positions also saw increased selling as they approached the bottom phase—this can be understood as a clearing of relatively weak-willed long positions. In the context of a major structural change in the market, whether this increased selling pressure is a clearing of this group or a correct decision to completely extinguish the bull market cycle remains to be seen.
In terms of magnitude, the current 21% drop is still within the normal adjustment range for this cycle (around 30%), but the price has already fallen below several key technical indicators such as the 360-day moving average and the lower edge of the rising channel. Technically, the current BTC bull market is at a critical moment of life and death.
The outcome will be revealed in the next 1-2 weeks. Either liquidity will rebound as the government resumes operations, leading to another rebound (if the old cycle ends, more time will be needed for confirmation); or even if liquidity recovers, the inflow of funds may struggle to withstand selling pressure, causing BTC prices to decline into the next phase of the old cycle—"downward phase" (bear market).
Cycle Indicators
According to eMerge Engine, the EMC BTC Cycle Metrics indicator is at 0, indicating a transition period.
免责声明:本文章仅代表作者个人观点,不代表本平台的立场和观点。本文章仅供信息分享,不构成对任何人的任何投资建议。用户与作者之间的任何争议,与本平台无关。如网页中刊载的文章或图片涉及侵权,请提供相关的权利证明和身份证明发送邮件到support@aicoin.com,本平台相关工作人员将会进行核查。


