作者:NingNing
截至 25 年,我们完整经历不到 4 轮四年周期。而统计学常识告诉我们,极小统计样本规模(有效样本数据只有 3 个)下得出任何结论,都需要谨慎验证,而不是简单迷信。
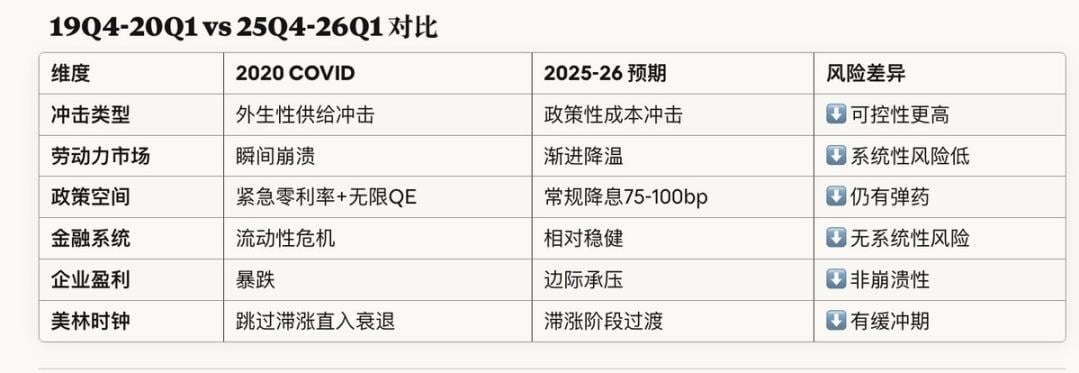
在小样本的大市场周期预测上,从贝叶斯概率方法推导出 25Q4 对标 19Q4 的刻学,比四年周期论更有参考价值。
将 25Q4 对标 19Q4 的刻学转换成贝叶斯公式的写法,即P(熊市|美林时钟滞涨衰退)=[P( 熊市)/P(美林时钟滞涨衰退)]*(P(美林时钟滞涨衰退|熊市)
贝叶斯概率参数估算
P( 熊市 ) - 先验概率
自 1929 年以来:S&P 500 经历 27 次熊市
平均频率:每 3.5 年一次
年度概率:约 28.6%
季度概率(Q4-Q1 跨度):约 15-20%
保守估计:P( 熊市 ) ≈ 18%
P( 滞涨→衰退 ) - 美林时钟转换概率
历史上「滞涨→衰退」的转换概率:
1970s 滞涨:最终导致 1973-74、1980、1981-82 三次衰退
2000-2001:科技泡沫破裂,温和衰退
2007-2008:金融危机,深度衰退
2011-2012:欧债危机,未完全衰退(避免)
2018-2019:贸易战担忧,软着陆成功
统计估算:
过去 50 年约 6 次「滞涨→衰退」情景
其中 4 次转为衰退(66%)
2 次软着陆(34%)
当前环境调整:
美联储主动降息(vs 1970s 被动加息)
劳动力市场韧性(vs 2008 金融系统性风险)
关税政策不确定性
全球去美元化压力
估计:P( 滞涨→衰退 ) ≈ 40-50%(取中值 45%)
P( 滞涨→衰退|熊市 ) - 似然概率
在熊市发生的条件下,经历「滞涨→衰退」的概率:
历史熊市分类:
衰退型熊市(12 次):1929、1937、1973-74、1980、1981-82、1990、2000-02、2007-09、2020、2022
非衰退型熊市(15 次):其他技术性调整
在 12 次衰退型熊市中:
经历滞涨阶段的:1973-74、1980、1981-82、2007-08(约 4 次)
未经历滞涨的:1929(通缩)、2020(疫情冲击)、2022(纯通胀)
估计:P( 滞涨→衰退|熊市 ) ≈ 33%
贝叶斯计算
标准公式:
P( 熊市|滞涨→衰退 ) = P( 滞涨→衰退|熊市 ) × P( 熊市 ) / P( 滞涨→衰退 )
= 0.33 × 0.18 / 0.45
= 0.0594 / 0.45
= 0.132 = 13.2%
情景分析矩阵
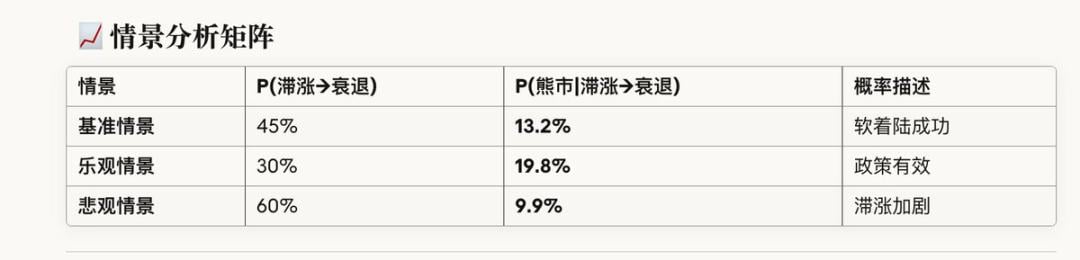
关键差异分析:为何概率较低?
综合结论
P(25Q4-26Q1 熊市 ) ≈ 15-20%
置信区间:
下限(乐观):12%
中值(基准):17%
上限(悲观):25%
策略
需要战术性防御而非战略性撤退。
免责声明:本文章仅代表作者个人观点,不代表本平台的立场和观点。本文章仅供信息分享,不构成对任何人的任何投资建议。用户与作者之间的任何争议,与本平台无关。如网页中刊载的文章或图片涉及侵权,请提供相关的权利证明和身份证明发送邮件到support@aicoin.com,本平台相关工作人员将会进行核查。


