Q2 Crypto lending decreased by 40% from its peak, and deleveraging is gradual. CeFi surpassed DeFi for the first time, stablecoin interest rates are pegged to the US dollar, on-chain high leverage risks still exist, and corporate debt and futures are shrinking in tandem.
Written by: Starbase Accelerator
Report Overview
On August 16, 2026, Galaxy Digital released "The State of Crypto Leverage - Q2 2026: An Orderly, Measured Decline." The report states that the crypto collateral loan market contracted for the third consecutive quarter in Q2 2026, with the total scale dropping to $56.16 billion, a 40.13% decline from the peak in Q3 2025. Unlike the brutal 55% crash in a single quarter in 2022, this round of deleveraging is characterized by a "stair-step" gradual decline—dropping 10%, 5%, and 17% in the past three quarters, driven by a proactive reduction of risk by the market rather than forced liquidation or counterparty defaults. The report expands on the following dimensions:
- Overall market size and structural changes: tracking the deleveraging process of the three major sectors CeFi, DeFi, and CDP stablecoins, analyzing the share migration across different segments.
- Differentiation in resilience between CeFi and DeFi: the decline in CeFi is significantly smaller than that of DeFi, surpassing DeFi for the first time since Q3 2023, with funds concentrating on leading compliant platforms.
- Interest rate environment and asset pricing: the cost of stablecoin borrowing follows the upward trend of federal funds rates, with structural price differences evident between on-chain and over-the-counter borrowing of BTC/ETH.
- Microstructure of on-chain leverage: using Aave V3 as a core example, revealing the risk structure of high leverage in e-mode, collateral concentration, and ETH staking cycle arbitrage.
- Corporate debt and futures market: the deleveraging of digital asset treasury strategies is shrinking in tandem with futures open interest, confirming an orderly retreat in the overall market risk appetite.
Structural Reversal of CeFi and DeFi
CeFi shows stronger resilience and regains leadership
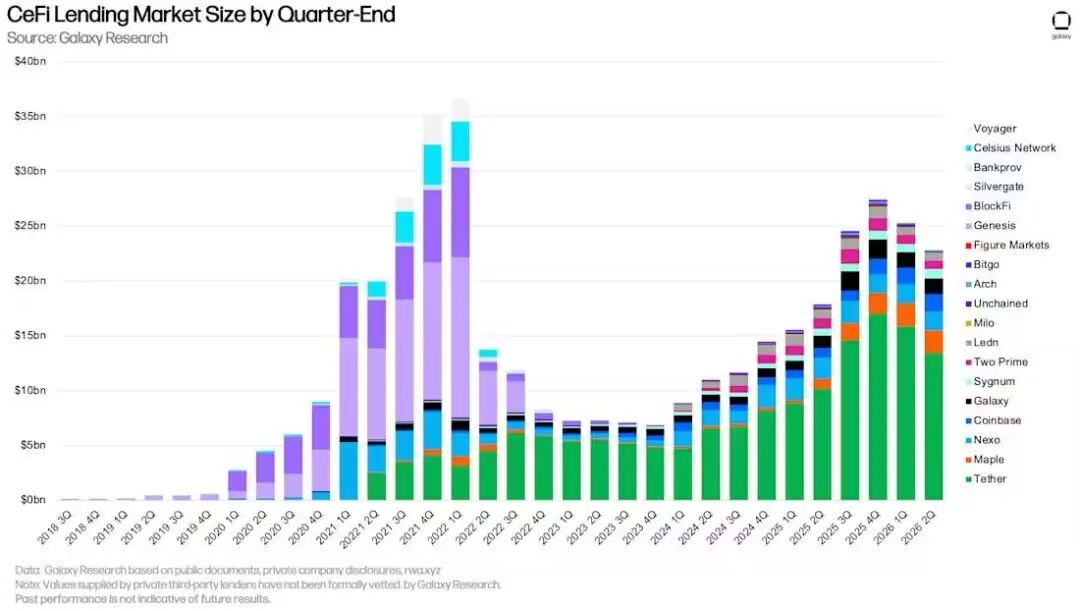
CeFi's unpaid loans tracked by Galaxy amount to $22.98 billion, a quarter-over-quarter contraction of 9.62%, but the decline is significantly smaller than DeFi’s 27.61%. With this shift, DeFi lending applications' unpaid loans dropped to $20.43 billion, marking the first time since Q3 2023 that CeFi's book has exceeded DeFi.
From a market share perspective, DeFi's share in crypto collateral loans fell from 41.81% in Q1 to 36.37%, while CeFi rose from 37.69% to 40.93%. The market share of CDP stablecoins in crypto collateral also slightly increased to 22.7%. If DeFi lending and CDP stablecoins are combined as "on-chain lending," their total market share still accounts for 59.07%, but it has decreased by 324 basis points compared to Q1.
Concentration at the top but funds migrating to compliant platforms
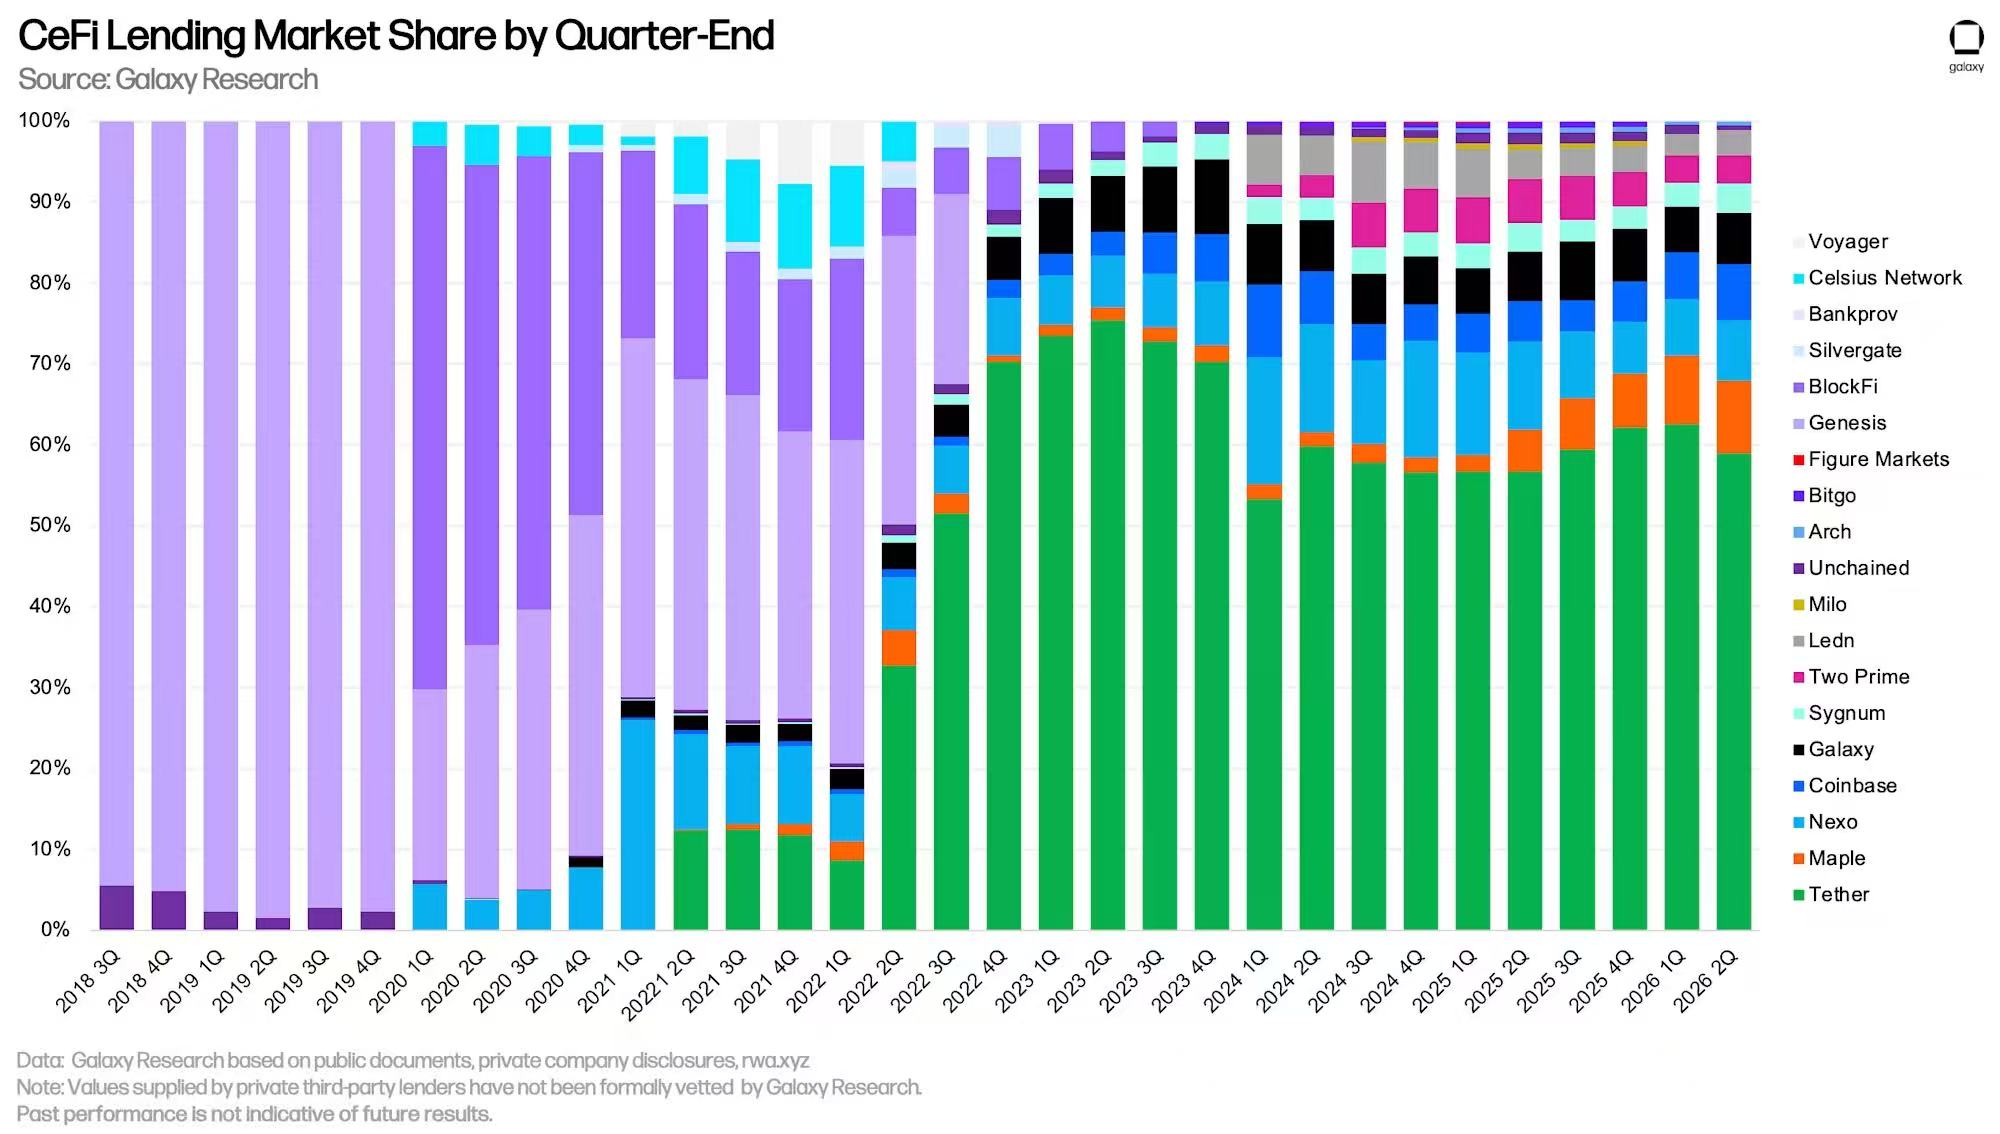
Within CeFi, market concentration remains very high but has loosened slightly. Tether holds the top position with a 58.54% share, though this is a decline of 371 basis points from the previous quarter; Maple and Nexo follow with 8.91% and 7.51%, respectively, accounting for a total of 74.96% of the market.
Interestingly, although CeFi overall is contracting, institutions like Galaxy, Coinbase, Ledn, Arch, Sygnum, and Milo saw growth in their books in Q2, indicating that funds are concentrating on leading and more compliant platforms.
Interest Rate Environment: Deeply Linked to Macro Policy
Stablecoin rates follow US dollar liquidity
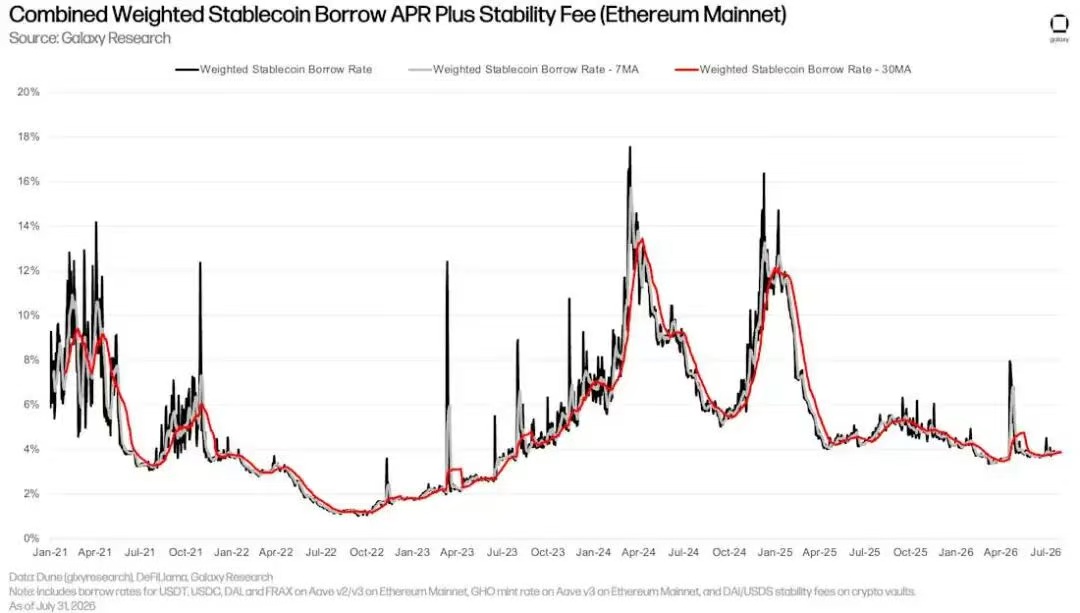
On the interest rate front, the cost of stablecoin borrowing has continued to be linked to macro monetary policy. The weighted average stablecoin borrowing rate rose by 27 basis points during the quarter, further climbing to 3.88% by the end of the period. The OTC benchmark rates for USDC and USDT fluctuated between 4.25% and 5% throughout the quarter, fundamentally based on the federal funds rate.
This implies that the credit pricing of DeFi is not operating independently from the traditional monetary policy environment but exists as a distant extension of US dollar liquidity.
Structural differentiation of BTC and ETH on-chain versus OTC
The borrowing rates for BTC and ETH exhibit structural differentiation between on-chain and over-the-counter. The on-chain borrowing rate for WBTC fluctuated between 0.44% and 0.5%, while the OTC borrowing rate for BTC remained consistently at 1% throughout the quarter. The source of this price difference is clear: OTC demand for BTC borrowing mainly comes from short-selling and collateral financing, whereas on-chain WBTC is more passively held as collateral, with lower borrowing demands.
The case for ETH is more complex. The cost of borrowing ETH on-chain is typically higher than that of stETH, as many users leverage "looping strategies" to participate in staking—using liquid staking tokens (LST) or liquid re-staking tokens (LRT) as collateral, borrowing ETH, and then restaking, repeatedly amplifying exposure to staking yields. This strategy is only effective when the cost of borrowing ETH is lower than the staking APY, causing ETH's on-chain borrowing rate to be "capped" by staking yields over the long term.
Aave V3 Micro Perspective: Where Leverage is Concentrated
High leverage characteristics of e-mode
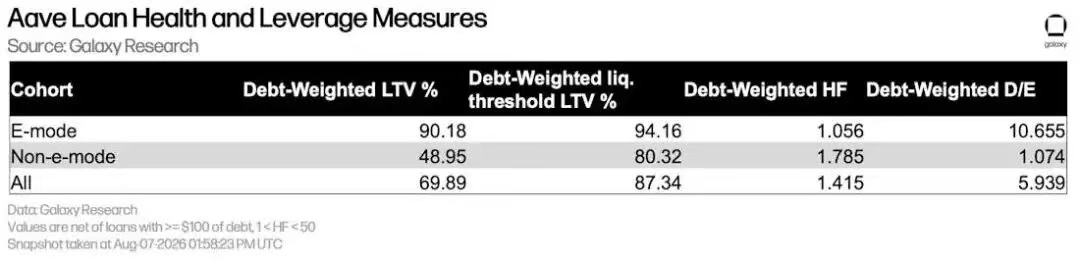
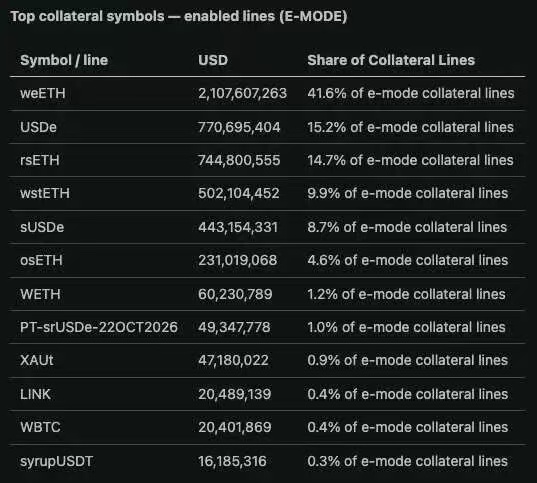
The microdata from Aave V3 core instances provides footnotes to the aforementioned logic. As of the snapshot on August 7, excluding small positions and over-collateralized positions, there were around 19,073 net unpaid loans. Although e-mode loans accounted for only 8.91% of open positions, they contributed nearly half of the unpaid debts.
Borrowers in e-mode exhibit significantly higher leverage levels: the debt-weighted LTV is approximately 90%, with a health factor close to 1.06 and a debt equity ratio of about 10.7. This means that even slight fluctuations in collateral can push a large number of positions into liquidation pressure zones. In contrast, non-e-mode loans have a debt-weighted LTV of around 49%, a health factor of about 1.79, and a much looser safety margin.
Concentration of collateral and liabilities
From a collateral structure perspective, the risk concentration in Aave V3 core is not low. WETH, weETH, and wstETH together account for about 54.6% of the total collateral, with WBTC comprising about 14%. Within e-mode, this concentration is even more extreme: weETH alone accounts for about 42% of e-mode collateral, and with rsETH and wstETH, ETH staking/re-staking assets cover 66.2% of e-mode collateral.
The borrowing side is also concentrated, with WETH accounting for about 37% of total liabilities, while USDT and USDC together comprise about 50%. However, one change is that WETH's liability share has noticeably decreased from 51.1% in prior analyses, in line with the overall reduction of e-mode loans.
Corporate Debt and Futures Market Shrinking in Tandem
Corporate proactive deleveraging
The corporate finance side is also engaged in simultaneous deleveraging. Galaxy currently tracks $16.1 billion of corporate debt used for direct purchases or supplements to digital asset treasury strategies, with the Strategy completing a $1.5 billion debt buyback in May, the main contributor to the quarterly decrease.
Including this type of cryptocurrency-related corporate debt, the total unpaid debt on and off-chain at the end of Q2 was $73.2 billion, marking a 15.08% year-over-year decline for the third consecutive quarter.
Futures OI rebounded after moderate adjustment
The futures market provides another window to observe leverage. At the end of Q2, futures open interest (OI) fell by 3.08% to $103.2 billion, with BTC OI declining by 6.24% to $45.04 billion and ETH OI experiencing a more substantial drop of 26.31% to $21.99 billion. Together, they accounted for 65% of total futures OI.
However, this moderate overall decline masks a rebound following the end of the quarter—by the end of July, total OI had rebounded to approximately $114 billion, with BTC and ETH both recovering from the lows of Q2. The report also notes that OI itself does not equate to absolute leverage, as some positions can hedge through spot long, achieving Delta neutrality.
Conclusion
The crypto lending market in Q2 2026 is undergoing a "soft landing" type of deleveraging. Unlike the brutal 55% crash in a single quarter in 2022, this round of contraction has lasted for three quarters with a steady pace, without triggering chain liquidations. CeFi has demonstrated stronger resilience than DeFi, the interest rate environment remains linked to traditional monetary policy, while microdata from protocols like Aave reveals the true structure of concentrated on-chain leverage and staking derivative cycle arbitrage. The synchronized retreat of the corporate sector and futures market further confirms that the entire ecosystem is actively contracting rather than passively collapsing. Data from early July suggests that DeFi borrowing and futures OI may have reached phase bottoms, and if this gradual adjustment can persist, the market's risk-bearing capacity will be significantly stronger than in the last cycle.
免责声明:本文章仅代表作者个人观点,不代表本平台的立场和观点。本文章仅供信息分享,不构成对任何人的任何投资建议。用户与作者之间的任何争议,与本平台无关。如网页中刊载的文章或图片涉及侵权,请提供相关的权利证明和身份证明发送邮件到support@aicoin.com,本平台相关工作人员将会进行核查。


