Through past crypto bull market cycles, dissect mid-phase launch signals, combine current market analysis to discern authenticity, and outline key observational indicators and potential trading risks.
Written by: JamesX
After every major rally, the market often hears a dangerous phrase: "This time it's confirmed to be a bull market." The problem is that "bull market" mixes oversold rebounds, trend recoveries, capital expansions, and late-stage bubbles together. They may all rise consecutively, but the quality of the buying behind them, leverage, and risk-reward ratios are completely different.
The earliest phase of "mid-phase launch in a bull market" should have verifiable definitions: prices stabilize in the main cost zone; new capital continuously flows into spot, ETFs, and stablecoins; long-term holders orderly realize profits but do not fully distribute; Bitcoin breaks through first, followed by an expansion in market breadth; leverage rises but does not dominate prices. Only when multiple conditions resonate can it be distinguished from a rebound caused by short covering.
1. Historical "mid-phase launches" usually go through four states
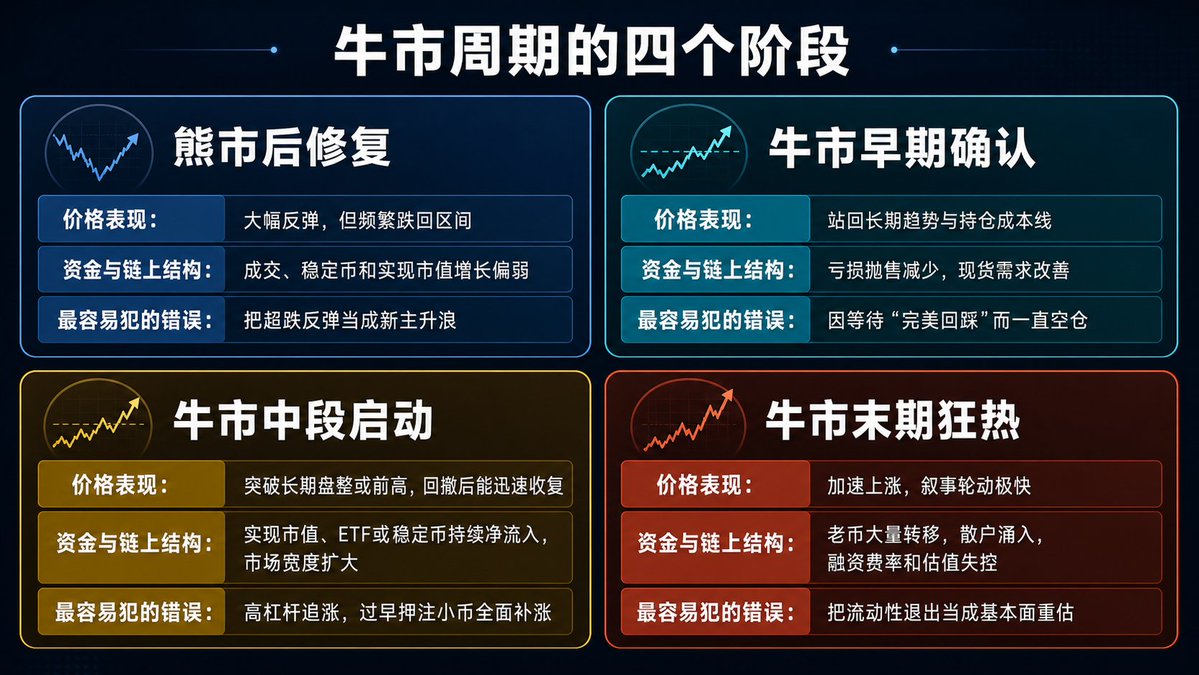
The 2016-2017 cycle provided a typical template. About 525 days after the second halving, the cycle peak appeared, but the truly important factors were the breakthroughs of old highs, capital inflows, and the turnover of chips, alongside the final ICO frenzy. Data from CoinGecko show that by early 2018, Bitcoin's market share once approached 38%. Healthy mid-phase expansions are often first established by BTC's credibility, then passed on to ETH and high-risk assets; if there are only low liquidity small coins surging at the beginning, it is more like localized speculation.
The structure of the 2020-2021 cycle is even clearer. After the pandemic shock, Bitcoin first completed the accumulation of chips, then broke through the high from before 2017; stablecoins, institutional allocations, and derivatives infrastructure amplified capital capacity together. Glassnode's review shows that from November 2020 to May 2021, long-term holders net distributed about 394,000 BTC, with a peak monthly distribution speed of about 150,000 BTC. In other words, the mid-phase of a bull market does not require "old players not to sell"; on the contrary: old chips start to take profits, but new demand is sufficient to absorb supply, which is the strongest phase of the trend.
Halving improves new supply but cannot create demand. Fidelity statistics show that the peaks after the halvings in 2016 and 2020 occurred about a year and a half later, but the returns diminished; the market capitalization/realized market capitalization multiple during the 2017 and 2021 cycles was close to 4, while for the 2024-2025 cycle, most of the time it will be about 2 to 3. A four-year cycle can provide a backdrop but should not serve as an exact calendar.
2. The earliest phase of a mid-phase launch in a bull market usually has seven distinct characteristics
First, prices complete a "breakout - pullback - stabilize again," rather than merely appearing as a large bullish candle. True trend confirmation requires the weekly level to break away from a long-term consolidation zone, with thinning volume upon pullback and exhaustion of selling pressure, and then a resumption of volume. If prices quickly fall back into the original range after a breakout, it is usually liquidity-induced bullishness or short squeeze, rather than a new trend.
Second, spot demand is stronger than contracts. During a mid-phase launch, volume will rise, but more importantly, the spot turnover, spot CVD, ETF purchases, and on-chain capital inflow will improve in sync. If price rises primarily from perpetual contracts, with open interest rapidly increasing while spot volume lags, the market will become very fragile: a slight pullback may trigger a series of long liquidations.
Third, realized market capitalization begins to accelerate. Realized market capitalization is valued at the price of the last on-chain movement for each BTC, closer to the capital cost entering the network. Glassnode points out that during the expansion phase of a bull market, realized market capitalization will sharply rise; after breaking historic high points, long-term holders realize profits, and new buyers come in at a higher cost, thus pushing realized market capitalization to be repriced. When prices rise but realized market capitalization stagnates, it indicates a lack of sufficient new capital to support the rally.
Fourth, short-term holders turn from losses to profits but have not yet become overly exuberant. When prices surpass their cost line and SOPR returns above 1, it signifies that recent buyers are no longer broadly cutting losses; when MVRV enters historical extremes, and nearly all chips are profitable, it resembles distribution more. In Glassnode's MVRV framework for long-term holders, below 1 corresponds to losses, 1 to 1.5 leans towards bear-bull transitions, 1.5 to 3.5 indicates balanced expansion, and above 3.5 enters a strong profit-taking motivation zone. The thresholds should not be mechanically copied, and the status transition is more important.
Fifth, the supply of stablecoins continues to expand. A positive net issuance over 30 days typically indicates new on-chain dollar liquidity. However, stablecoins also serve for payments and settlements, so an increase in supply doesn’t mean that all funds will buy coins; a spike in trading volume without an increase in supply may simply reflect turnover of existing stocks or high leverage trading.
Sixth, market breadth expands sequentially. A healthier path usually sees BTC strengthen first, then ETH/BTC improve, mainstream assets spread out, and finally small-cap coins get their turn. One can observe the BTC market share, ETH/BTC, and the proportion of the top 100 assets surpassing the 50-day moving average. An index rising with a vast majority of assets hitting new lows does not signify an all-encompassing bull market.
Seventh, pullbacks are still severe, but the recovery speed accelerates. Historical data compiled by Fidelity indicate that the 2015-2017 bull market often experienced approximately 20% pullbacks, while the 2018-2021 ascending cycle included even about 50% and 60% depth declines. A bull market is not synonymous with low volatility; the real distinction is whether key cost zones can quickly recover after being breached and whether long-term funds are absorbing chips or following the retreat during downturns.
3. Placing these characteristics in the context of the recent market
As of August 23, 2026, different quote sources show BTC at approximately $76,500 to $77,100. It previously dipped near $58,000 to $60,000 in June and was still around $62,600 in early August; between August 19 and 21, there was a rapid surge, peaking close to $79,500, and the cumulative closing price increased by about 18% over three days. This indicates a strong trend recovery but is still insufficient to independently prove that "the mid-phase of a new bull market has started."
Support for bulls first comes from ETFs. Data from Farside shows that from August 17 to 21, the US spot Bitcoin ETF recorded a net inflow of about $1.918 billion over five consecutive days, with about $517 million and $606 million on the 19th and 20th respectively. The rise is supported by real capital channels and does not rely solely on contracts.
However, the confirmation signal remains incomplete. DefiLlama's snapshot on August 23 shows that the total market capitalization of stablecoins is approximately $303.1 billion, with a 7-day growth of about 0.79% and a 30-day growth of only 0.03%. This indicates that although short-term liquidity has improved, there has yet to be sustained expansion over several weeks.
On the other hand, CoinGlass reported on the same day that BTC futures had approximately $53.05 billion in 24-hour trading volume, while spot trading was about $4.2 billion, with an open interest of about $54.94 billion. Different platforms may have varying coverage scopes, but "derivative activity far exceeds that of spot" itself is enough to indicate that there still exist overcrowding and liquidation risks in the upward process.
Market breadth also needs to be further validated. Recent CoinGecko snapshots show that BTC's market share remains around 56.7%, with no indication of the fully capital outflow state seen at the end of 2017. High BTC dominance may mean that institutional funds are still concentrated in high-quality assets, but it may also imply that most altcoins have not yet obtained real incremental funds. Therefore, a more accurate statement for the current situation is: the market is transitioning from bottom repair into the "attempted expansion" phase; bullish evidence has significantly strengthened, but has not yet completed the quadruple confirmation of stablecoins, spot volume, on-chain capital, and market breadth.
One must also pay attention to the historical locked positions above the price. In May 2026, Glassnode pointed out that when BTC rebounded above $80,000, the realized market capitalization net increased by about $2.8 billion over 30 days, still significantly below the level of more than $10 billion seen during past bull market expansion phases, and regarded around $86,000 as an important supply region. Although these figures are based on May's snapshot and cannot be directly regarded as today's exact support and resistance, they indicate that around $77,000 to $82,000 merely returns to an old trading area, still far from truly digesting higher-cost chips.
4. Key indicators to watch over the next four to eight weeks
The first group involves price structure: observe whether the weekly line can stabilize in the new cost zone of $73,000 to $77,000, and whether it can break through and hold the previous high supply zone of $79,500 to $82,000. If it breaks through and then falls back into the original range over two consecutive weeks, it should be treated as a false breakout rather than continually lowering one's stop loss standards.
The second group is incremental funds: simultaneously track the ETF five-day and twenty-day net flows, stablecoin 30-day net issuances, and changes in realized market capitalization over 30 days. The resonance of all three indicates high-quality expansion; if only the ETF is strong, it may still be a single-point situation for BTC.
The third group is leverage temperature: focus on the growth rate of open interest relative to market capitalization and spot volume, the duration of positive funding rates, quarterly contract basis, options skew, and liquidation scale. The danger is not that rates are too high on any particular day but that prices are range-bound, with open interests continuing to accumulate, and spot turnover declining — this usually implies that the next volatility will be amplified by forced liquidations.
The fourth group concerns chip behavior: during price pullbacks, check if the STH-SOPR can stabilize around 1, whether long-term holders maintain orderly distribution, and if exchange net inflows suddenly expand. If old chips transfer into exchanges and profits surge without a simultaneous increase in new capital, the bull market narrative may be serving to exit liquidity.
The fifth group involves market breadth and fundamentals: observe whether ETH/BTC can form an upward trend, and whether mainstream assets are supported by revenue, users, and real trading volume. New coins should also verify circulating market capitalization, FDV, future 90-day unlocks, and on-chain liquidity. Sectors may rise, but that does not mean any similar tokens will rise.
5. Eight types of risks to guard against at this stage
First, the false breakout risk. Rapid rises may include ETF buying, short covering, and chasing leverage simultaneously; as long as spot volume subsequently is insufficient, prices will fall back into the box.
Second, the risk of leverage liquidation. Do not use "this is a bull market" as a reason to increase leverage. A normal 20% pullback is sufficient to clear most high-leverage positions, and even if the long-term judgment turns out correct in the end, one may still be forced to exit early.
Third, liquidity mismatch of altcoins. Many tokens may appear to have small market caps but have even shallower tradable depths; easy to buy during rises, sell orders may penetrate multiple price levels during falls.
Fourth, unlocking and high FDV risks. Improvements in project fundamentals do not equate to improvements in token supply and demand. Team, investor, and ecosystem incentive releases may long-term offset new buying pressure.
Fifth, the yield trap. High stablecoin, staking, or LP yields often come from token subsidies, leverage cycling, or accepting depegging and smart contract risks, and cannot be deemed risk-free interest.
Sixth, institutional fund reverse risk. ETFs are strong marginal buyers but might also become transparent and continuous selling channels; cumulative holdings cannot just be counted while ignoring directional changes in five-day and twenty-day flows.
Seventh, macro correlation regression. The dollar, real interest rates, tech stock volatility, credit spreads, and regulatory changes still impact global risk appetite. The cryptocurrency market trades 24 hours and often amplifies shocks in weekend thin liquidity.
Eighth, failure of cycle models. Historically, there are few mature bull-bear cycles that can be completely compared; the changes in ETF, corporate treasury, options market, and regulatory structure have altered the composition of participants. Any conclusions like "prices must rise in a few months post-halving" should be viewed as narratives, not risk control rules.
Conclusion: First confirm capital, then discuss dreams
The current market situation is certainly more optimistic than from June to early August: prices quickly recover lost ground, ETFs continuously net inflow, and short-term stablecoin supply has also rebounded. However, the depth of spot trading, acceleration in realized market capitalization, 30-day expansion of stablecoins, and breadth in the altcoin market still need further confirmation. Therefore, defining the present as "a candidate window for the mid-phase launch of a bull market" is more responsible than directly announcing "a full-fledged main upward wave."
The strategy truly suitable for this phase is not to chase every narrative with full positions, but rather to build positions in layers: core positions focus on high liquidity assets like BTC and ETH; tactical positions wait for breakout pullbacks and capital flow confirmations; high-risk altcoin positions limit project loss; leverage should be used sparingly or not at all; pre-write invalidation conditions and staggered profit-taking rules, and retain a cash buffer capable of withstanding a 20% to 30% pullback.
The greatest risk in the early stages of a bull market is often not "rising too quickly," but that investors believe too early that they have fully understood the cycle. Prices can create confidence, but only sustained spot buying, capital inflows, and healthy chip exchanges can turn confidence into a trend.
免责声明:本文章仅代表作者个人观点,不代表本平台的立场和观点。本文章仅供信息分享,不构成对任何人的任何投资建议。用户与作者之间的任何争议,与本平台无关。如网页中刊载的文章或图片涉及侵权,请提供相关的权利证明和身份证明发送邮件到support@aicoin.com,本平台相关工作人员将会进行核查。


