Welcome to the Qinglan Crypto Classroom, I'm Sister Qinglan! No beating around the bush, let's get straight to the point. Today is Friday, February 13th, let's take a good look at the price movement of BTC ~
1. Technical Analysis: Looking from multiple time frames, a short-term rebound is difficult to change the long-term weakness
First, let's look at the most direct 15-minute chart, which shows the ultra-short-term movement. Wow, this volatility feels like riding a roller coaster! From last night's high around 68400, it plummeted down to about 65100, and now (09:45) it has rebounded to 66500. In terms of indicators, the RSI has clawed its way back from the previously oversold level of 27 to 59, and the MACD's green bars have just appeared, with the fast and slow lines signaling a potential golden cross at a low level. This indicates that a technical rebound after an oversold phase is happening, but don't celebrate too early. The upper range of 67000 to 67500 is a concentrated trading zone and also serves as a resistance point from the short-term moving averages MA5 and MA10, this is the first hurdle to overcome.
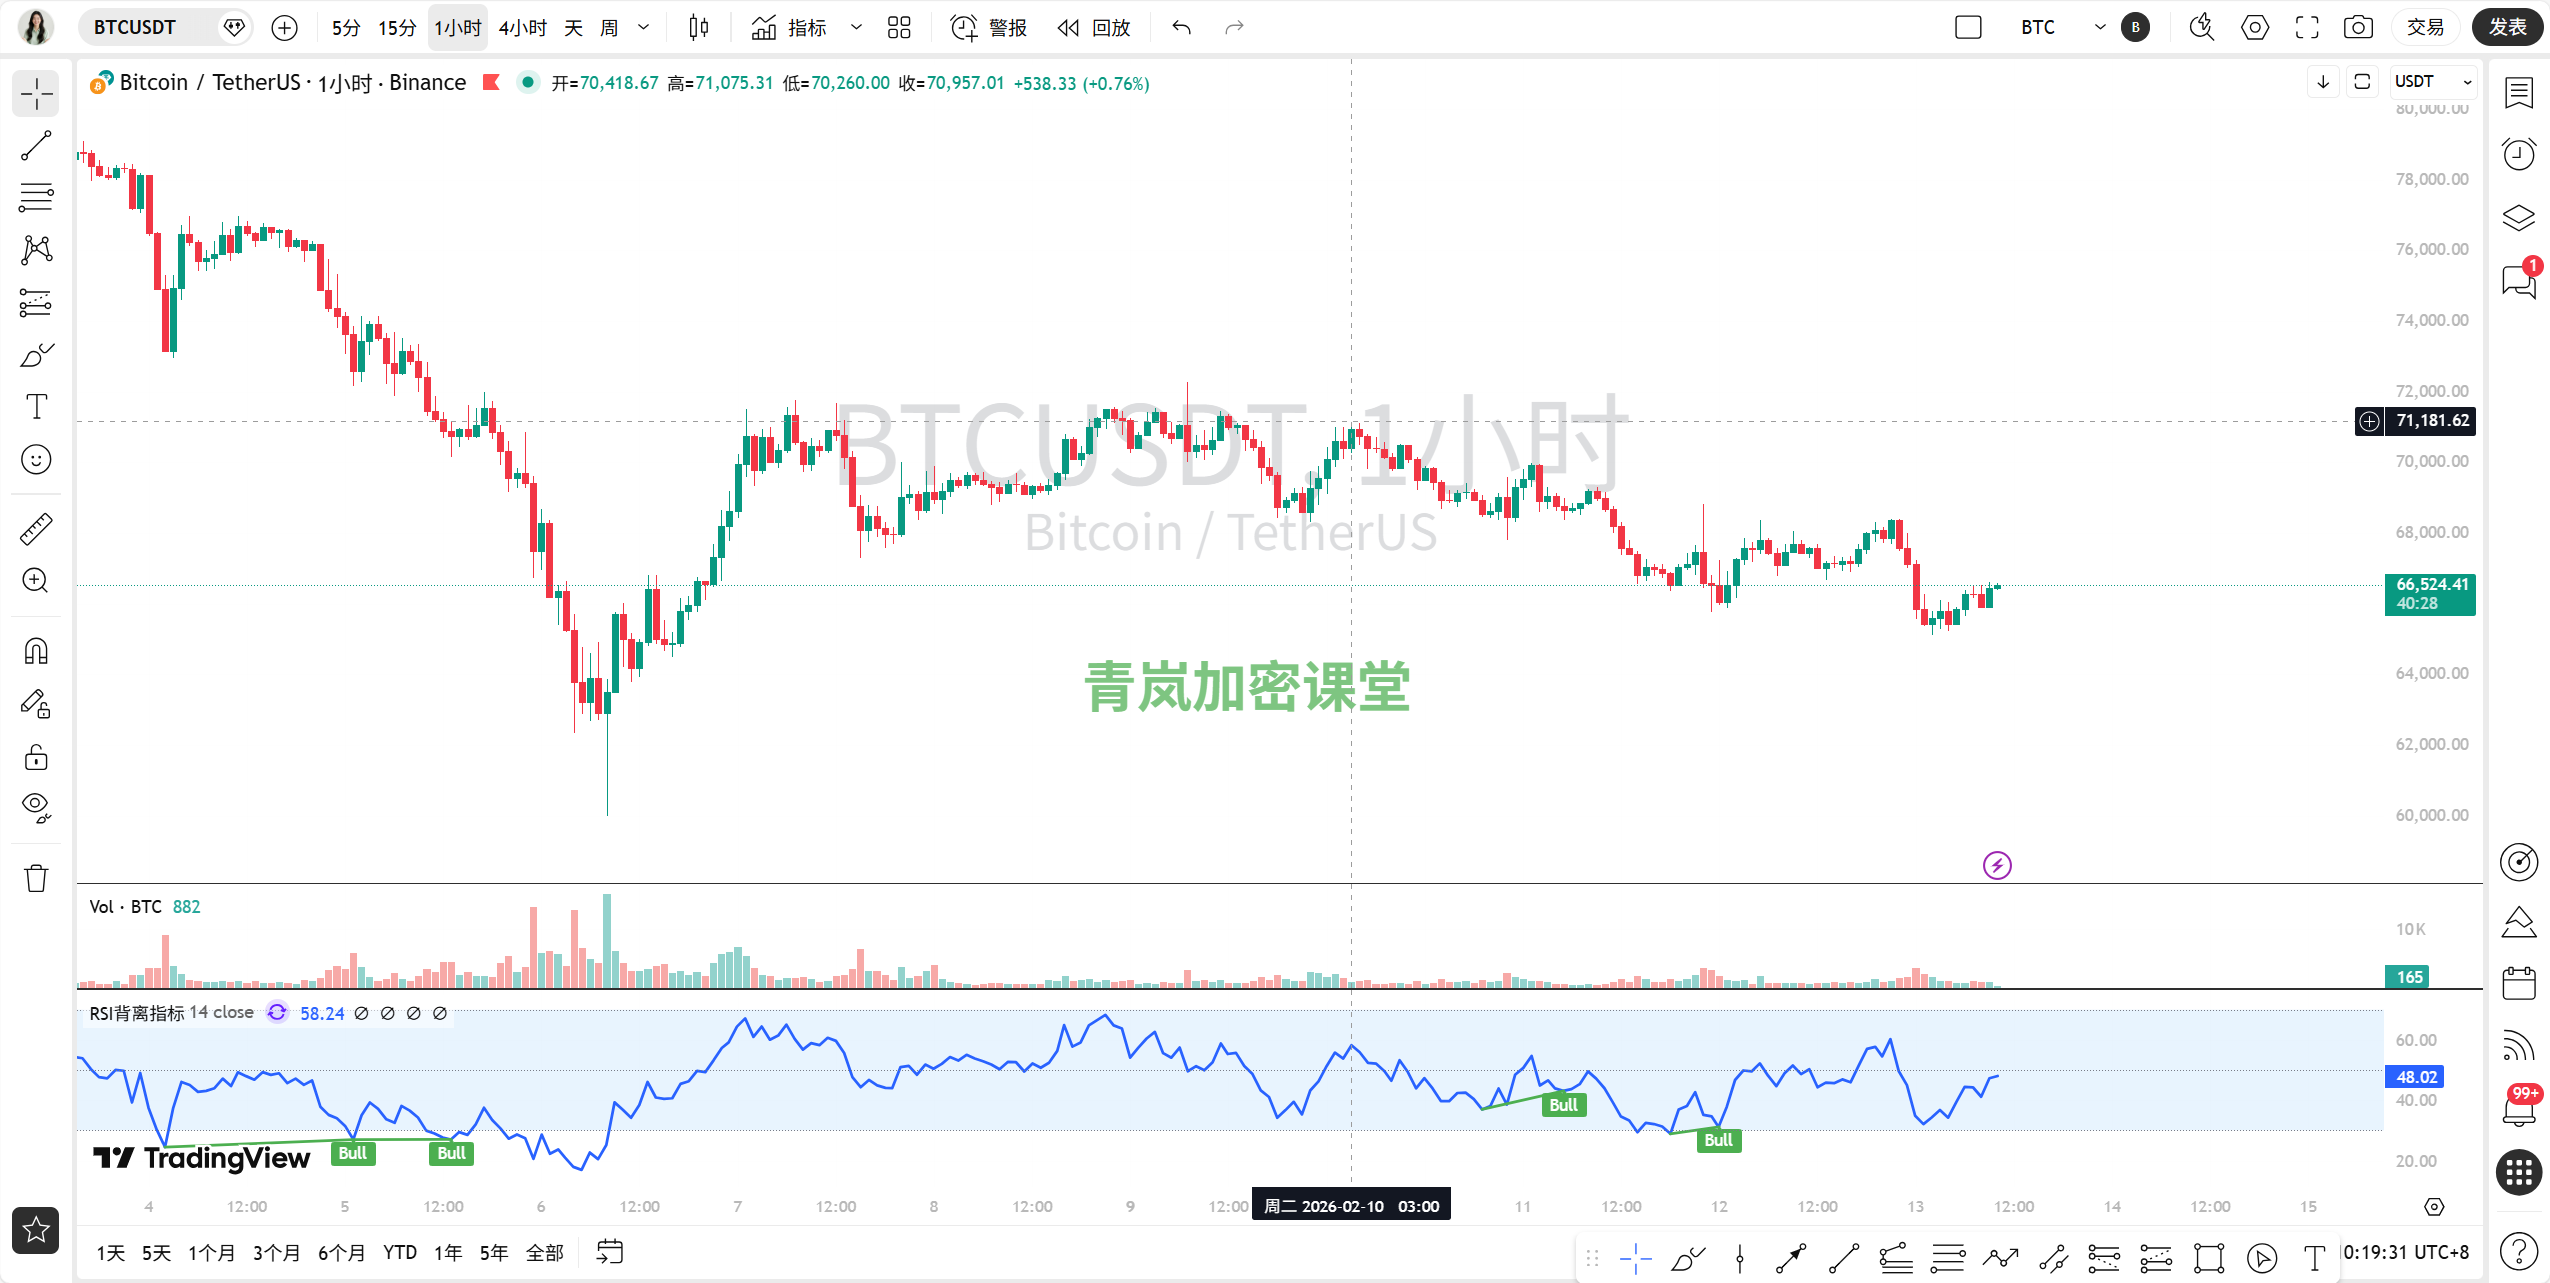
Next, looking at the 1-hour chart, the short-term pattern is clearer. The price has broken below all short-term moving averages. The MA5, MA10, and MA20 have all been breached, confirming a bearish arrangement, there's not much else to say. After the MACD death cross below the zero line, the green bars have slightly shortened, but the two lines are still entrenched in the deep zone, and it's not going to rise quickly. The RSI has been struggling in the weak area between 40 and 50, unable to break higher. So in this cycle, it is clear that the short-term trend is still downward; the recent rebound is merely a pullback in the downward process, so don't consider it a reversal. The key resistance is at 67300, which is where the MA20 is, and strong support is still yesterday's low of 65100.
Now let's look at the 4-hour chart, where the mid-term trend is a bit concerning. The price is being tightly controlled by the MA5 and MA10, unable to move, and is currently testing the previous low, in the range of 65100 to 65500. The MACD is below the zero axis with the two lines stuck together, but there is no golden cross yet; the green bars have only slightly contracted, indicating insufficient strength. The RSI is hovering around 40, which may dip down further at any moment. The mid-term trend is clearly bearish, and if the 65100 platform cannot hold, the next support will be in the range of 63000 to 64000, so everyone should keep a close watch.
Finally, looking at the daily chart, when we extend the timeline, the situation becomes quite severe. The price is running below all major moving averages, and the MA5 is about to death cross the MA10, which is not a good signal. The MACD is below the zero line, and the green bars have started to expand again, indicating that bearish forces are still increasing. The RSI is around 30, in a weak area, with no buying momentum. The long-term upward trend has been broken, and it has now transitioned into a weekly-level adjustment. The previous support level of 70000 dollars has now turned into a strong resistance level, making it extremely difficult to break through.
2. News: A Tale of Two Extremes, Driven by Market Sentiment
Today's news is like a battle of gods; on one side there's negative news crashing the market, while on the other side there are positive news supporting it, a rhythm of two extremes!
First, let's discuss the negative news, which was directly responsible for last night's crash. The most immediate pressure came from the plunge in U.S. stocks and the flash crash in gold; when these two fell, all market risk-averse sentiment was triggered, and cryptocurrencies naturally couldn't escape. To make matters worse, Coinbase experienced downtime at a critical moment, directly causing panic in liquidity, leading people to frantically sell, which compounded the issue. Additionally, South Korea has intensified crypto regulation, and information about major whales selling off due to huge losses has further undermined market confidence, making everyone hesitant to enter the market.
Of course, there are also some long-term positive news providing support; otherwise, the market would have plummeted even more. For example, JPMorgan has projected a target price of 266,000 dollars, and the London Stock Exchange plans to implement on-chain settlement. The CFTC has also established an innovation committee that has attracted many leaders from the crypto field, indicating that the crypto market is still moving towards institutionalization and compliance in the long run, acting as a stabilizing force for the market. Furthermore, BlackRock's exploration of DeFi is milestone news that should be followed closely.
However, to be honest, the current market's short-term panic sentiment has completely overshadowed the long-term optimistic expectations, so we must prioritize looking at short-term risks.
3. Comprehensive Prediction and Trading Strategy
By reviewing the trends in each time frame, it's clear: a long-term bearish outlook on the daily chart, a mid-term bearish view on the 4-hour chart, and a short-term bearish view on the 1-hour chart, with only the ultra-short-term 15-minute chart showing a rebound. This is a typical rebound correction in a downward trend; after the rebound, it will still revert to the main trend.
So Sister Qinglan's prediction is: rebound space is definitely limited, and the overall trend is still tilted towards a downward consolidation. The upper side is filled with resistance levels; it would be very difficult to achieve a direct V-shaped reversal to the upside, so everyone should not have overly high expectations.
Here are a few trading strategies for reference. Please note that all profits and losses are your responsibility:
1. For aggressive short-term traders wanting to catch the rebound: the current price is at 66500, and I really do not recommend chasing the high; it's too risky. If the price retraces to the range of 65800 to 66000 and can stabilize there without breaking, then a small position can be considered for a rebound, targeting around 67200 to 67500. Remember, you must act quickly and set a strict stop-loss below 65500; this is like playing with fire, with very high risks, so beginners should not try it easily.
2. For conservative trend followers wanting to short: wait for a signal of exhaustion in the rebound before entering. If the price approaches the range of 67000 to 67500, encounters resistance and fails to rise, and if the 1-hour chart shows a stagnation candlestick, such as a long upper shadow, then consider entering short. Set the stop-loss above 68000, initially targeting 65100; if that breaks, then look towards 64000, which is a more prudent way to follow the trend.
3. For mid to long-term position builders: take my advice, keep your hands off! The daily-level adjustment will not end quickly, and now is not the time to buy the dip. The real dip-buying opportunity will emerge when the 4-hour chart shows a clear bottom structure, such as a double bottom pattern, MACD bullish divergence, or the price breaking through 70000 dollars with sustained strength; only then should you consider entering. Rushing to buy the dip now will only result in being trapped.
More quantitative analysis of how real-time news affects market sentiment has been updated in my Qinglan Crypto Classroom,www.qinglan.org
Finally, let me share a trading quote that I always keep in mind: “The trend is your friend, but friends can also have temper tantrums; when their emotions become uncontrollable, the best respect is to keep your distance and wait for them to calm down.” This market "friend" is clearly throwing a tantrum right now, so let's stay quiet for a while, observe clearly before acting, and don’t rush to embrace it, or you will only end up getting hurt badly.
免责声明:本文章仅代表作者个人观点,不代表本平台的立场和观点。本文章仅供信息分享,不构成对任何人的任何投资建议。用户与作者之间的任何争议,与本平台无关。如网页中刊载的文章或图片涉及侵权,请提供相关的权利证明和身份证明发送邮件到support@aicoin.com,本平台相关工作人员将会进行核查。


