1. Key judgment on February 10: 70,000-71,000 is likely a short-term top
In the sharing on February 10, I mentioned that this bottom V rebound between 70,000 and 71,000 is highly likely to form a short-term top.
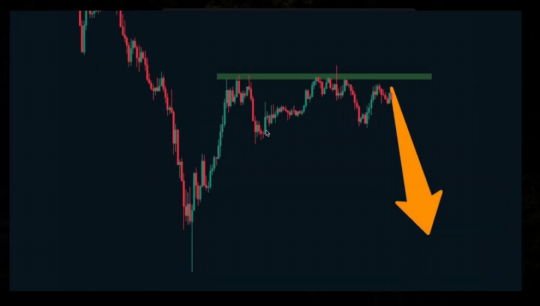
At that time, the price tested the upper horizontal resistance three times, but did not break through effectively. After the third failed test, we clearly stated the view of "looking for a new round of decline."
The price was above 70,000, and many people in the market chose to chase the high, believing that the bottom V rebound had been established and the market would continue to rebound, even targeting 75,000 or 80,000, with many looking above 85,000.
But I emphasized at that time:
This kind of bottom V rebound is not sufficient to drive a multi-cycle trend reversal, nor will it lead to a comprehensive reversal of the multi-cycle moving average structure.
Therefore, this rebound is most likely just a pullback after a phase of adjustment, followed by another round of decline.
As for whether it would break the previous low, I also mentioned that it was uncertain at that time.
2. Decline from above 70,000 to 65,000, completing a 5,000-point space
Subsequently, the market unfolded as expected, dropping from above 70,000 to a low of 65,000, forming a decline space of about 5,000 points.
If you followed this thought process, this bearish wave profit could have been fully captured.
3. Entering a consolidation phase: No recommendation to chase bearish
The day before yesterday, I already hinted:
The market may enter a consolidation adjustment phase.
The short-term focus should be on wave trading ideas.
Yesterday I also made it very clear:
Bearish positions can be taken, but it is advisable to observe.
The key is to monitor whether the support range below is effective.
When the price reached the key support area, we also shared this support range in the channel.
4. Importance of the 0.5-0.618 retracement zone
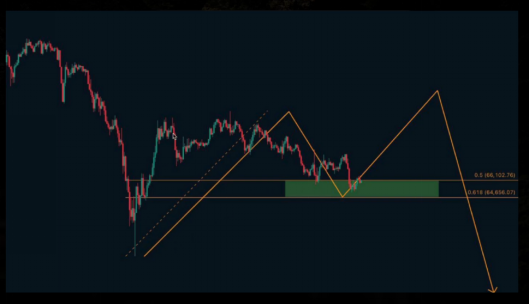
The entire retracement after this V rebound, if it retraces to the 0.5-0.618 zone, is considered a healthy pullback.
If this zone holds:
→ There is a chance to reach new highs
→ Form a structure to entice buyers
If it breaks below this zone:
→ Distribution power strengthens
→ Support below weakens
→ Most likely looking for new lows
This is a very clear structural logic.
Ultimately, the price retraced to this zone, stopped falling and started rising, and broke out of the area, with the structural curve forming a breakout upward.
5. 4,000-point rebound space
From the lowest point to the rebound high, a rebound space of about 4,000 points has been achieved.
If you entered long above 66,000 based on yesterday's thought process and used the previous low as defense, you could participate in this rise.
6. The core logic moving forward: entice buyers and force shorts
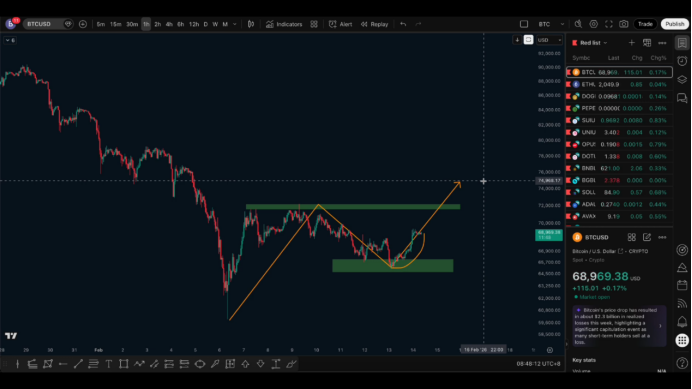
How to view the current structure?
I believe:
This rise is likely to break the previous high.
Forming a bullish structure of rise—pullback—then rise again.
Once this structure comes out, it is very intimidating.
Market sentiment will recover after breaking the high, and many people will begin to believe that the market has reversed.
This is typical of:
Entice buyers → Sweep shorts → Then drop again
Similar trading structures have appeared before, for example, after breaking above 94,000 to around 98,000, it then declined again.
I believe that the real long-term adjustment will unfold after reaching a new high.
7. My trading style explanation
You can review my style:
I rarely have one opinion today and another tomorrow.
Once a structural logic is clarified, I usually track it continuously and do not change easily.
Market movements are mainly based on a few expectations, with at most two paths.
Currently, my subjective probability leans toward:
Effective support range → First reach new highs → Entice buyers and force shorts → Then experience a long-term decline.
Of course, it has been mentioned before that the possibility of breaking lower directly cannot be ruled out, but the probability is relatively small.
8. Summary
70,000-71,000 top judgment has been established
Decline to 65,000 completes 5,000-point space
Key support range holds
Rebound of about 4,000 points
Next likely to follow a new high structure
Real adjustments may happen after a new high
Follow me, join the community, and progress together.

免责声明:本文章仅代表作者个人观点,不代表本平台的立场和观点。本文章仅供信息分享,不构成对任何人的任何投资建议。用户与作者之间的任何争议,与本平台无关。如网页中刊载的文章或图片涉及侵权,请提供相关的权利证明和身份证明发送邮件到support@aicoin.com,本平台相关工作人员将会进行核查。


