1. Review of Short-term Thoughts
In yesterday's video, I emphasized: It is not recommended to chase long positions at high levels in short-term trading.
At the current position, although a reversal structure has formed at the bottom, the neck line has been broken, and the key resistance has been surpassed, the market has indeed experienced a significant increase. However, even so, after this wave of rise, it is still not recommended to blindly chase longs at high levels.
The reason is simple: If you chase long here, your stop loss must be placed near the neck line support of the multiple bottoms below, making the risk-reward ratio not ideal.
Moreover, as mentioned yesterday, there is a possibility of a short-term downward correction. Complex adjustment markets are inherently difficult to trade because such structures typically exhibit irregular fluctuations and inconsistent rhythms.
A relatively safer approach is:
Price rebounds after a drop, betting on longs at low levels
Price retreats after a surge, betting on shorts at high levels
Focus on selling high and buying low
Try to avoid two common mistakes:
❌ Chasing longs as prices rise
❌ Chasing shorts as prices fall
2. Review of Yesterday's Trades
Based on the aforementioned judgments, we participated in a short position on Bitcoin at a high level yesterday, and have successfully exited this morning.
The overall logic remains unchanged:
Short-term: Expect a correction
Medium-term: Look for a rebound upwards
Long-term: Continue to pay attention to new downward trend opportunities
However, there is a key variable here - whether the support below can hold.
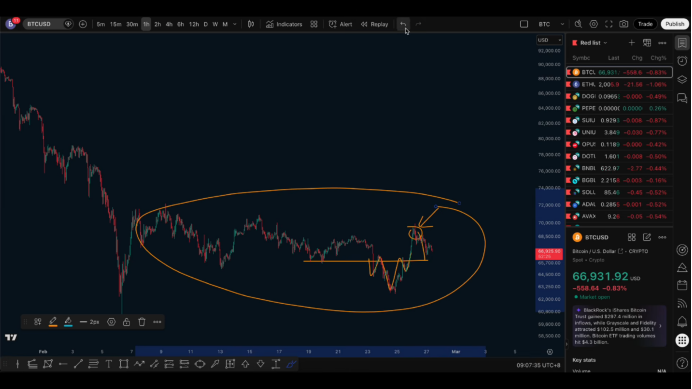
3. Key Levels for Bitcoin
The most critical support zone currently is:
🎯 The 65,000–66,000 range
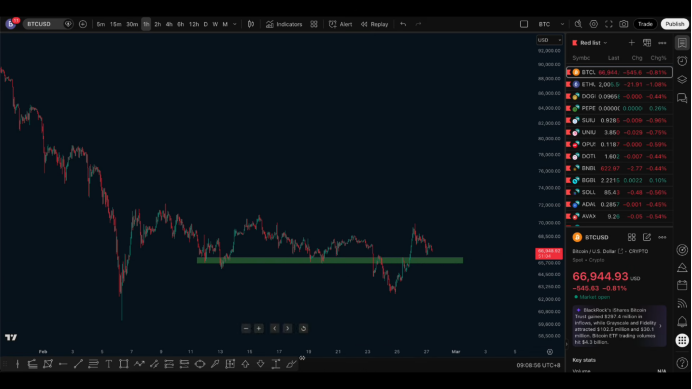
This position is crucial because:
This was once an important support
After breaking below, it formed effective resistance upon two retests
It is a typical area of support and resistance switch
The market built multiple bottoms here and then broke upwards the day before yesterday, followed by a pullback.
✅ The core observation point in the market next is:
During this round of pullback, can this support hold up.
4. Two Possible Paths
Situation One: Support Holds (Strong Bias)
If the 65,000–66,000 area can effectively hold, forming progressively higher swing lows, then the market has a chance to:
➡️ A second wave of upward movement
➡️ Break previous highs
➡️ Grab liquidity from above
This structure is technically valid.
Situation Two: Support Breaks (Weak Bias)
If a new low appears afterwards, leading to another breakdown, the market will likely enter:
➡️ Lower highs
➡️ Continuation of the bearish trend
This point requires vigilance.
5. Synchronized Analysis of Ethereum Structure
The structure of Ethereum is highly similar to that of Bitcoin.
After this significant surge, it is also not suitable to chase longs at high levels. We participated in a short position on Ethereum at high levels in our membership system yesterday.
Currently, it seems this round of decline has not fully completed.
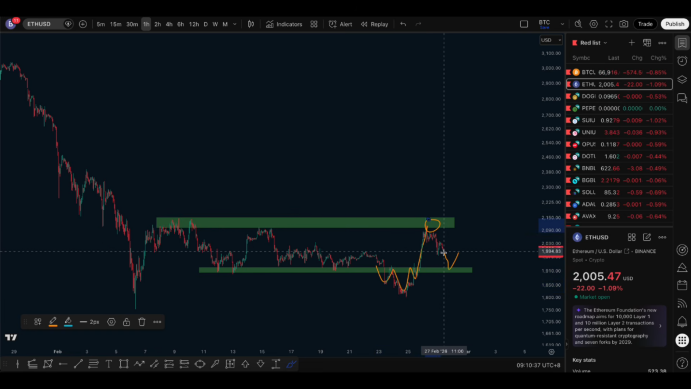
🎯 Key Support for Ethereum:
1,900–1,920 range
Here is also:
Previous support
Pressure test area after breakdown
Key level for bullish-bearish transition
6. Future Attention for Ethereum
In the short term, the greater probability is:
➡️ Continued downward pullback
➡️ Testing support near 1,900
Next, focus on observing:
If it stabilizes near 1,900 → There is hope for another rebound
If it effectively breaks down → The structure will clearly weaken
7. Review of Previous "Fake-out"
That rapid breakdown segment actually belongs to a fake-out behavior in hindsight. At that time, I also judged it as a continuation of the trend, but the final answer the market gave was a fluctuating structure.
This also once again demonstrates:
⚠️ The current market is still in a complex fluctuation phase
⚠️ One-sided thinking can easily result in getting hit back and forth
Moreover, from a time perspective:
The previous round of consolidation lasted nearly a month and a half
The current adjustment time has been less than a month
In terms of cycles, the fluctuation may not be fully over yet.
8. The Most Pragmatic Trading Strategy Currently
At this stage, my core view remains the same:
✅ Short-term: Expect ongoing fluctuating adjustments
✅ Operations: Focus on short-term selling high and buying low
✅ Missed positions: Better to wait, do not chase prices
Remember a simple principle:
Did not catch the high for shorts → Wait for the low for longs
Did not catch the low for longs → Wait for the high for shorts
If neither side was caught → Just keep waiting
Patience is part of trading itself.
9. Bold Predictions at Trend Level
If the market can effectively break above the previous highs, it likely means this round of adjustment is nearing its end, and the market is expected to enter a new upward phase.
However, if it cannot break above for an extended period and instead makes new lows, then in the next stage we must start considering more:
➡️ Lower highs
➡️ Continuation of the bearish trend
Follow me, join the community, and progress together.

免责声明:本文章仅代表作者个人观点,不代表本平台的立场和观点。本文章仅供信息分享,不构成对任何人的任何投资建议。用户与作者之间的任何争议,与本平台无关。如网页中刊载的文章或图片涉及侵权,请提供相关的权利证明和身份证明发送邮件到support@aicoin.com,本平台相关工作人员将会进行核查。


