Cryptocurrency Expert: Ethereum Daily Chart at 4.4 Grinding Bottom, 4-Hour Fluctuation, Key Entry Points for Bulls and Bears! Latest Market Analysis and Strategy Reference
The current price of Ethereum is 2045. Recently, the trend of the second largest cryptocurrency can be straightforwardly described as a large cycle grinding bottom and a small cycle fluctuating, leaving retail investors confused. From the daily chart, it has just climbed up from a low of 1736 and has not fully shaken off the remnants of the bear market; the 4-hour level is again being pulled back and forth in the 2000-2100 range, with neither side gaining a clear advantage. Many people are torn between whether to bottom fish or short, but the core issue is whether key support and resistance levels can hold. Today, based on two charts, I will explain the market logic and entry points for everyone to understand, even for beginners.
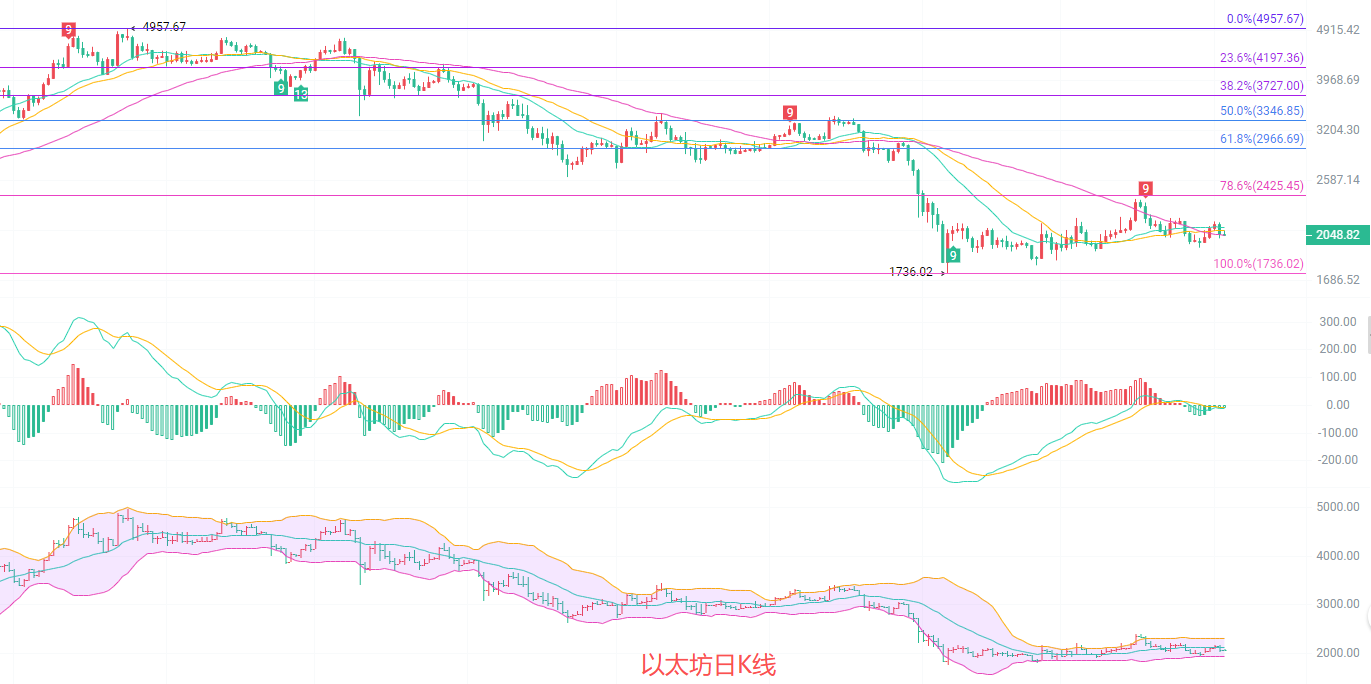
The daily chart shows an overall bottoming and fluctuating recovery market. In terms of moving averages, MA20 and MA30 are still above the price, forming resistance, while MA60 coincides with the current price, becoming a dividing line. The MACD indicator shows that the green bars are consistently shortening, with DIF and DEA gradually converging, and the bearish momentum is continuously weakening, indicating a possibility of a golden cross, which means the downward momentum has basically been released. The middle track of the Bollinger Bands at 2117 is a strong resistance, while the lower track at 1923 is a strong support. The price operates in the lower part of the Bollinger Bands, overall in the bottoming phase, waiting for a breakout to open up upward space.
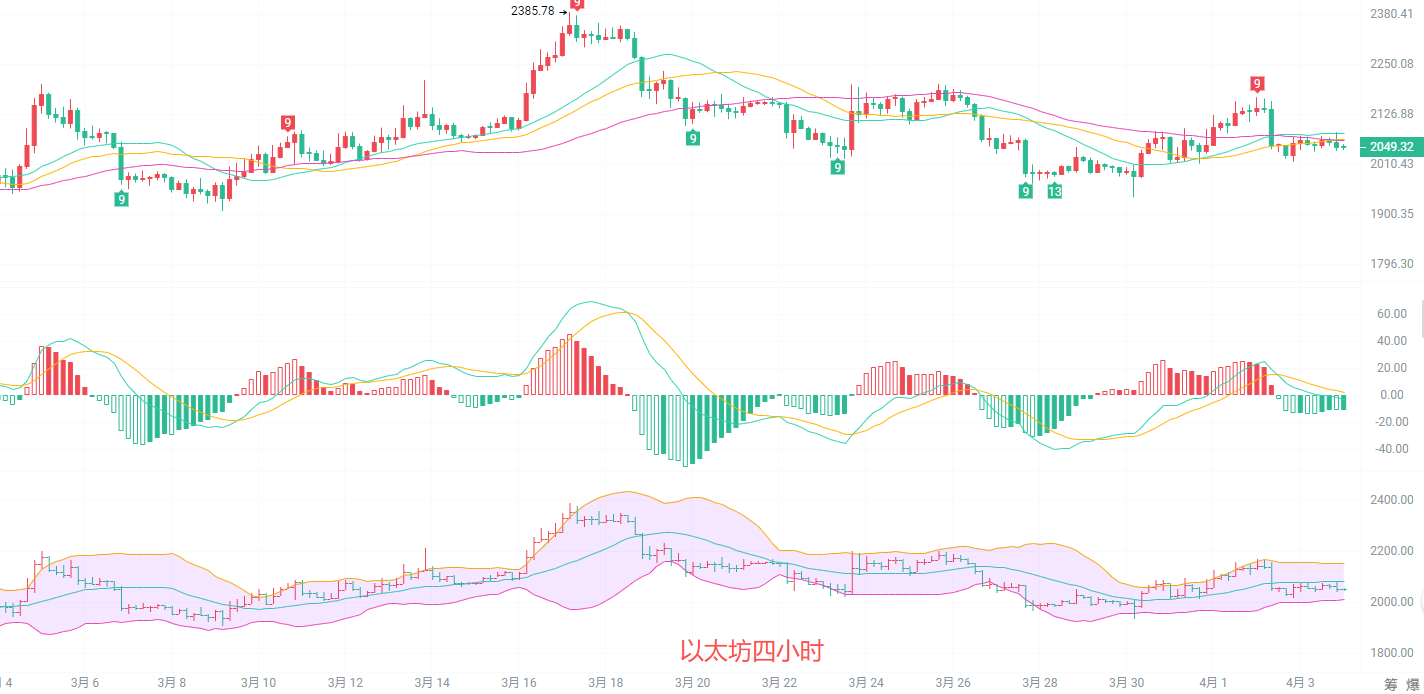
The 4-hour chart is in a narrow range of weak fluctuations. The moving average system shows a downward trend after a period of adhesion, with MA20, MA30, and MA60 all above the price, forming resistance to any rebound, indicating weakness in short-term rebounds. The MACD indicator shows a slight increase in green volume, with bearish momentum slightly increasing, suggesting a possibility of testing support. The middle track of the Bollinger Bands at 2081 is the resistance level, while the lower track at 2010 is the support level, with the price operating in the middle to lower track of the Bollinger Bands, and a directional choice is imminent, necessitating close attention to breakout conditions.
Short-term reference: (Actual data is updated, please consult the author for details)
Moving up from the lower range of 2010 to 2020, stop-loss at 1980, target looking at 2080 to 2120
Moving up from the upper range of 2080 to 2100, stop-loss at 2130, target looking at 2020 to 2000
Specific operations should be based on real-time market data. For more information, please consult the author. There may be delays in article publication; it is recommended for reference only, with risks borne by the reader.

Warm reminder: The above content is created solely by the author of this public account. Any advertisements at the end of the article and in the comment area are unrelated to the author. Please discern carefully. Thank you for reading.
免责声明:本文章仅代表作者个人观点,不代表本平台的立场和观点。本文章仅供信息分享,不构成对任何人的任何投资建议。用户与作者之间的任何争议,与本平台无关。如网页中刊载的文章或图片涉及侵权,请提供相关的权利证明和身份证明发送邮件到support@aicoin.com,本平台相关工作人员将会进行核查。


