Cryptocurrency Expert: On April 3, 2026, Ethereum's daily chart is dominated by bears, with a battle between long and short positions on non-farm payroll night, a complete analysis of key support and resistance! Latest market analysis reference
Ethereum's current price is 2045, and the recent market can be described as a roller coaster. Initially, it rebounded from a low of 1736, leading many to believe a bull market was coming, but on April 2, a large bearish candle sent it back down. Now the price is stuck around 2046, unable to go up or down, with both bulls and bears locked in a tough battle, leaving those with positions feeling uncertain. In reality, whether going long or short, the core focus is on identifying key support and resistance levels, without blindly following trends. Next, we will break down the current market conditions and operational ideas using technical analysis.
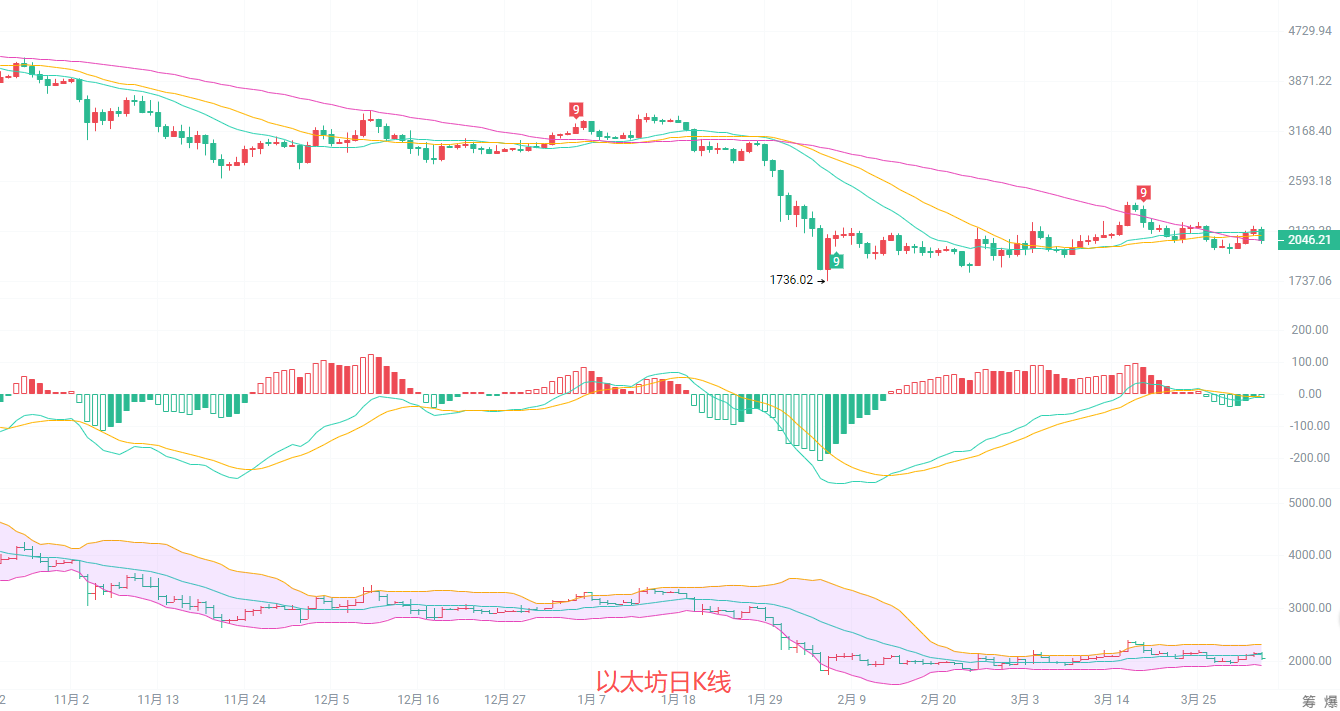
The daily K-line reached a high of 2158 and a low of 2015, with strong downward force being released. The moving average system shows a downward arrangement, with MA20, MA30, and MA60 all pressing down on the price. The MACD indicator shows that the DIF and DEA are in a death cross below the zero axis, with green bars continually increasing, and downward momentum still being released. The Bollinger Bands are opening downward, and the price is operating near the lower band, with strong support at the previous low of 1736 and resistance at the strong Fibonacci level of 2425. In the short term, the daily level is still in a weak downward range, with limited rebound potential.
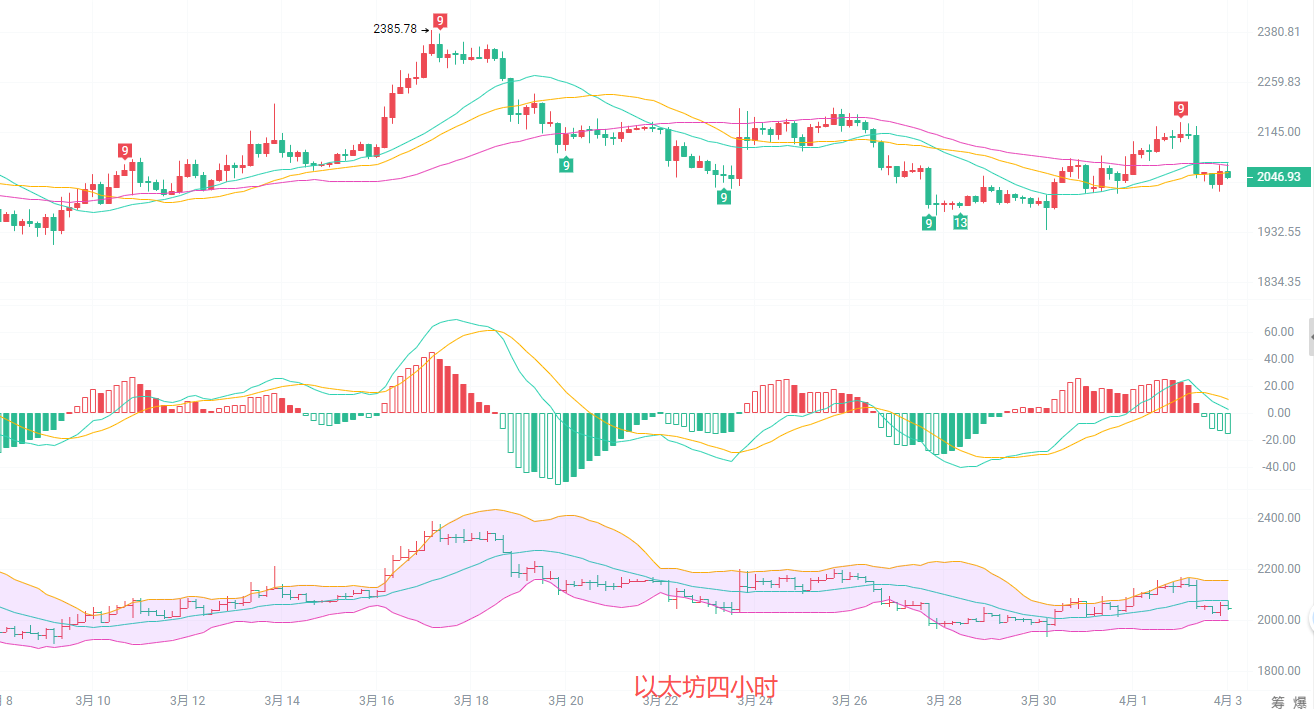
On the 4-hour chart, the price fell back after a previous rebound to 2126, with MA20 and MA30 flattening out and then turning downward, forming short-term resistance. The MACD indicator shows that the red bars are shortening rapidly, and the DIF and DEA are about to death cross, indicating a decrease in upward momentum, with downward force starting to gain strength. The midline of the Bollinger Bands is turning down, with the price breaking below it and testing support at the lower band, currently around 1999. Key resistance levels above are the upper Bollinger Band at 2157, and the previous high at 2385, indicating a bearish short-term outlook.
Short-term reference: (Operational data has been updated, please consult the author for details)
Short positions from 2060 to 2080, stop loss at 2100, target looking at 2010 to 1980
Long positions from 2000 to 2010, stop loss at 1980, target looking at 2080 to 2120
Specific operations should be based on real-time data from the market, for more detailed information you can consult the author. There may be delays in article publication, so it is recommended for reference only, with risks taken at your own discretion.

Friendly Reminder: The above content is exclusively created by the author of the public account. Advertisements at the end of the article and in the comment section are unrelated to the author, please differentiate carefully, thank you for reading.
免责声明:本文章仅代表作者个人观点,不代表本平台的立场和观点。本文章仅供信息分享,不构成对任何人的任何投资建议。用户与作者之间的任何争议,与本平台无关。如网页中刊载的文章或图片涉及侵权,请提供相关的权利证明和身份证明发送邮件到support@aicoin.com,本平台相关工作人员将会进行核查。