At the beginning of the fall, some people panicked! In fact, as emphasized in my previous analysis, the daily chart is currently in a high-level range of oscillation structure. Do not expect the market to keep rising. From last week's second test of the 69,600 bottom to this week's high point above 67,200, the increase reached 7,600 points. Even in a one-way trend, it is normal to see a pullback of this magnitude. Our mid-term long position layout at the 60,000 mark also notified of reducing positions after reaching the second stage target of 68,000, and warned of resistance at the high level in the article. So, what kind of impact and changes will this pullback have on the future trend? Let's continue to analyze.
First of all, this rebound was originally expected to be completed in three stages: 64,800-66,800-68,000. After reaching a high of 67,200 yesterday, there was a significant retracement. Before the retracement, the daily chart actually showed three tops above the 67,000 mark, and it was precisely because of the repeated pressure from the short-term bulls at this level that led to yesterday's retracement. However, with the coin price touching 67,200, it was actually only 800 points away from our third target of 68,000. On the daily chart level, we will take 68,000 as the watershed in the range structure. Even if there was a rebound to near 68,000 yesterday, a pullback should not be surprising, because this level will not be easily broken through. When the coin price breaks through the second stage of 66,800, we need to pay attention, especially if there is continuous resistance above.
Now that the pullback has occurred, the next consideration in the trend is:
First, a second round of retracement initiated at 67,200 as the pressure point. If this situation is established, the subsequent market will need to break the previous low support line of 59,600.
Second, the current trend continues to maintain the rebound trend with 59,600 support as the starting point. In this stage, after the short-term pressure and retracement at 67,200 are adjusted, there will be a second rebound to break the high and continue to test the 68,000 mark. If the subsequent daily chart can break through and stabilize at the 68,000 mark, Bitcoin will continue to challenge the top resistance of 72,000-73,000.
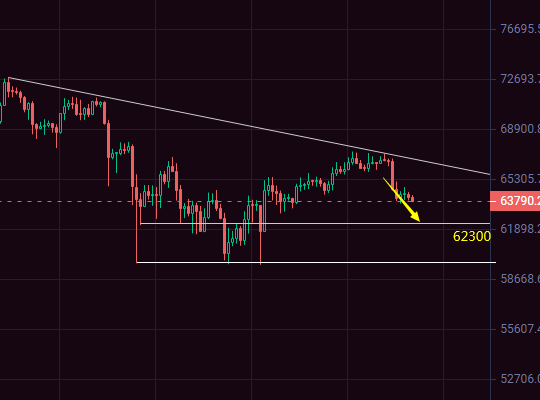
How to judge the above two trends, the watershed is 62,300!!! This short-term pressure and retracement, if not breaking through 62,300, we believe that this round of temporary rebound still has the possibility of a second continuation. If this level is breached, Bitcoin will most likely continue to test the 60,000 mark or even lower.
The daily chart formed a bearish pattern with a large evening star retracing the gains, so for the intraday, it's either a continued bearish trend or a volatile adjustment. Therefore, today's main focus is on shorting, shorting on rebounds, and shorting on breaking points in the short term. Do not go long again. In the early session, continue to hold the short position from 65,500 to 65,800, with a target of 63,500. If it falls below the early morning low and rebounds above 64,000, continue to short. For more analysis and recommendations, please follow the public account: Xiao Feng's Coin Analysis!
This article is original by myself, Xiao Feng. The above analysis is only my personal opinion, for reference only. Investment involves risks, so be cautious when entering the market. Please indicate the source when reposting!
免责声明:本文章仅代表作者个人观点,不代表本平台的立场和观点。本文章仅供信息分享,不构成对任何人的任何投资建议。用户与作者之间的任何争议,与本平台无关。如网页中刊载的文章或图片涉及侵权,请提供相关的权利证明和身份证明发送邮件到support@aicoin.com,本平台相关工作人员将会进行核查。


