Author: RootData
Introduction
In 2026, TradFi assets are becoming a new battleground for cryptocurrency exchanges.
As precious metal assets like gold and silver and global stock markets such as US and Korean stocks become increasingly active, more and more cryptocurrency exchanges are shifting TradFi products from marginal business to core product lines. Assets that could only be traded in traditional brokerages and financial markets are now entering cryptocurrency trading platforms in the form of tokenized assets, perpetual contracts, and more.
Cryptocurrency exchanges are also using this to open up new growth spaces, breaking the long-standing cyclical shackles of the cryptocurrency market, which has also made TradFi a new competitive variable for major exchanges.
In this context, RootData will observe the development status of TradFi in the cryptocurrency market from multiple dimensions, including market scale, trading structure, exchange competition, and the core sub-market of stock derivatives (contracts).
This report is based on statistical data from the TradFi sectors of several leading exchanges such as Binance, Hyperliquid, OKX, Gate, and Bybit, covering tokenized asset-related contracts and spot transactions, excluding real stock transactions from traditional brokers. Given that current liquidity and users for TradFi trading are still highly concentrated on leading cryptocurrency trading platforms that have launched this category, selecting these core platforms for horizontal comparisons can more accurately reflect the current scale, structure, and competitive landscape of the cryptocurrency TradFi market.
1. Overview of the Cryptocurrency TradFi Track
1. Cumulative trading exceeded $1.3 trillion in H1 2026, entering an explosive growth phase
In the first half of 2026, the cryptocurrency TradFi track has shifted from "marginal exploration" to "explosive increase" phase. Sample data from leading mainstream exchanges for H1 2026 has surpassed $1.3 trillion, while the full-year trading scale of the TradFi sector in 2025 was only in the hundreds of billions range, indicating that the trading scale in just the first half of 2026 is already ten times that of the previous year.
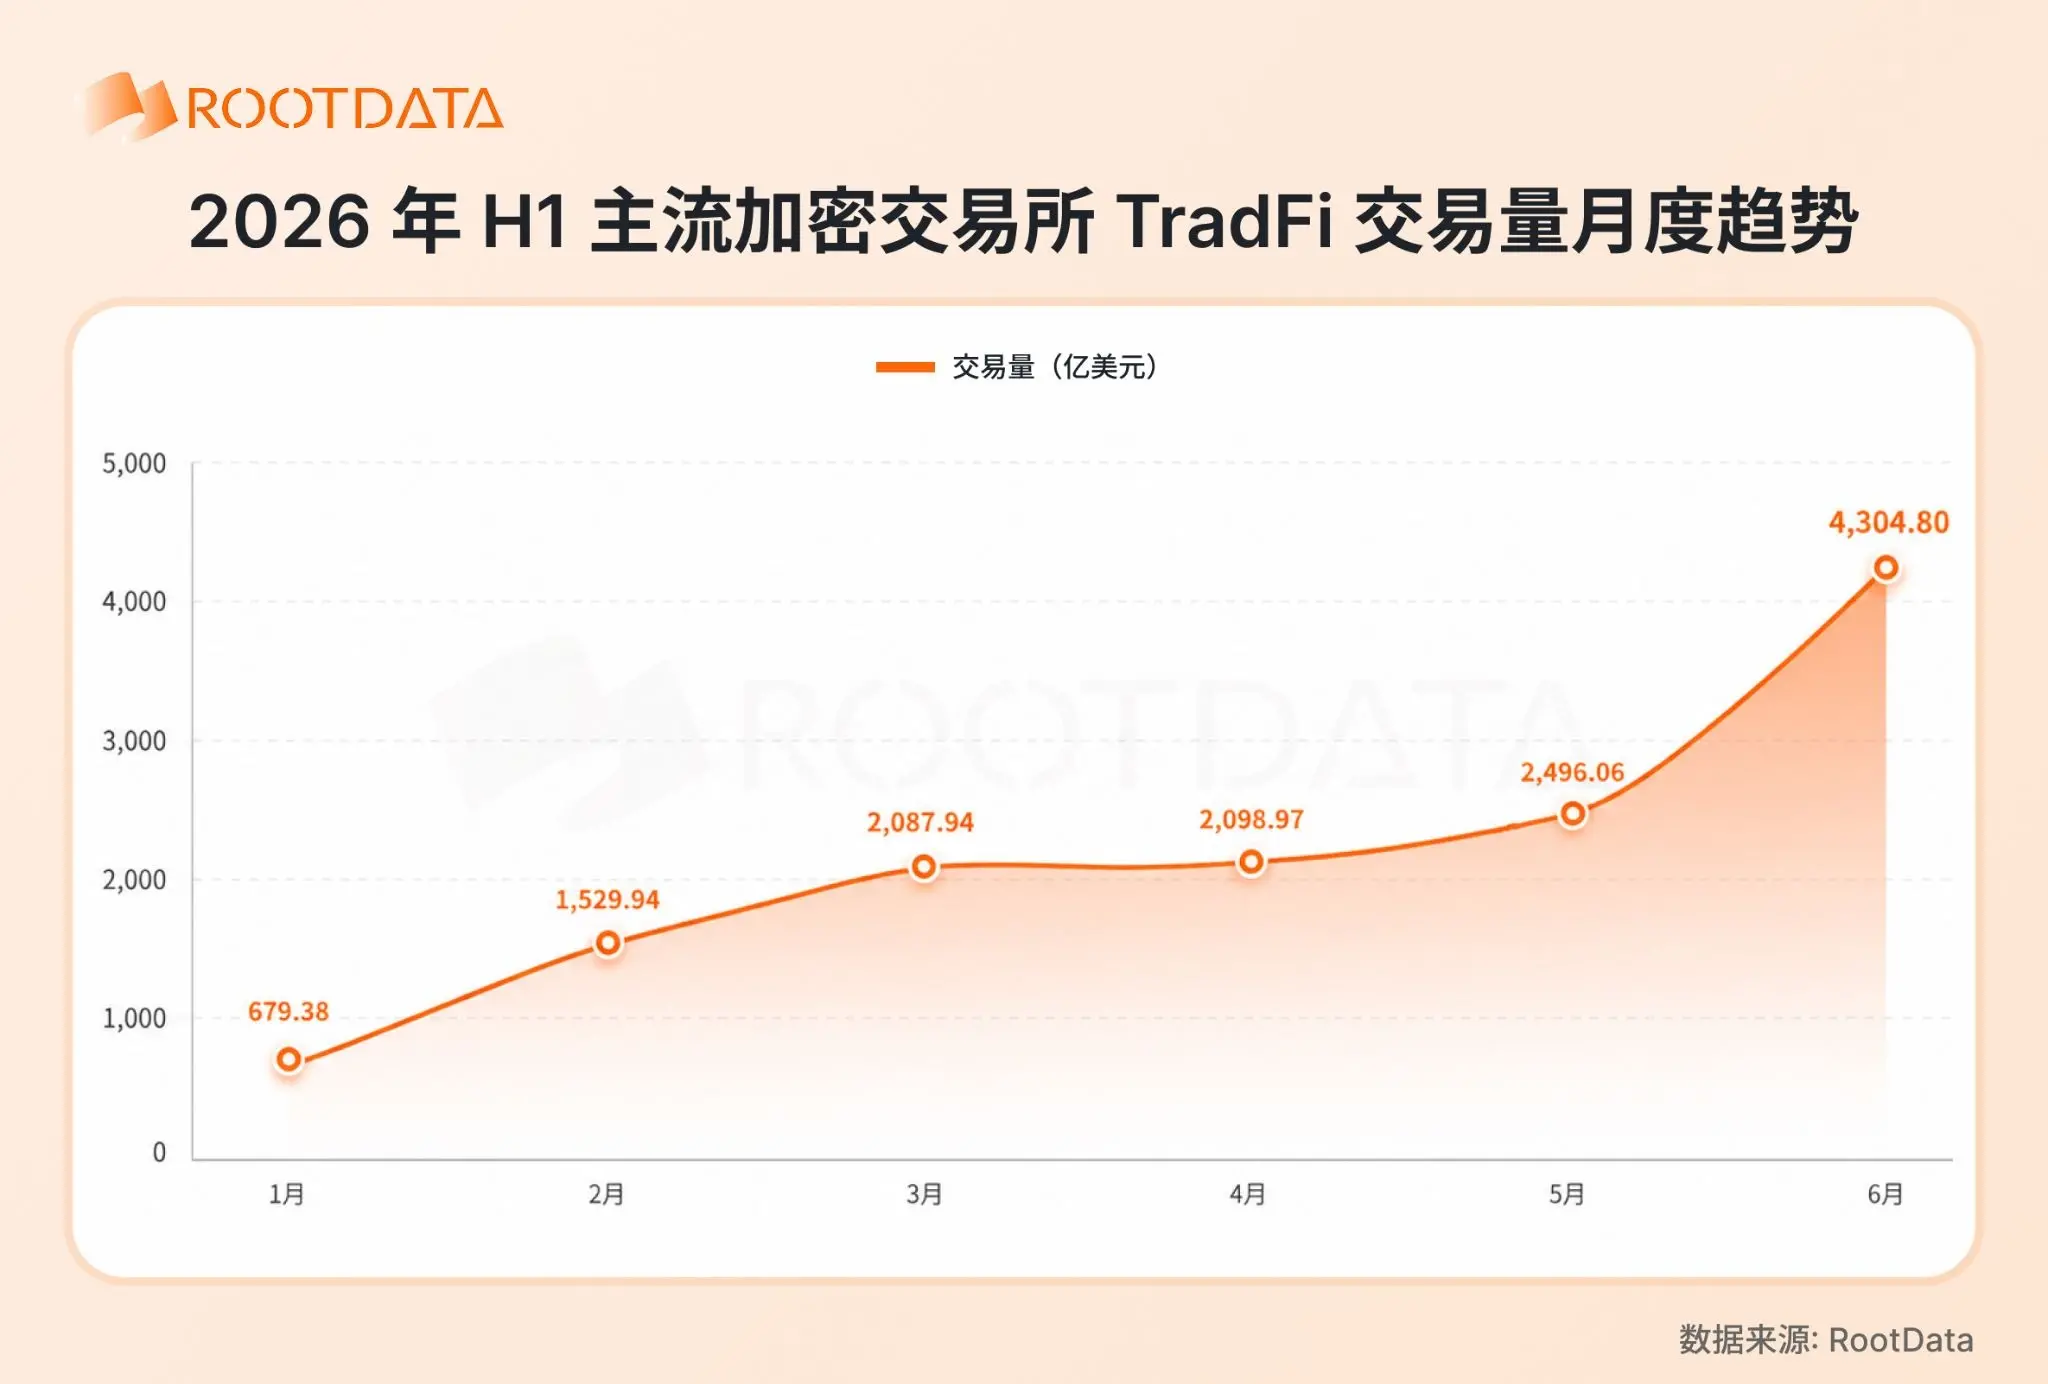
The backdrop for this growth is the forward布局 of cryptocurrency exchanges in TradFi and the resonance with the traditional financial market's trends.
Since 2025, mainstream platforms represented by Binance, OKX, and Gate have continued to enhance their TradFi product lines, completing the advance布局 of infrastructure. With strong performances in global stock markets such as precious metals and US and Korean stocks this year, exchanges that have strategically advanced into cryptocurrency TradFi have catered to a vast external demand and the dividends of the traditional financial market by actively launching popular TradFi asset targets and continually iterating their functions.
From the monthly trends, the trading volume was $67.94 billion in January, with market focus still on precious metals tokens like gold, while the spot ratio of 7.48% reflects the brief popularity of precious metal RWA at the start of the year. Starting in February, the TradFi trading scale surged by 125.2% month-on-month to $152.99 billion, breaking the billion-dollar threshold; in June, it again grew by 72.5% month-on-month to $430.48 billion, setting a new high for the first half of the year.
The trading volume in June alone reached 6.3 times that of January, with the average monthly trading center shifting from under $70 billion at the start of the year to over $400 billion. If the second half maintains the first half's level, the annual TradFi trading volume is expected to reach around $3 trillion.
2. Derivatives dominate the TradFi sector
In H1 2026, contracts dominated the TradFi sector, with a cumulative trading volume exceeding $1.3 trillion, accounting for 98.59%, making it the absolute main force of the TradFi track; spot trading only accounted for $18.558 billion, making up less than 1.5%. The highest spot ratio in January was 7.48%, which rapidly declined to below 2% and remained low, with the contract dominance gradually established starting in February.
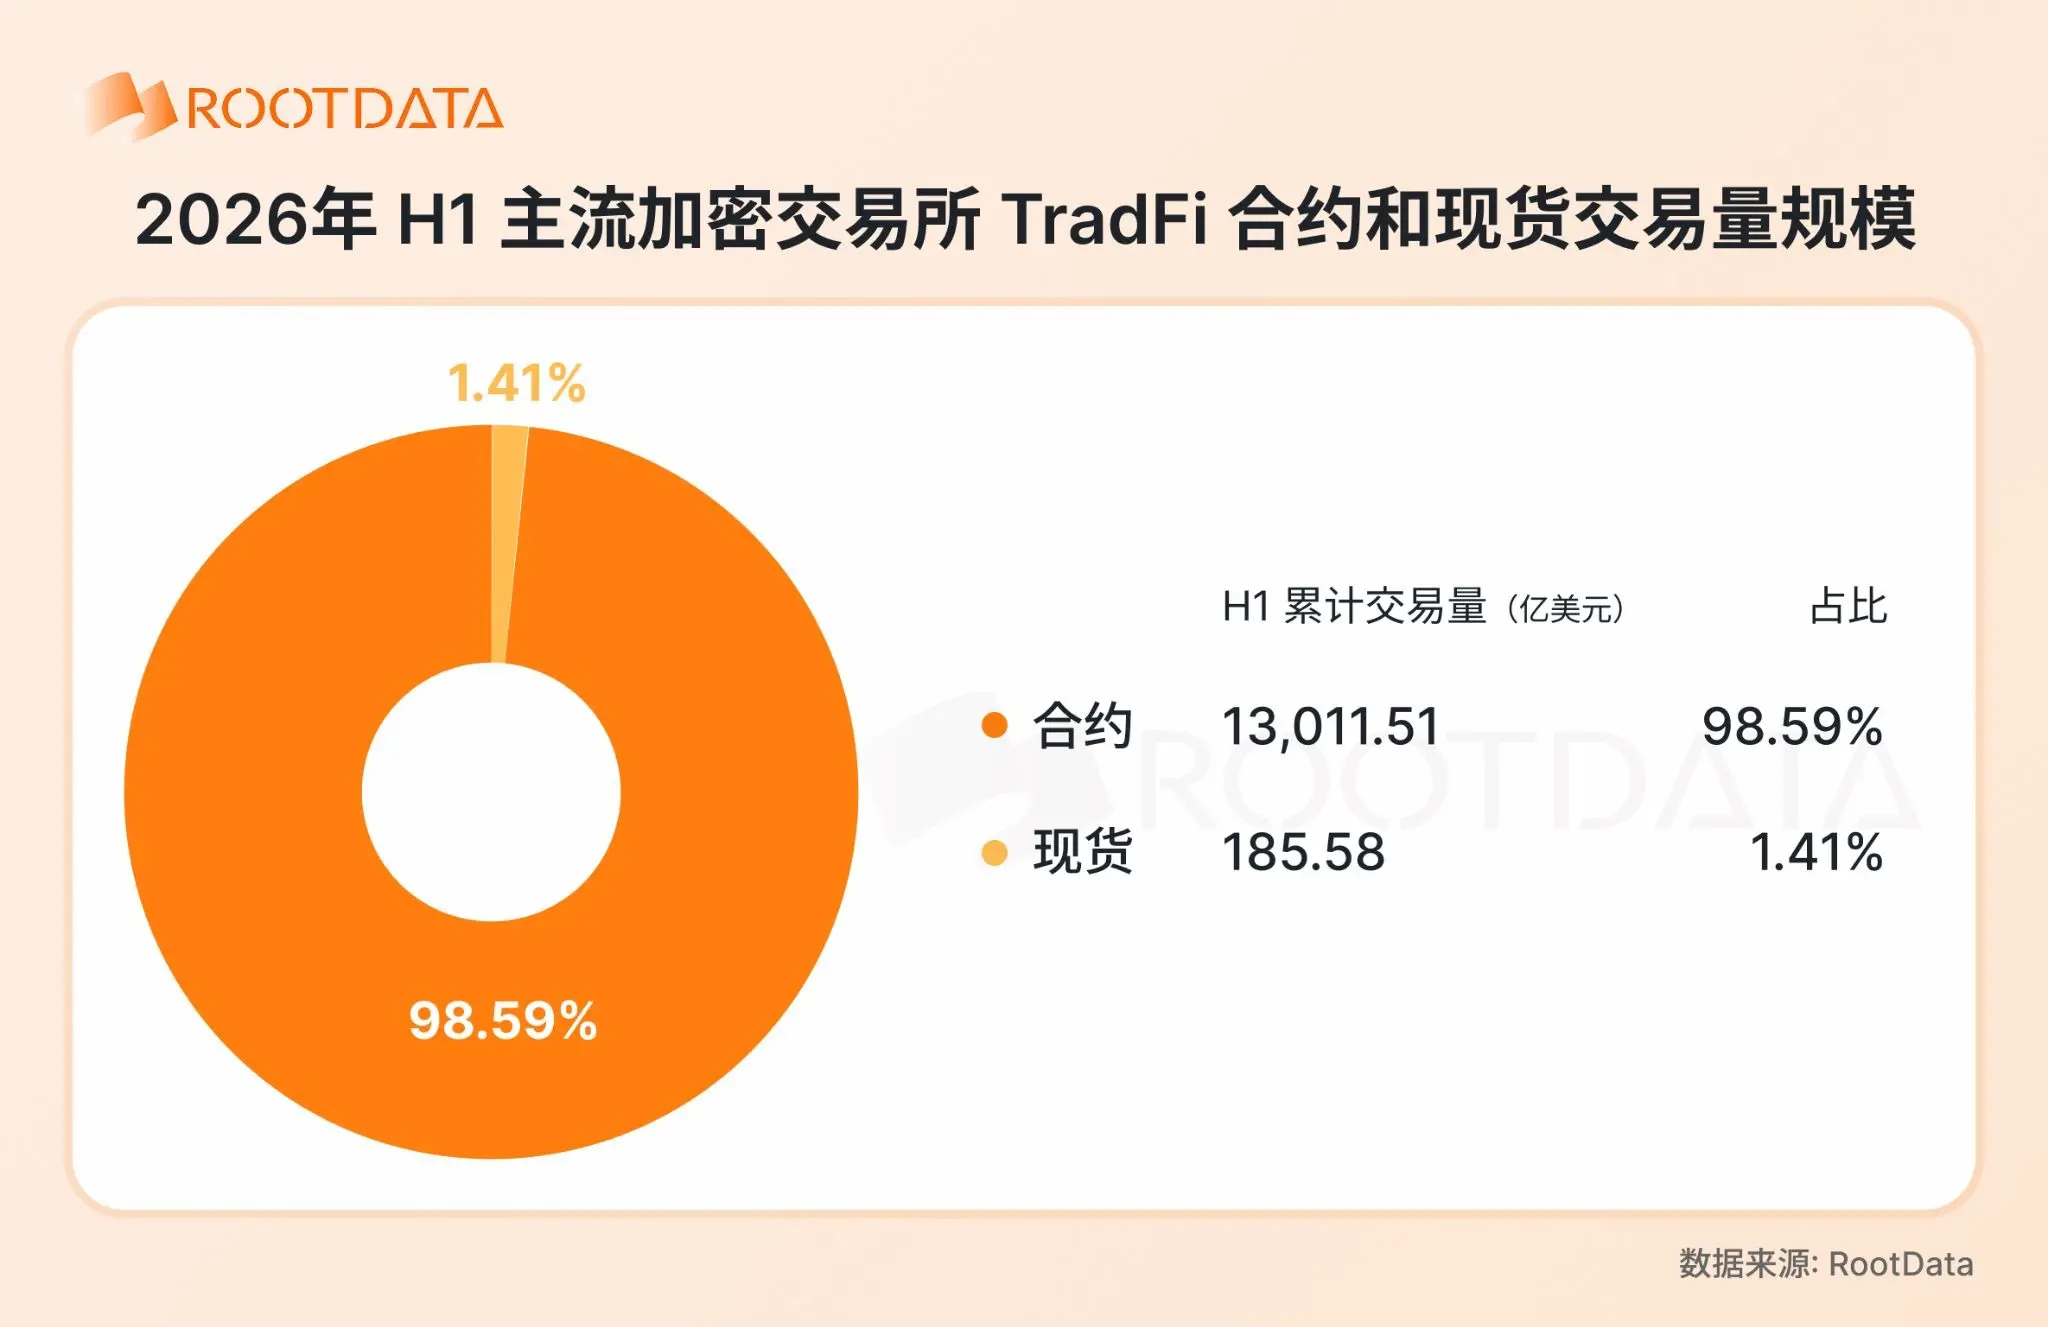
Among them, stock derivatives are dominant, with asset coverage showing that the five major exchanges have launched TradFi contract targets, over 90% of which are stocks and stock ETFs. From the positional data in the first half of 2026, popular TradFi assets like SNDK, SPCX, SK Hynix, and XAU saw large-scale growth in position size, with XAU gold contract OI once exceeding $700 million, and SPCX OI peak over $500 million.
2. Current Competitive Landscape of Cryptocurrency Exchanges in TradFi
1. Trading volume share: From Binance's "dominance" to multi-tier competition
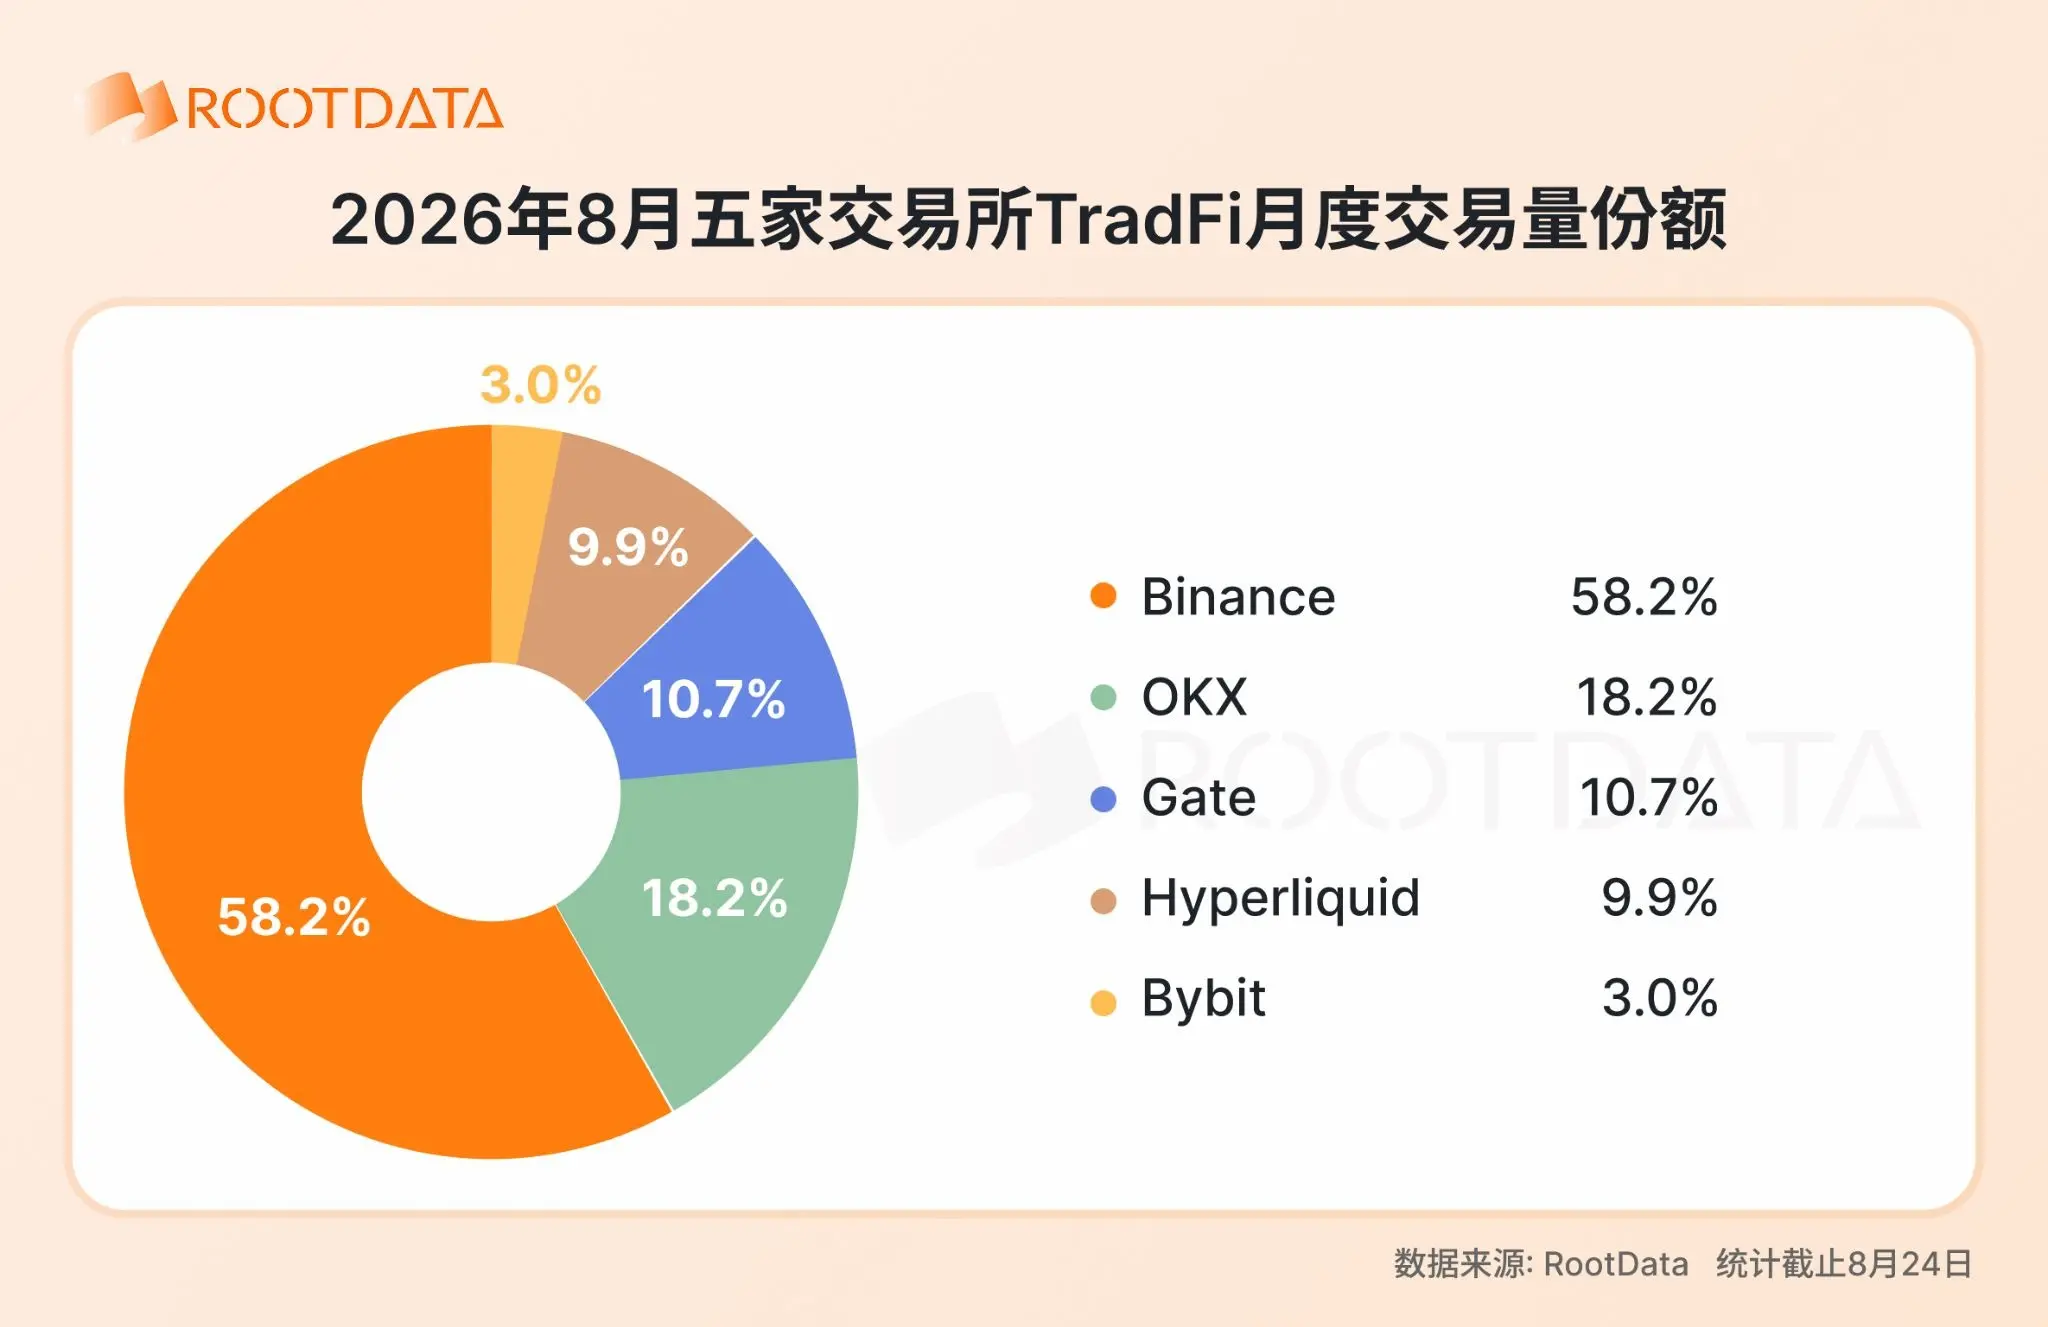
The traffic concentration in the TradFi track is undergoing structural changes. From cumulative data from January to August 24, 2026, the total TradFi trading volume from five exchanges is approximately $1.90 trillion, with Binance leading at $1.29 trillion and a 68.3% share, remaining the absolute dominant player. However, when extended to a monthly perspective, Binance's share has gradually decreased from 78.8% in January to 58.2% in August, a drop of over 20 percentage points.
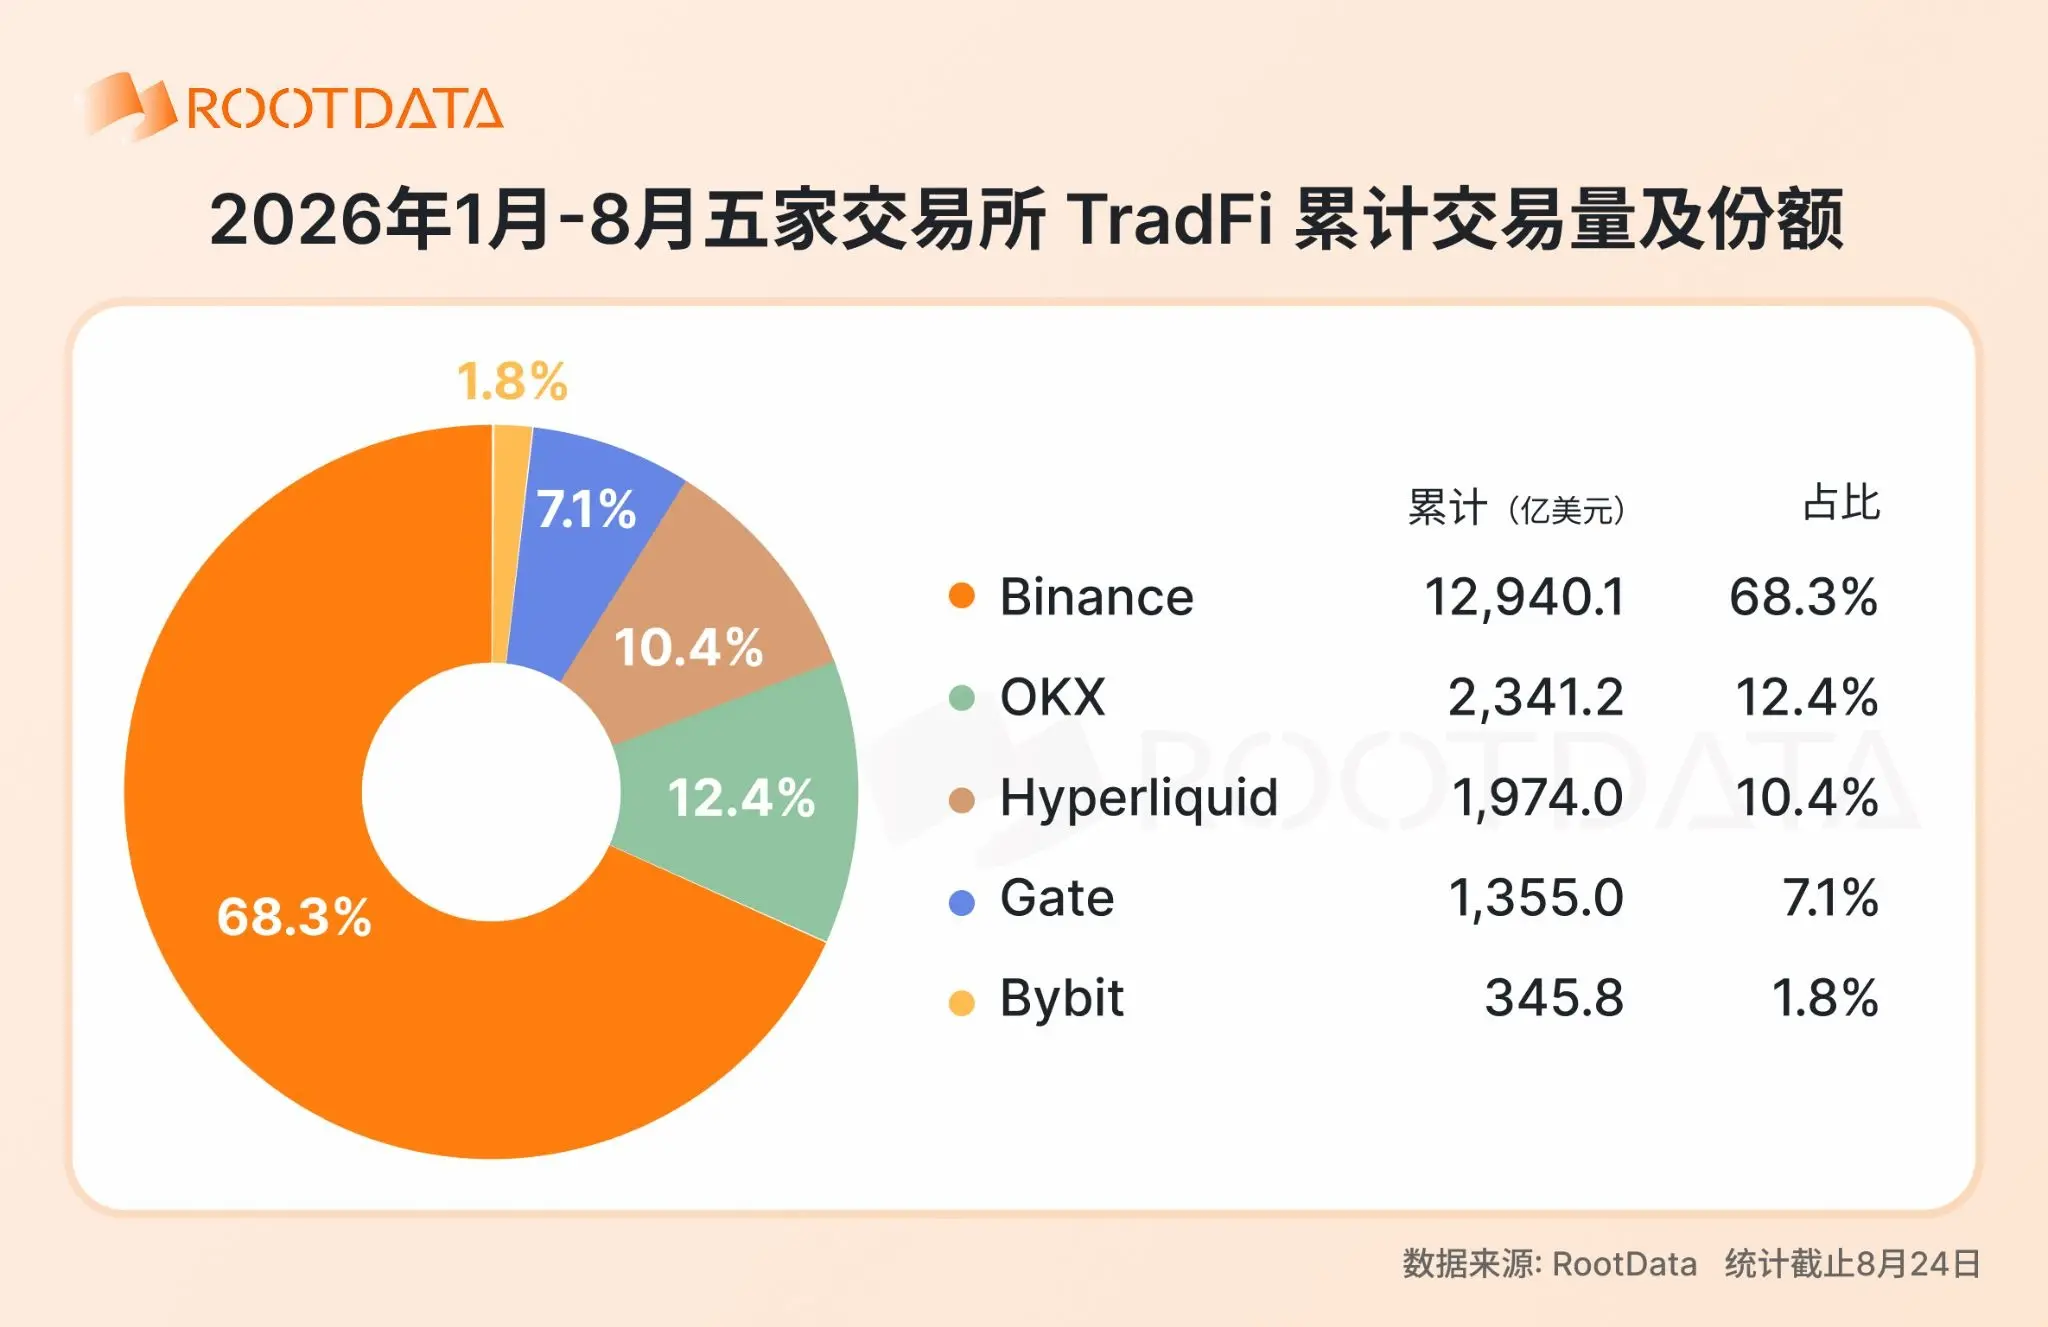
Meanwhile, the second tier is rapidly expanding. OKX has gone from nearly zero TradFi trading at the beginning of the year to 18.2% in August, climbing to second place; Hyperliquid maintained above 10% after rising to 10.7% in May, peaking at 13.3% in July; Gate's share fluctuates between 3.7% and 13.5%, rebounding to 10.7% in August; Bybit has also climbed from 0.3% to 3.0%. This indicates that funds in the TradFi track are no longer unidirectionally concentrated on a single platform but are exhibiting a clear trend toward multipolar diffusion.
2. Position accumulation: User trading behavior preferences differentiate by platform
Entering August (as of the 24th), the five exchanges' TradFi contracts averaged a total OI of approximately $7.304 billion. Binance ranked first with $3.455 billion, accounting for 47.3%; Hyperliquid followed with $1.956 billion and a 26.8% share, ranking second; Gate's average OI is about $903 million, ranking third with 12.4%; OKX and Bybit are 8.0% and 5.6%, respectively.
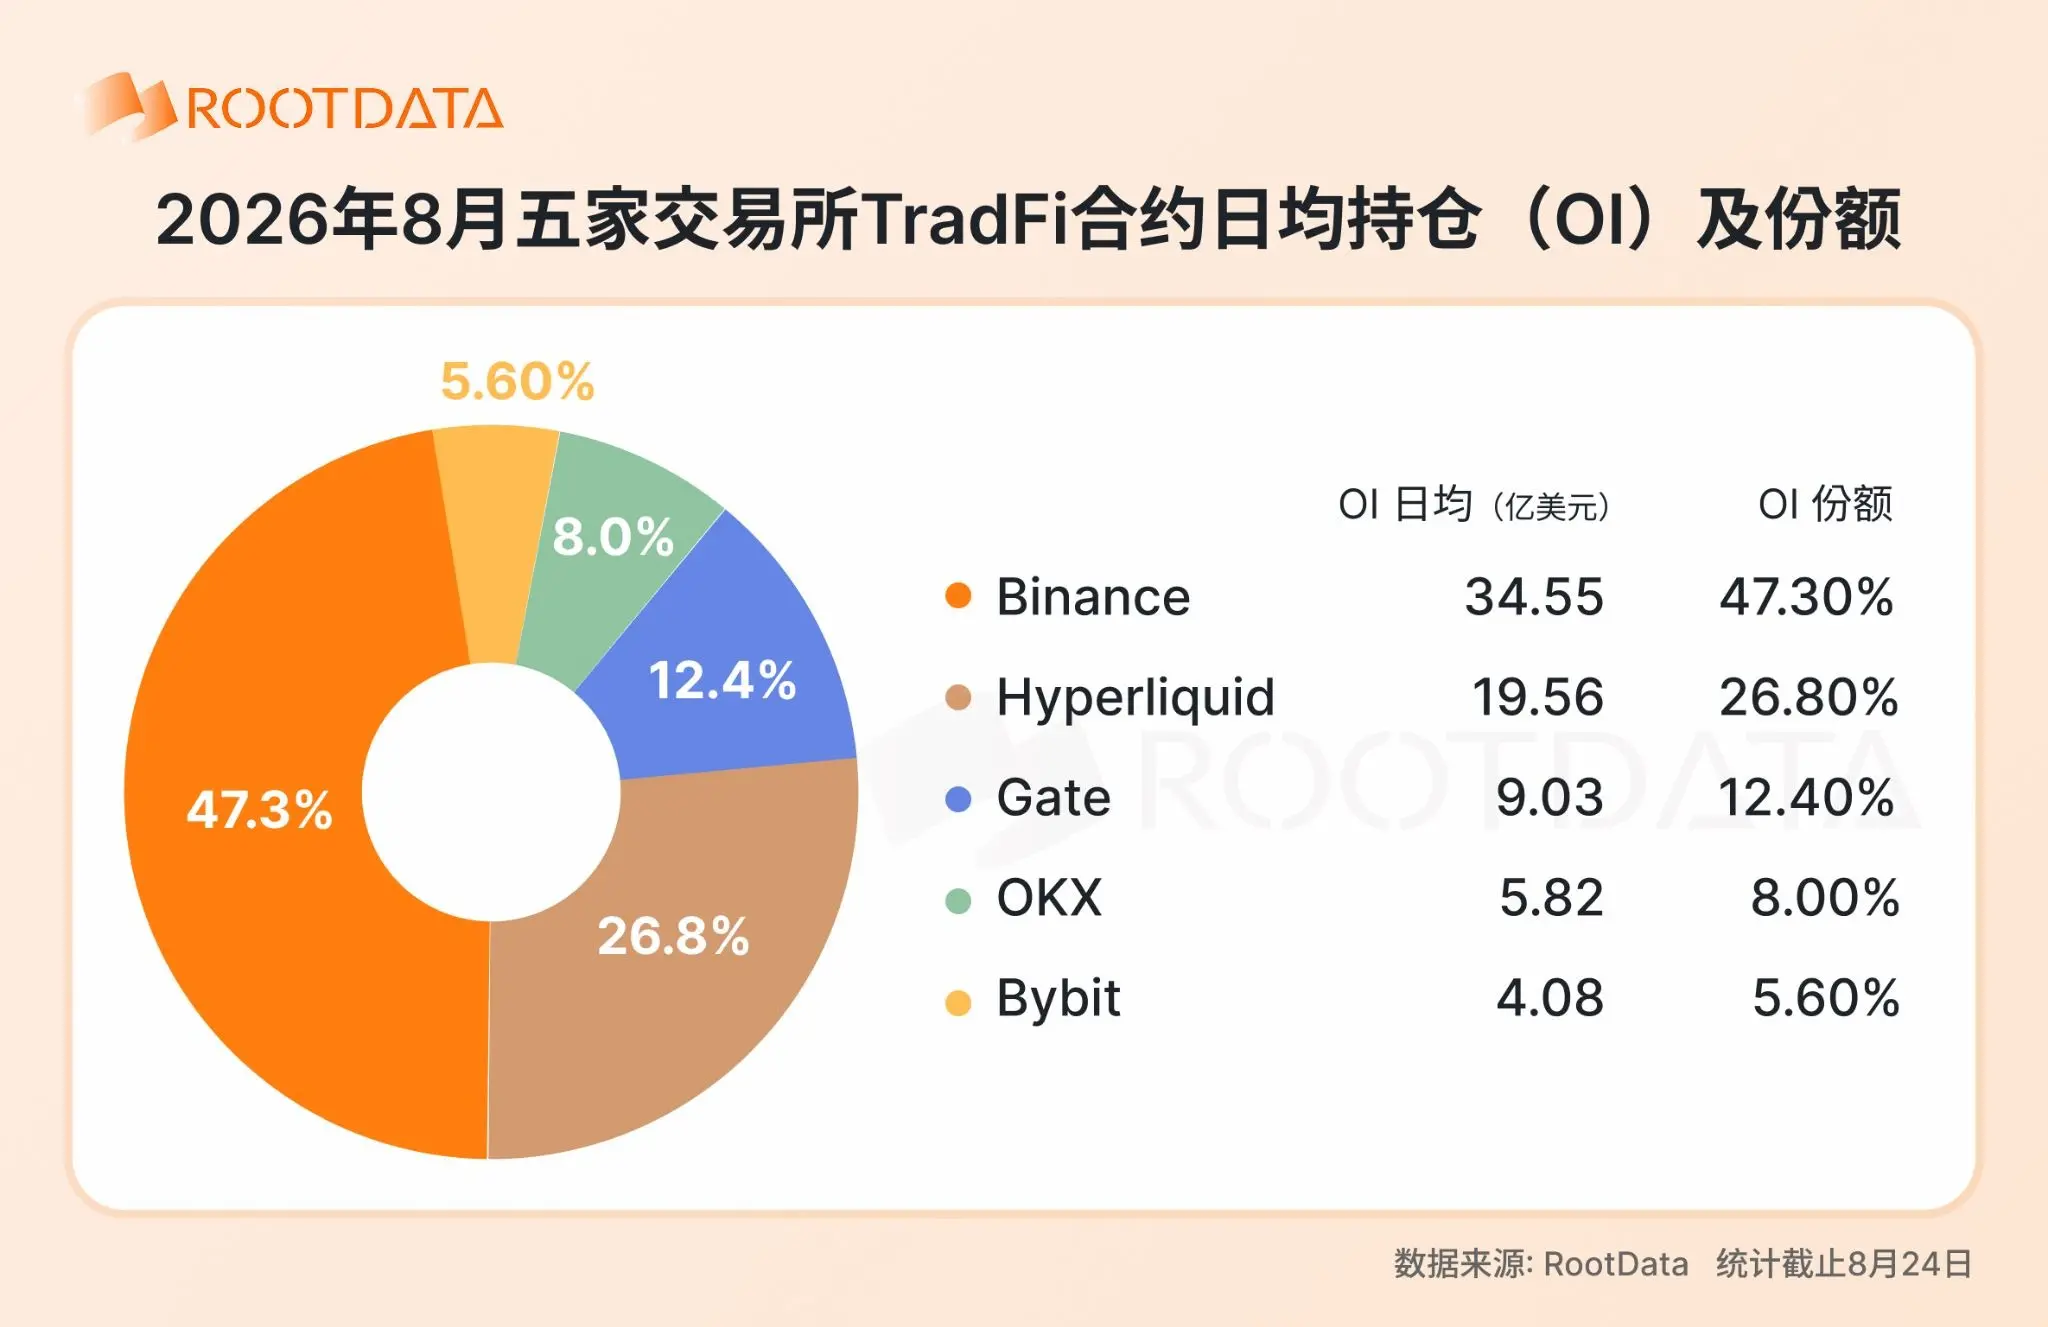
Hyperliquid's OI share (26.8%) is much higher than its transaction volume share (about 9.9%), indicating that the positions accumulated per unit trade volume are significantly higher than other platforms; Gate's OI share (12.4%) also exceeds its transaction volume share (10.7%). In contrast, OKX's transaction volume share (18.2%) is noticeably higher than its OI share (8.0%). This discrepancy indicates that different platforms have essential differences in the "usage" of TradFi assets; some are inclined toward high-frequency trading, while others focus on position accumulation.
3. Large differences in asset coverage numbers reflect different expansion strategies
As of the latest data on August 24, the number of TradFi assets across the five exchanges shows a polarized distribution. Gate has reached 1,022 assets, while OKX, the second largest, has 242, and Binance, the third, has 229. Gate's coverage number is 4.2 times that of the second place OKX, marking a significant gap.
This volume difference reflects two entirely different platform strategies. Gate adopts a "broad coverage" approach, offering the most comprehensive range of assets, covering multiple major global stock markets such as US, Hong Kong, Korean, and Japanese stocks, and it has a fast launch speed, quickly bringing a large number of targets online to meet cross-market and multi-themed allocation demands; in contrast, Binance, OKX, Hyperliquid, and Bybit take a "curated" strategy, limiting the number of targets to between 100–250, focusing more on concentrated market making and liquidity investment in core assets.
3. In the stock derivatives market, how is the pattern evolving?
Stock derivatives, which occupy a dominant position in trading volume, are currently the most worth observing submarket. RootData's ranking of stock derivatives exchanges discards the single-measure trading volume theory and uses comprehensive scoring based on trading volume, open interest, price spread, depth, trading costs, and data collectability to assess exchanges supporting stock derivative trading.
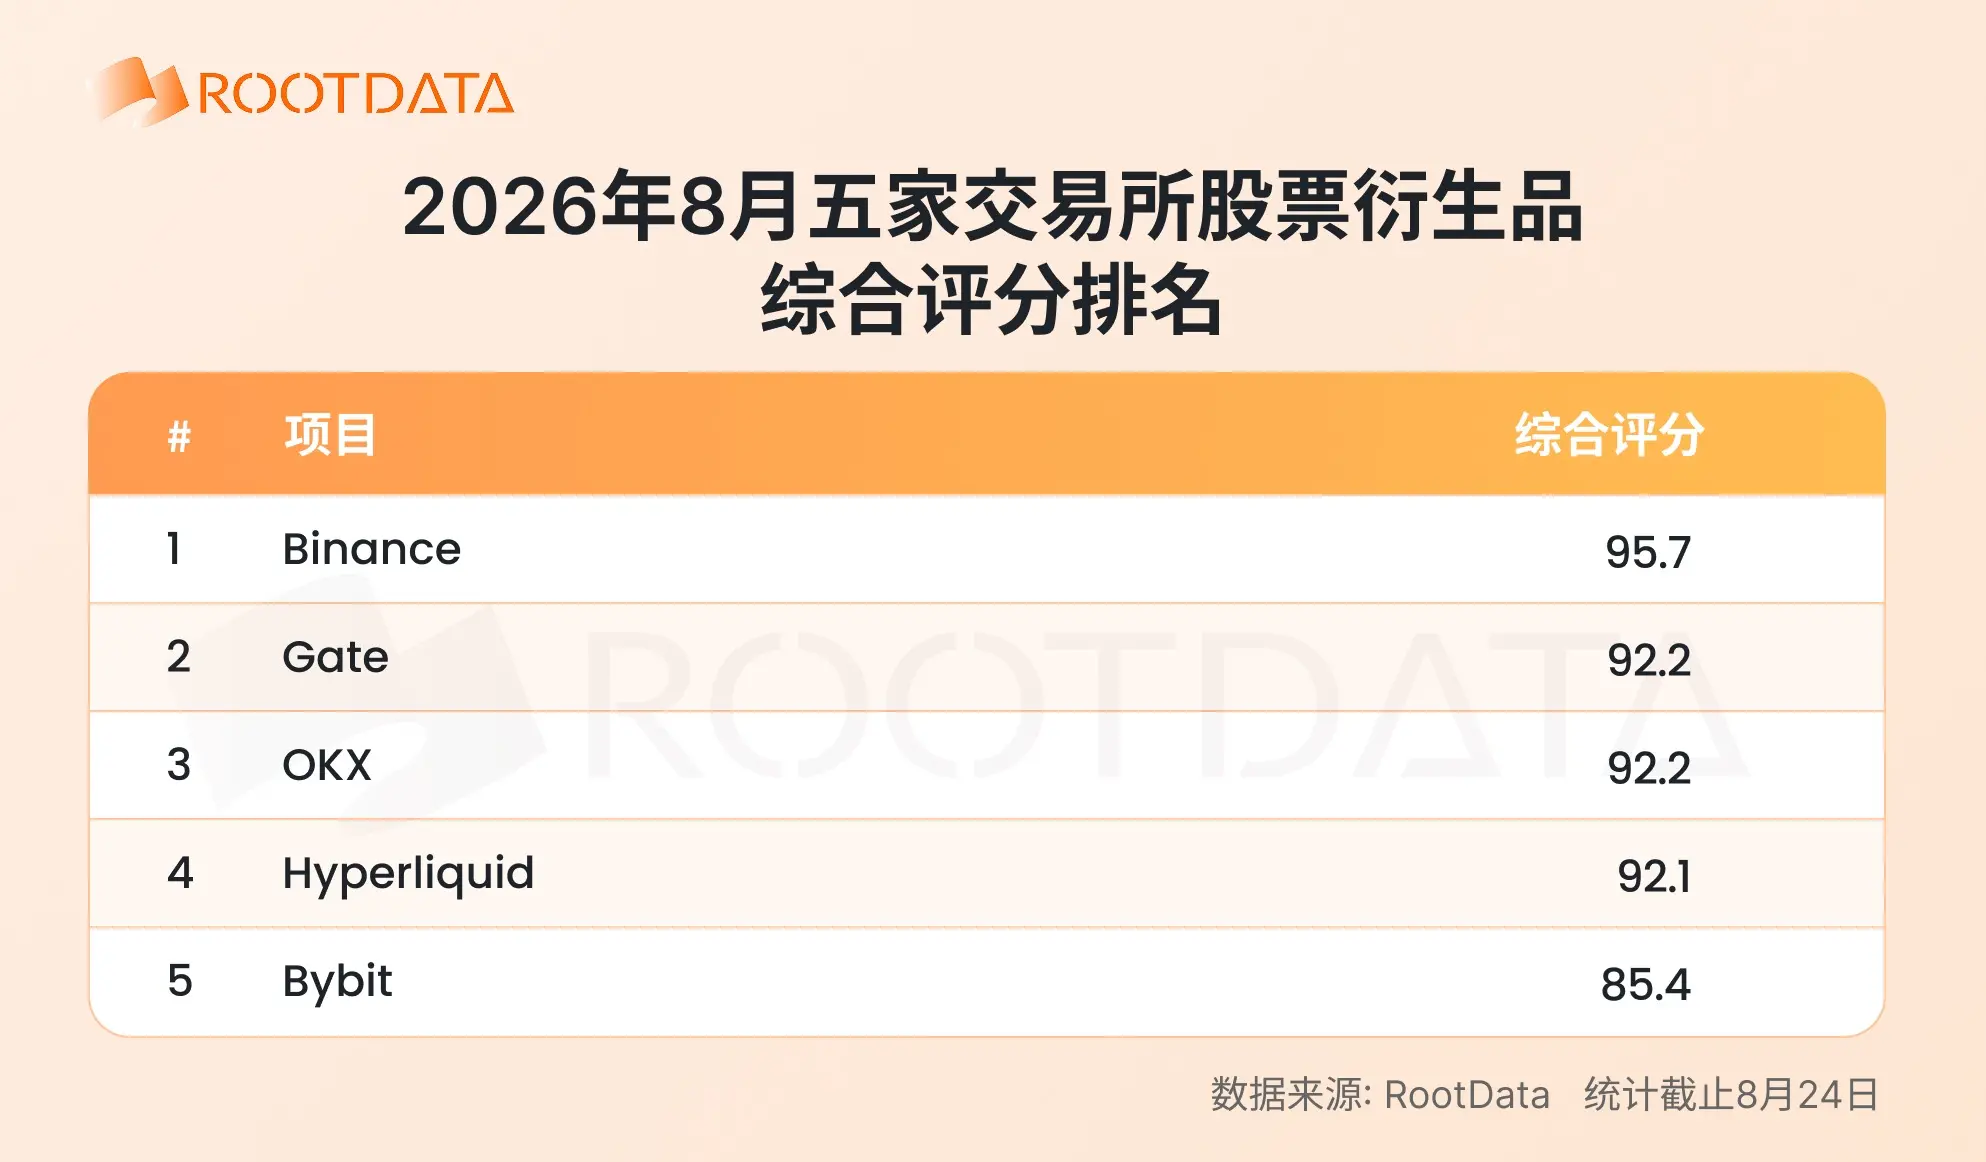
From the data in August (as of the 24th), in terms of comprehensive scoring, Binance ranks first with 95.7 points, Gate and OKX both score 92.2 points, tied for second, Hyperliquid closely follows at 92.1 points, while Bybit stands at 85.4 points. Below is the data situation in each dimension for each exchange.
1. Trading volume pattern: "One strong leader among many strong contenders" and differentiation in growth momentum
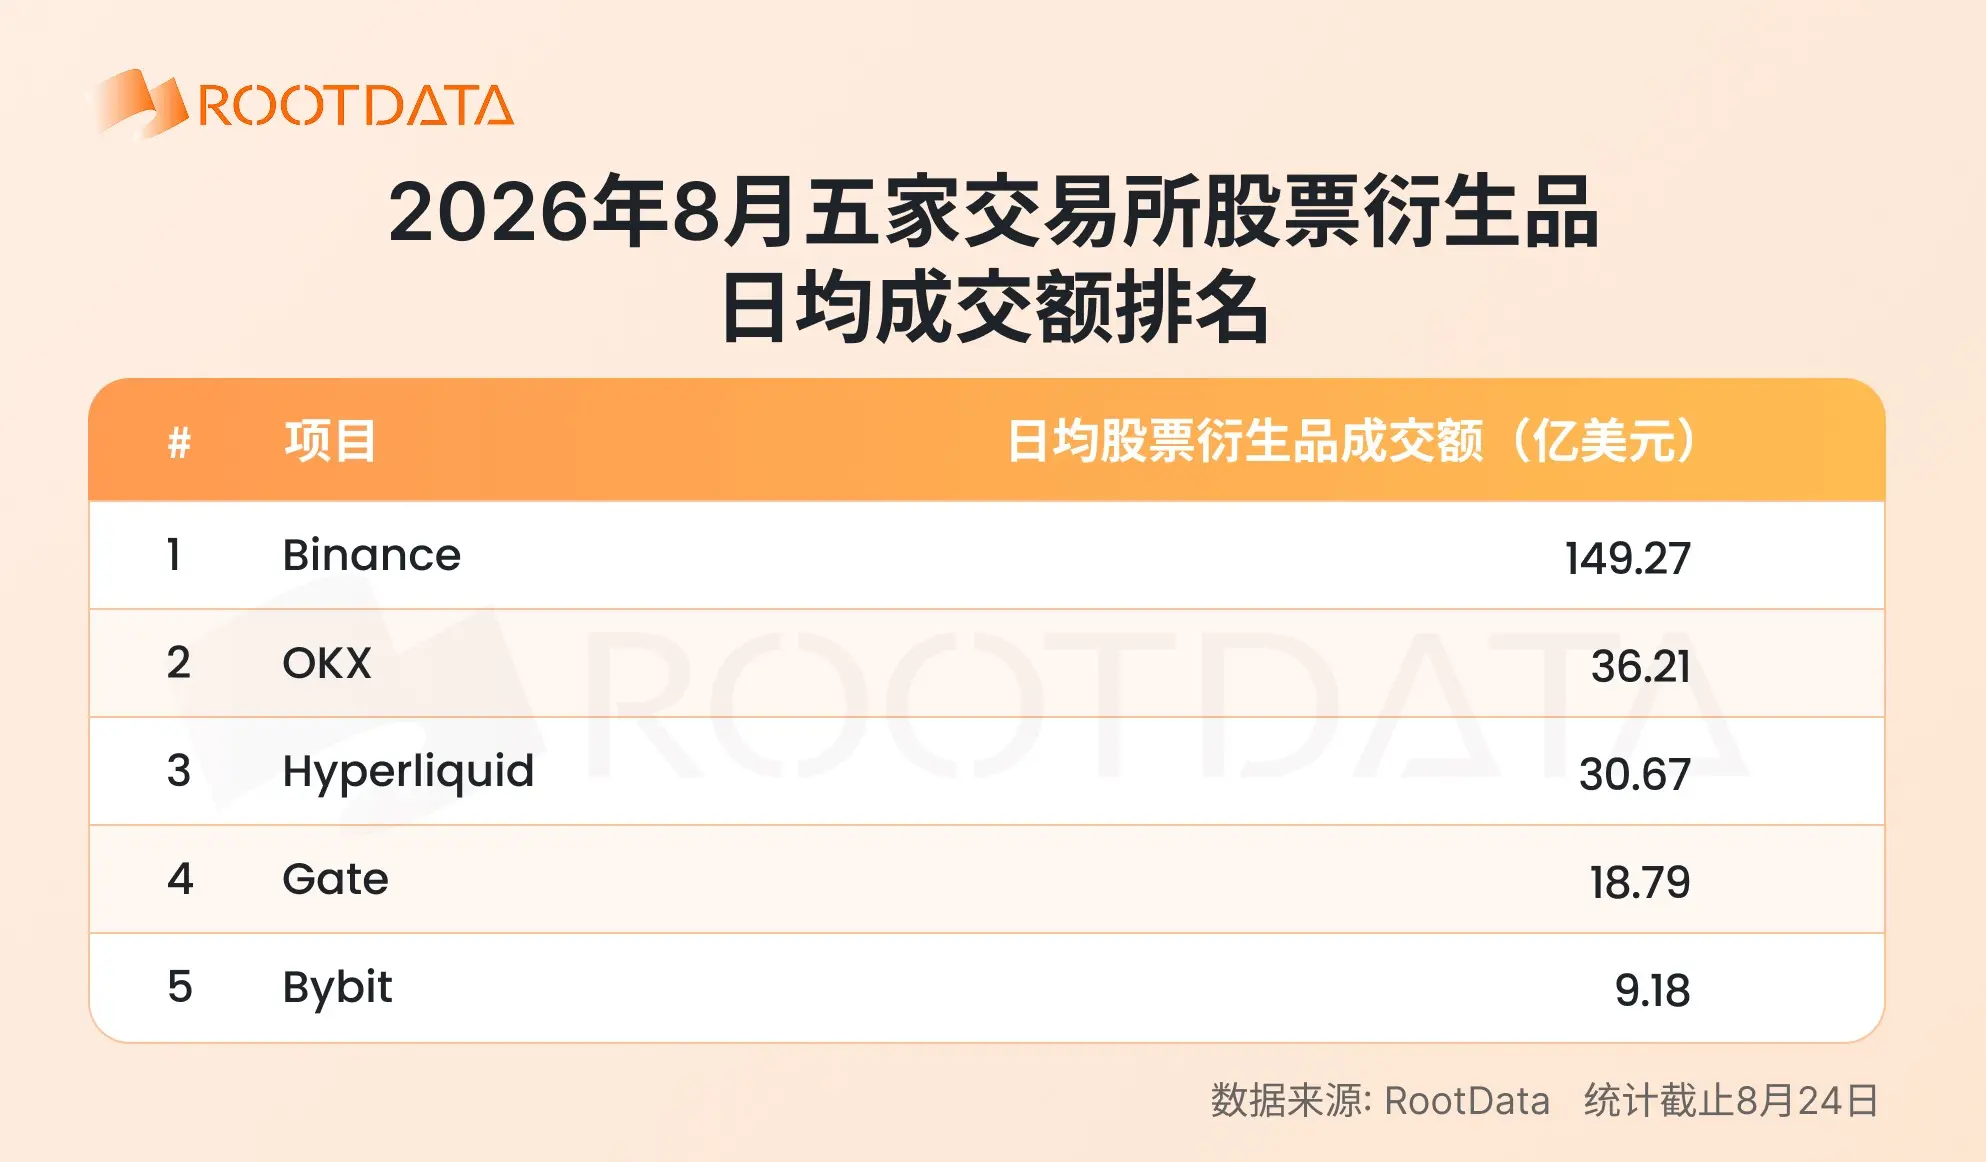
Trading volume remains the most intuitive measure of market position. Binance leads with an average daily trading volume of $14.927 billion, 4.1 times greater than second-place OKX ($3.621 billion), dominating absolutely, leading to a typical "one strong leader among many strong contenders" pattern. OKX and Hyperliquid rank second and third, with daily trading volumes of $3.621 billion and $3.067 billion, respectively, in the same range; Gate shows an average of $1.879 billion, while Bybit reaches $918 million.
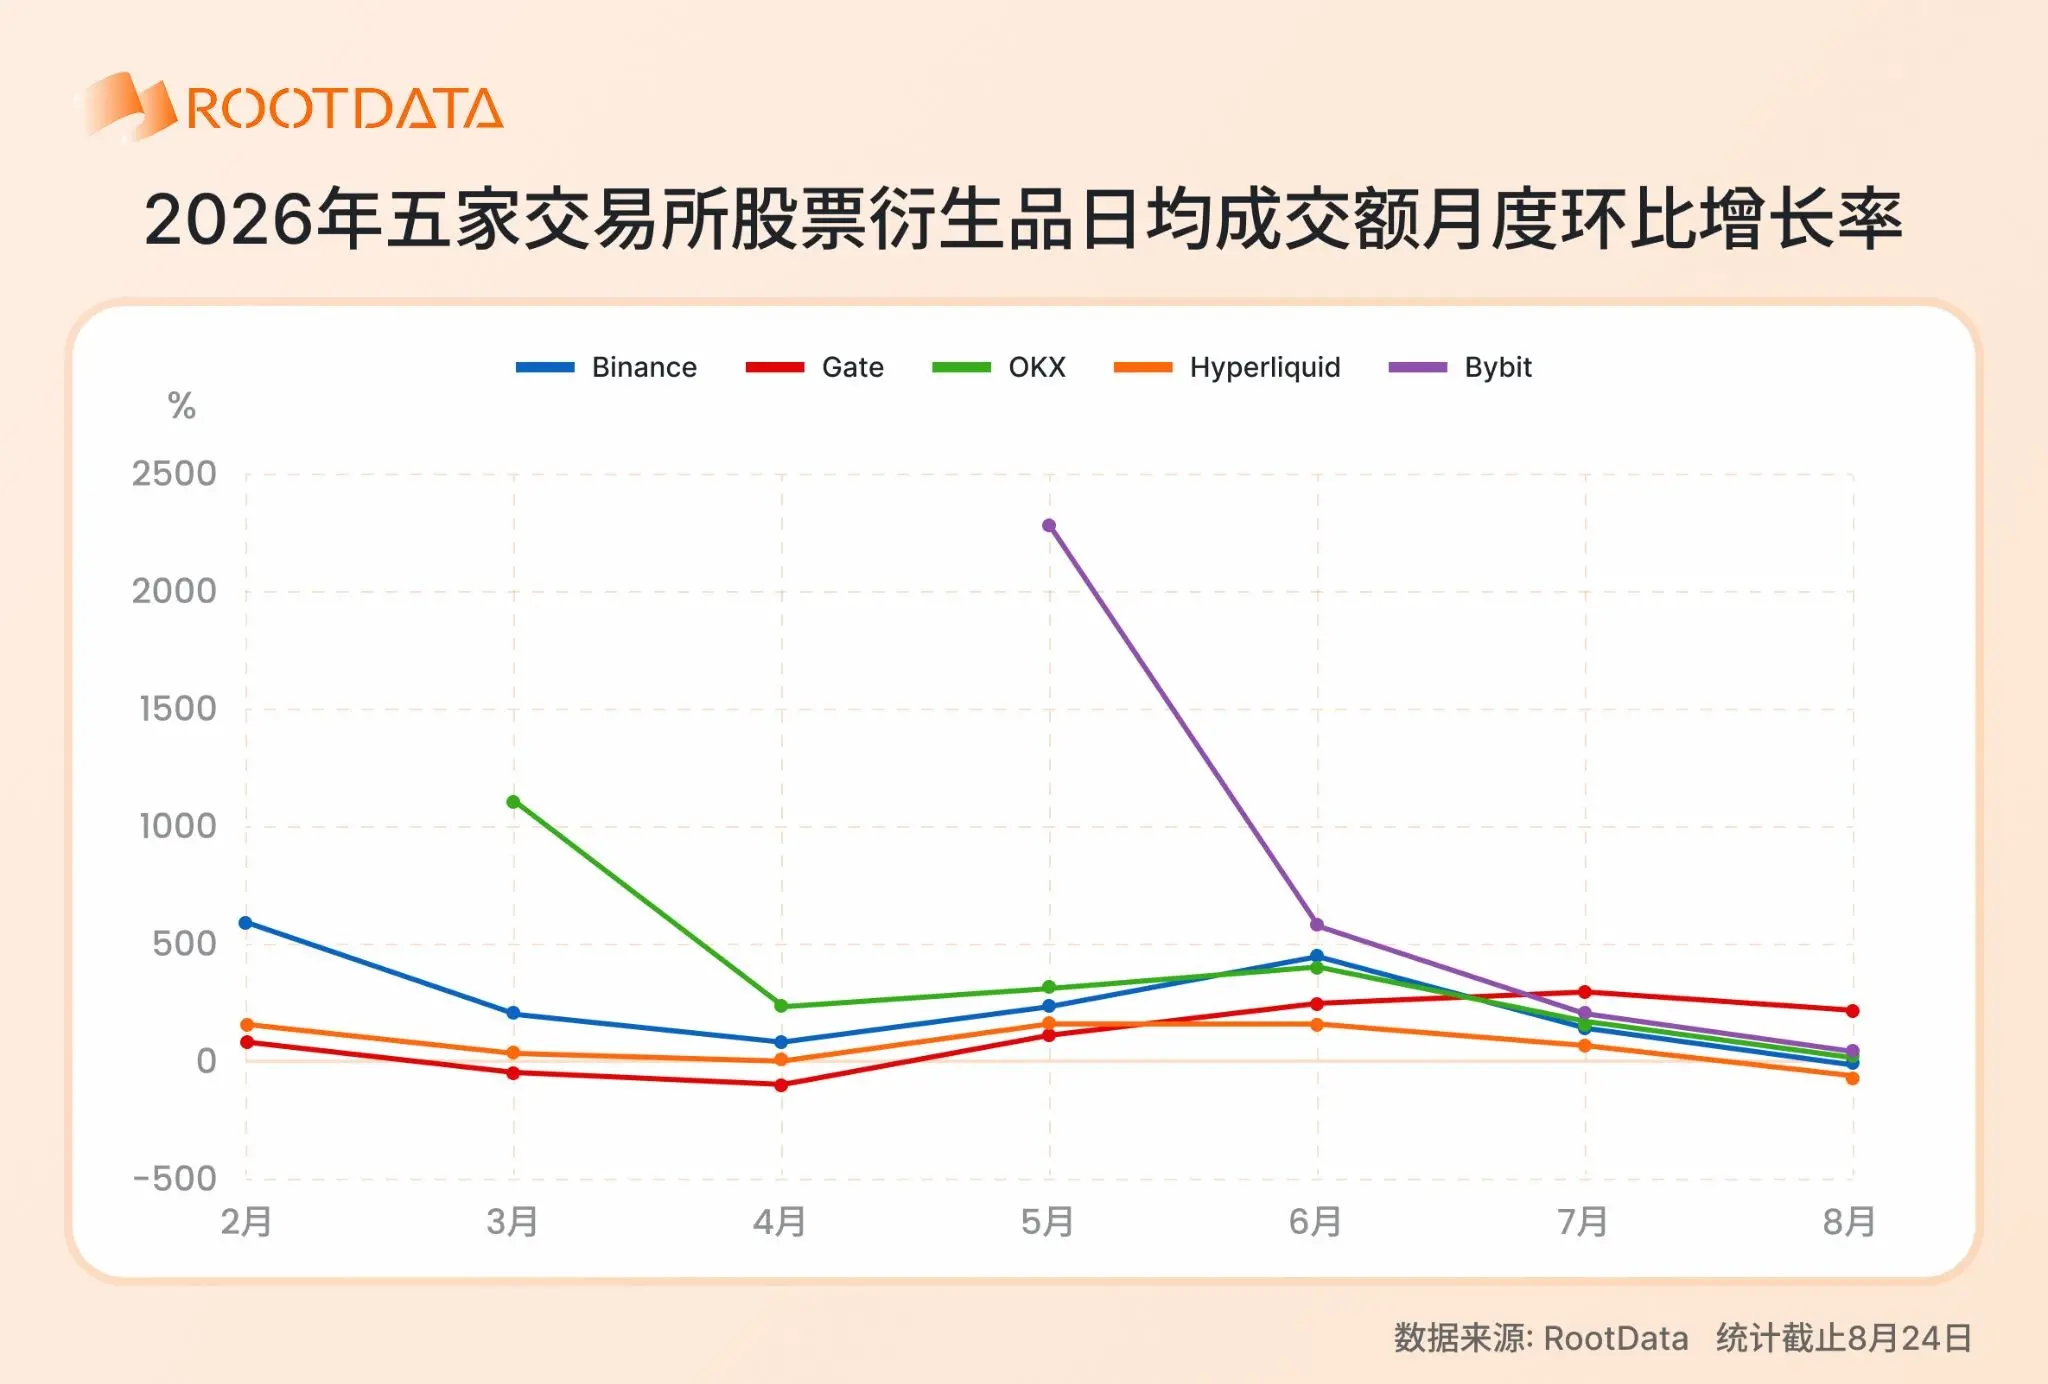
However, the trading volume figure is only one side of the story, while the month-on-month growth rate reveals trends in capital flow. From February to August, the average daily trading scale's month-on-month growth peaked in June, with the overall market entering a "high base" digestion period in July and August. In this context, the growth momentum of each platform shows significant differentiation.
As the absolute leader, Binance's average daily month-on-month growth rate reached 467.9% in June, falling to 116.5% in July, and further declining to 2.1% in August (as of the 24th). The size advantage coexists with growth pressure, but the size advantage remains solid. Hyperliquid similarly showed an initial peak followed by a decline. OKX and Bybit maintained positive growth, but their growth rates have significantly slowed from the peaks of May and June. Meanwhile, Gate's growth rate curve demonstrated an independent rhythm, showing consistent strength since May, with month-on-month daily growth rates of 124.1%, 187.3%, 323.7%, and 261.1% from May to August, maintaining triple-digit high growth for four consecutive months. Whether this sustained high growth can translate into a further leap in rankings will still need to be observed in the subsequent months concerning the base effect and capital retention status.
2. Position structure: Differentiation of long and short strategies
From the position perspective, Binance maintains the lead with an average daily open interest of $3.472 billion, followed closely by Hyperliquid at $1.986 billion, achieving 57% of Binance's total. Gate ranks third with an average position of $772 million, while OKX and Bybit reach $532 million and $194 million, respectively.
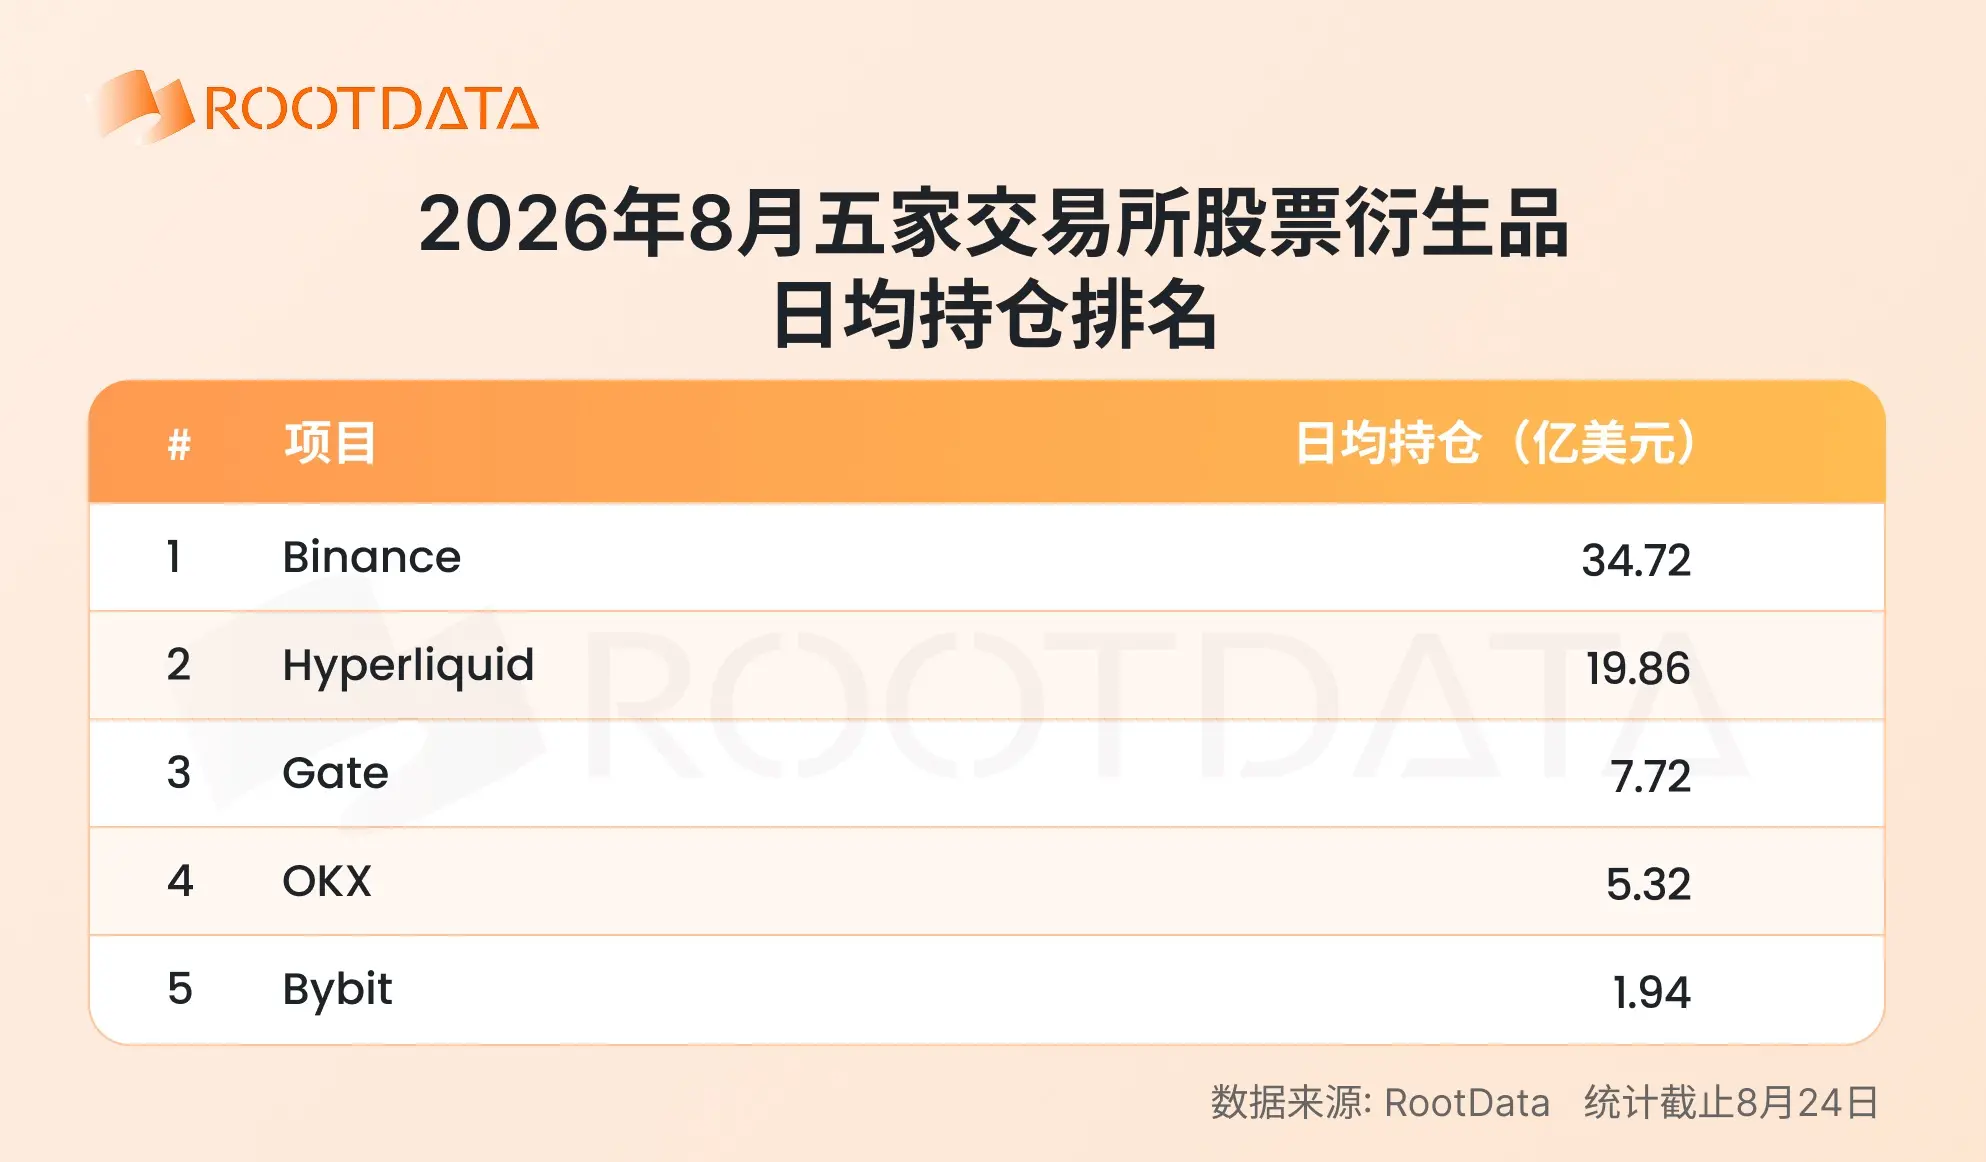
The OI/trading volume ratio across different platforms shows a clear divergence in user behavior. Hyperliquid's ratio reaches about 0.65, indicating that users tend to hold positions long term after opening, reflecting typical allocation characteristics; Gate's ratio is about 0.41, showing a relatively balanced long-short strategy; while OKX is only around 0.15, and Binance's is about 0.23, indicating that the latter two platforms are more inclined toward high-frequency short-term trading. For stock derivatives as a type of TradFi asset, the thickness of position accumulation often better reflects user stickiness to the platform than trade pulses, as platforms that usually have longer-held positions tend to have lower churn rates and higher capital retention efficiency.
3. Market depth: Gate ranks first in liquidity in mid-August, surpassing Binance for 11 consecutive trading days
According to liquidity monitoring data, since August 14, Gate's ±2% weighted depth has consecutively surpassed Binance for 11 trading days, ranking first in the industry. During this period, Gate's average weighted depth reached $14.678 million, while Binance's was $10.721 million.
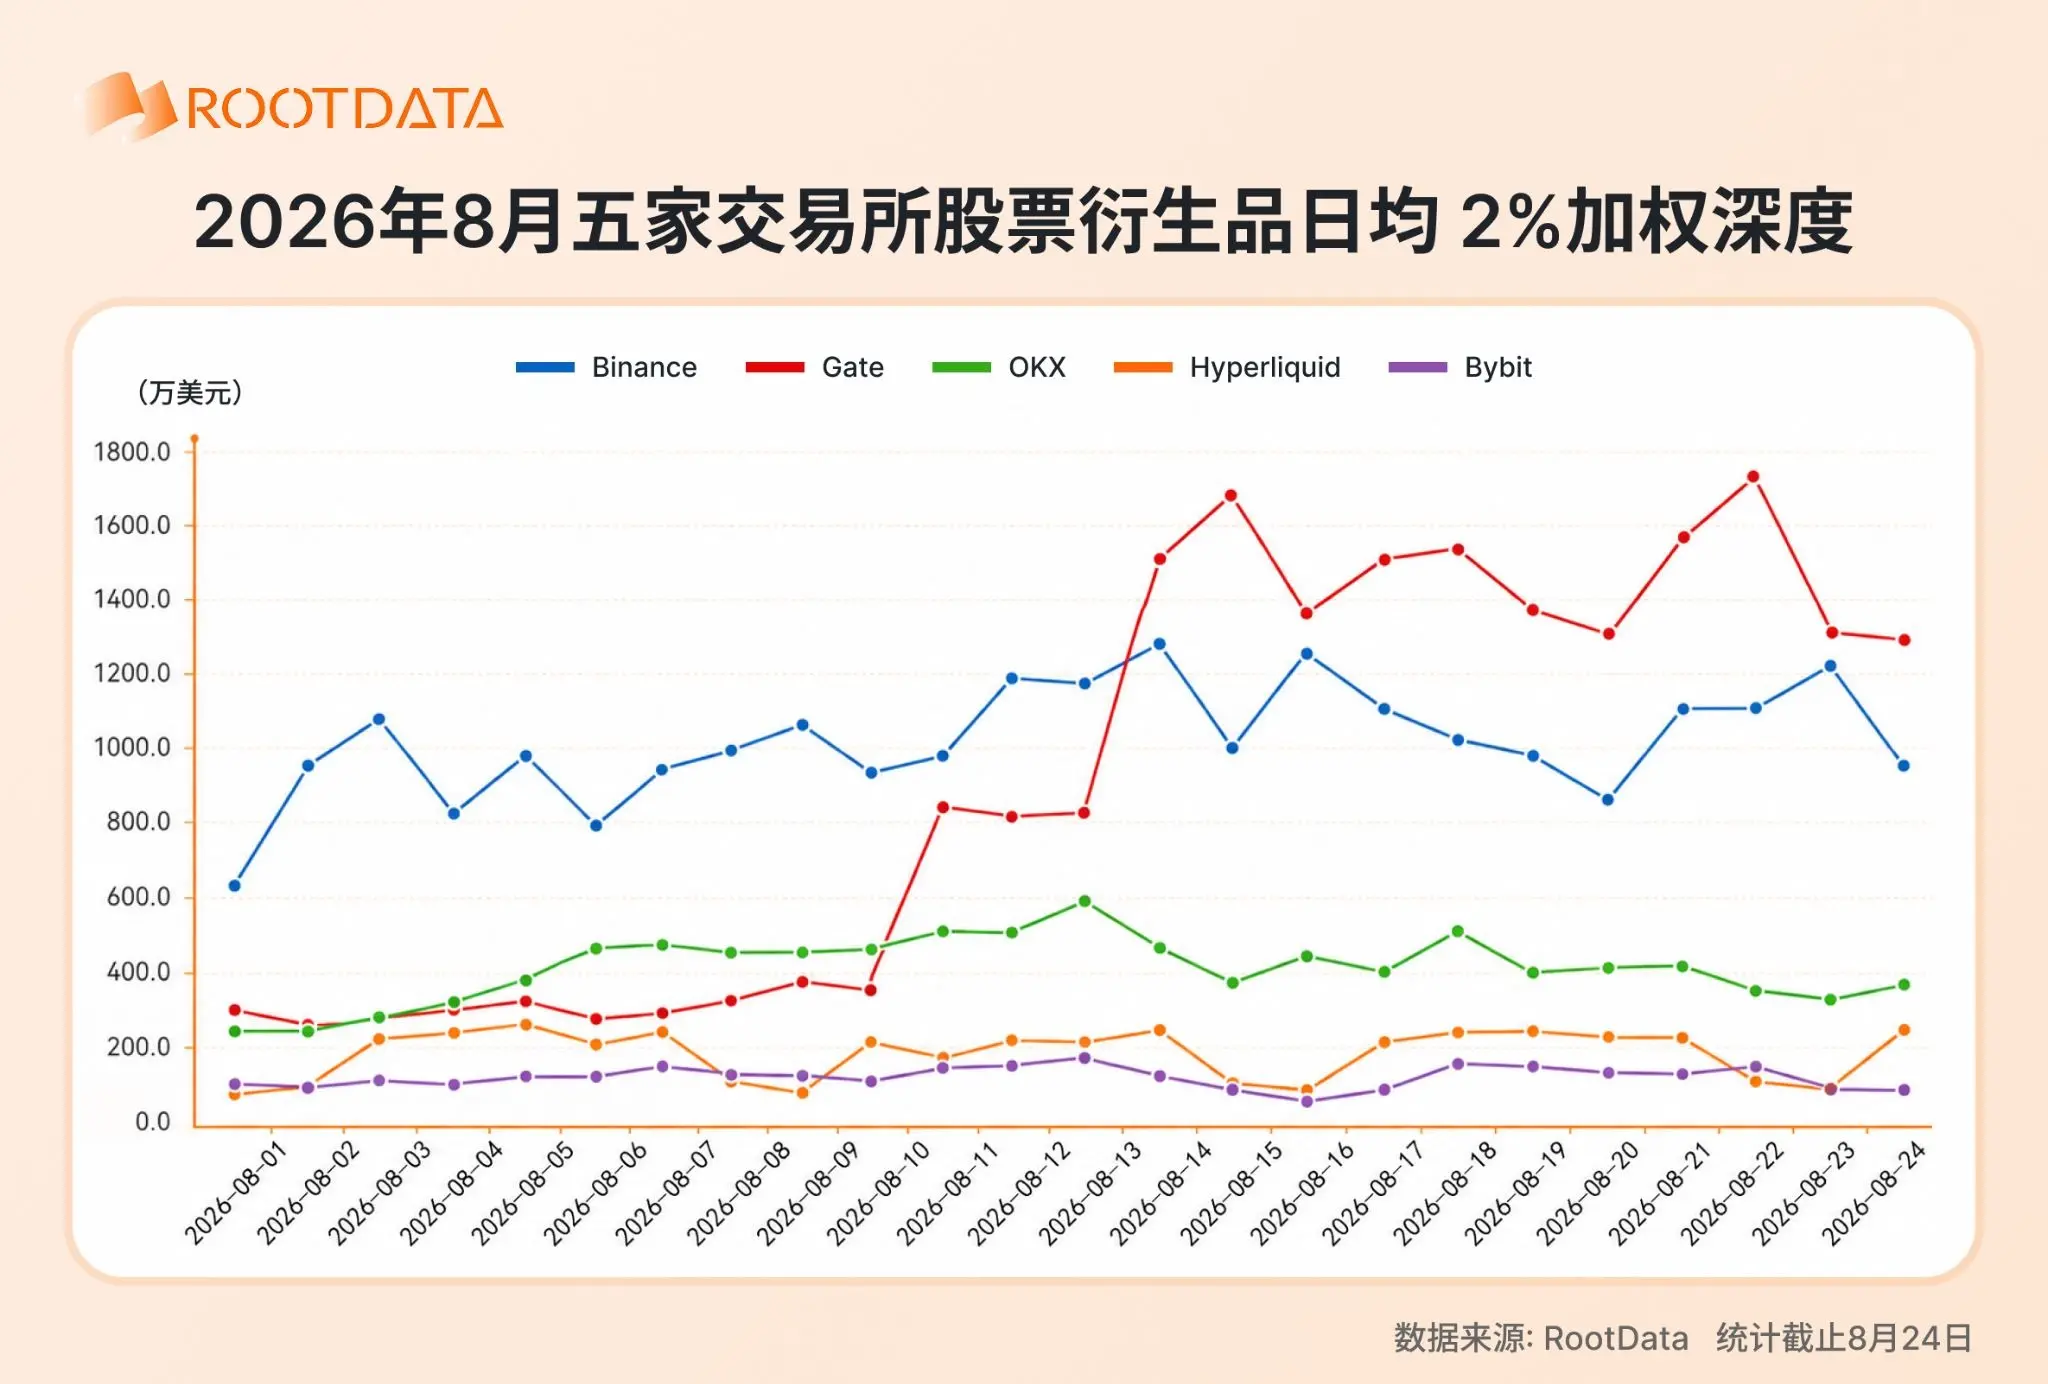
If we use the ±1% weighted depth statistic, which is closer to actual trading range, Gate also maintains the top position after August 10, with an average reaching $7.499 million. Gate and Binance together occupy around 71% of the liquidity share of comparable exchanges, further highlighting the industry's head concentration effects.
Before this, the industry overall showed a "dual-headed concentration" pattern, with Binance long holding an average daily weighted depth of $10.069 million at ±2%, followed closely by Gate at $9.012 million, together accounting for over 70% of the industry depth; OKX, Bybit, and Hyperliquid had depths of $4.445 million, $1.788 million, and $1.171 million, respectively, showing a significant gap compared to the leading platforms.
4. Price spread levels among leading exchanges are relatively stable
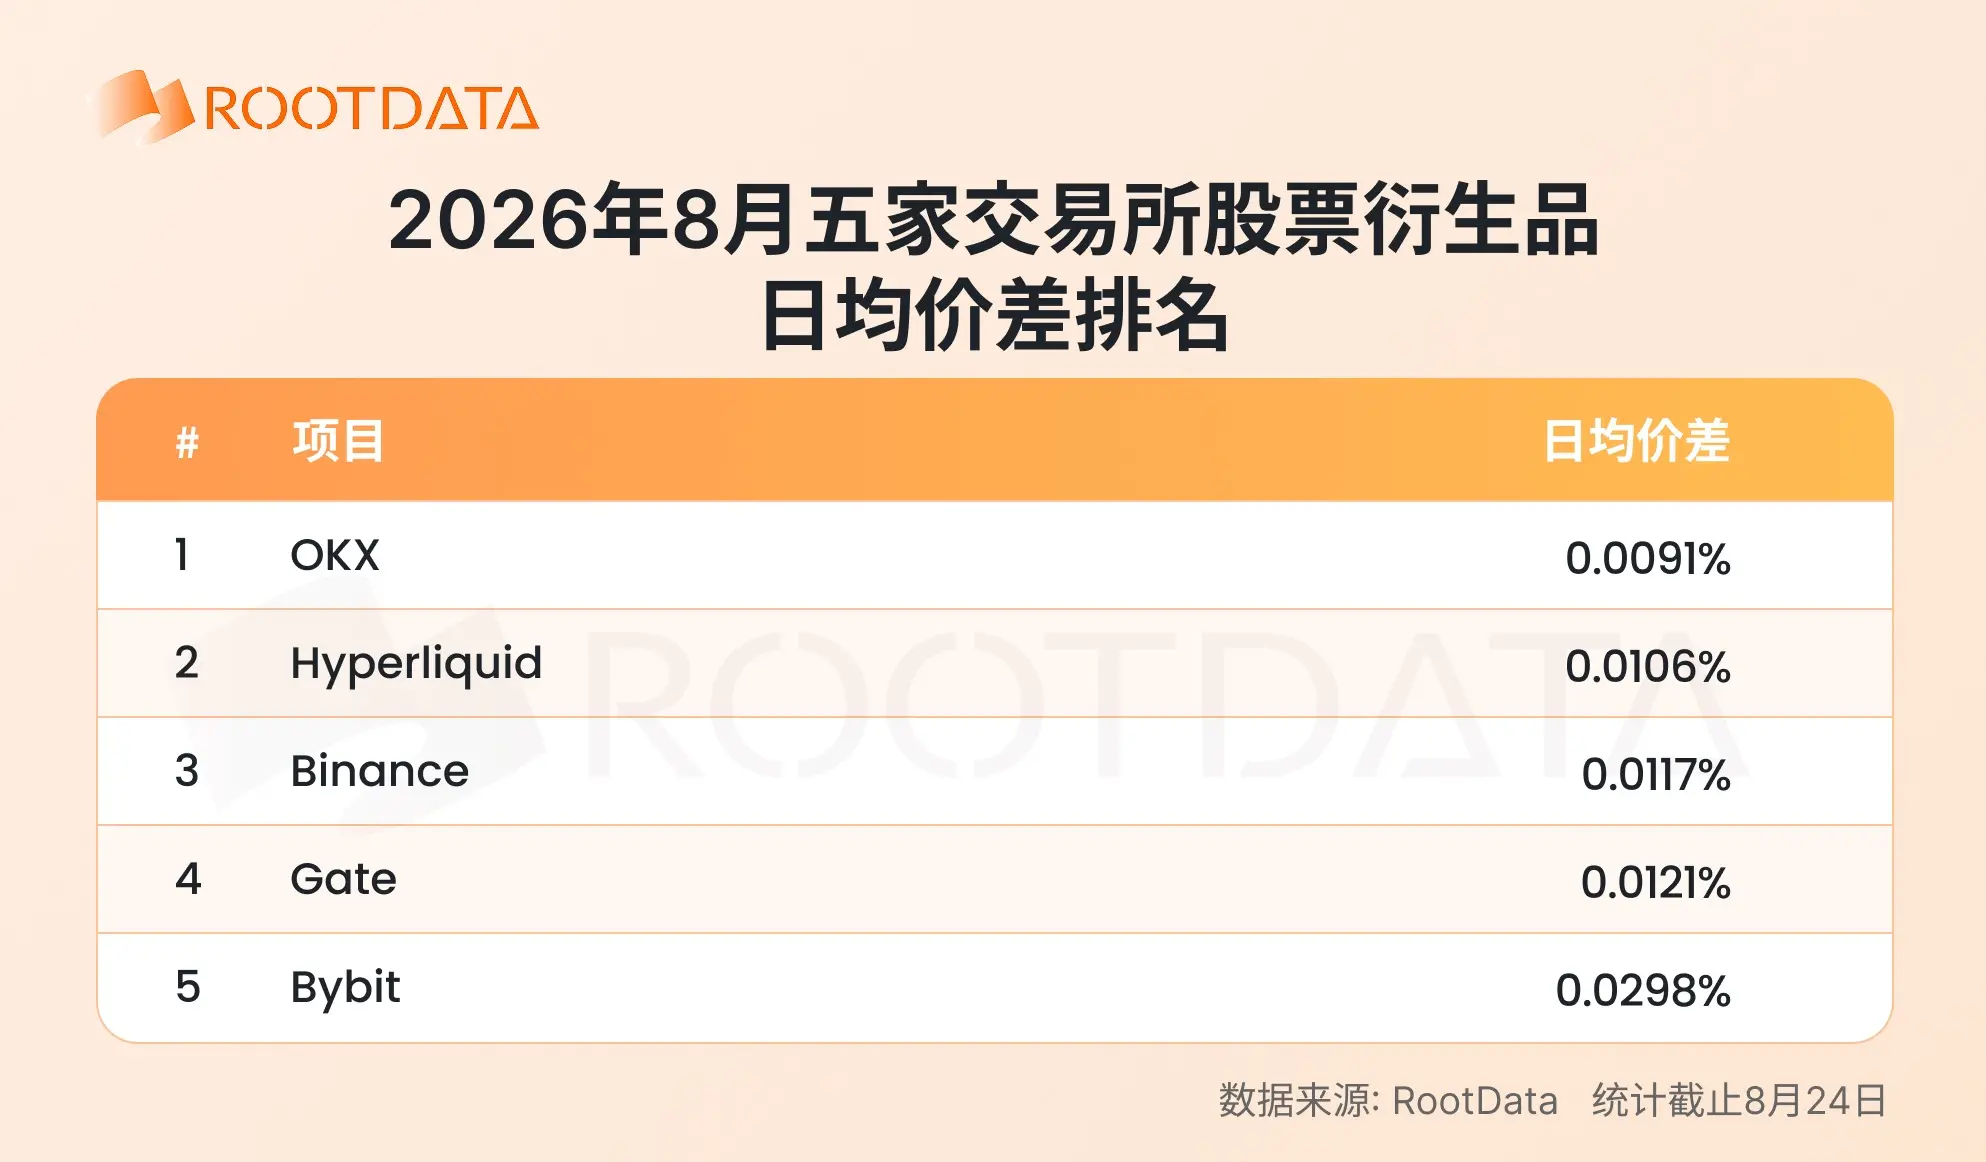
Transaction costs are also an important factor affecting the trading experience. OKX has the lowest weighted spread at 0.0091%, Hyperliquid at 0.0106% ranks second, while Binance (0.0117%) and Gate (0.0121%) are almost at the same level, ranking third and fourth, and Bybit trails with 0.0298%. Overall, the spreads among leading exchanges are relatively stable. Notably, Gate's spread has sharply decreased since August 18, maintaining a spread range of 0.0043% - 0.0086% for five consecutive days, being the best in the market.
5. Variety matrix: Who is "delivering" and who is "penetrating"?
When trading costs are compressed to the extreme, the number of targets provided by platforms becomes the next dimension of competition. As of the snapshot data on August 24, Gate ranks first with 366 stock derivative targets, followed by Bybit (206), Binance (170), OKX (156), and Hyperliquid (116). If we expand the view to CFDs, Gate has launched 663 trading assets in Q2 2026, with a peak weekly trading volume exceeding $150 billion, also ranking high among global cryptocurrency platforms.
However, the number of varieties is only one side of the coverage capability; the other side is the actual share on popular assets. Taking four leading targets, SNDK, SK Hynix, MU, SPCX, as examples, based on the August 24 RootData tokenized asset data, the competition positions across platforms show sharp differences.
Binance holds an absolute center of flow and stock. It ranks first for 24-hour trading volume for all four targets, claiming three firsts for OI positions. However, its lead is concentrated on "volume," with price spread and leverage advantages not being significant, as most target spreads only rank in the second tier, and depth advantages on individual stocks have even been surpassed.
Among the four targets, Gate's spreads are all tied for the lowest in the market, with SNDK at 0.0007%, SK Hynix at 0.0009%, and the maximum leverage provides the highest 75 times among three targets. More importantly, the main support depth shows that SK Hynix's ±2% liquidity depth is $2.45 million, which is 5.9 times that of Binance and 4 times that of Bybit; MU's depth is $6.5 million, ranking first among the five, leading Hyperliquid by 19% and Binance by 51%.
Hyperliquid has abundant depth but lacks obvious advantages in price spread. It has the highest depth of $7.72 million for SNDK, while MU has the second highest depth, but spreads for SNDK and MU are relatively wide.
6. Multi-dimensional radar: Summary of horizontal comparisons
From the six-dimensional ranking, the current landscape of stock derivatives exchanges shows a clear differentiated distribution.
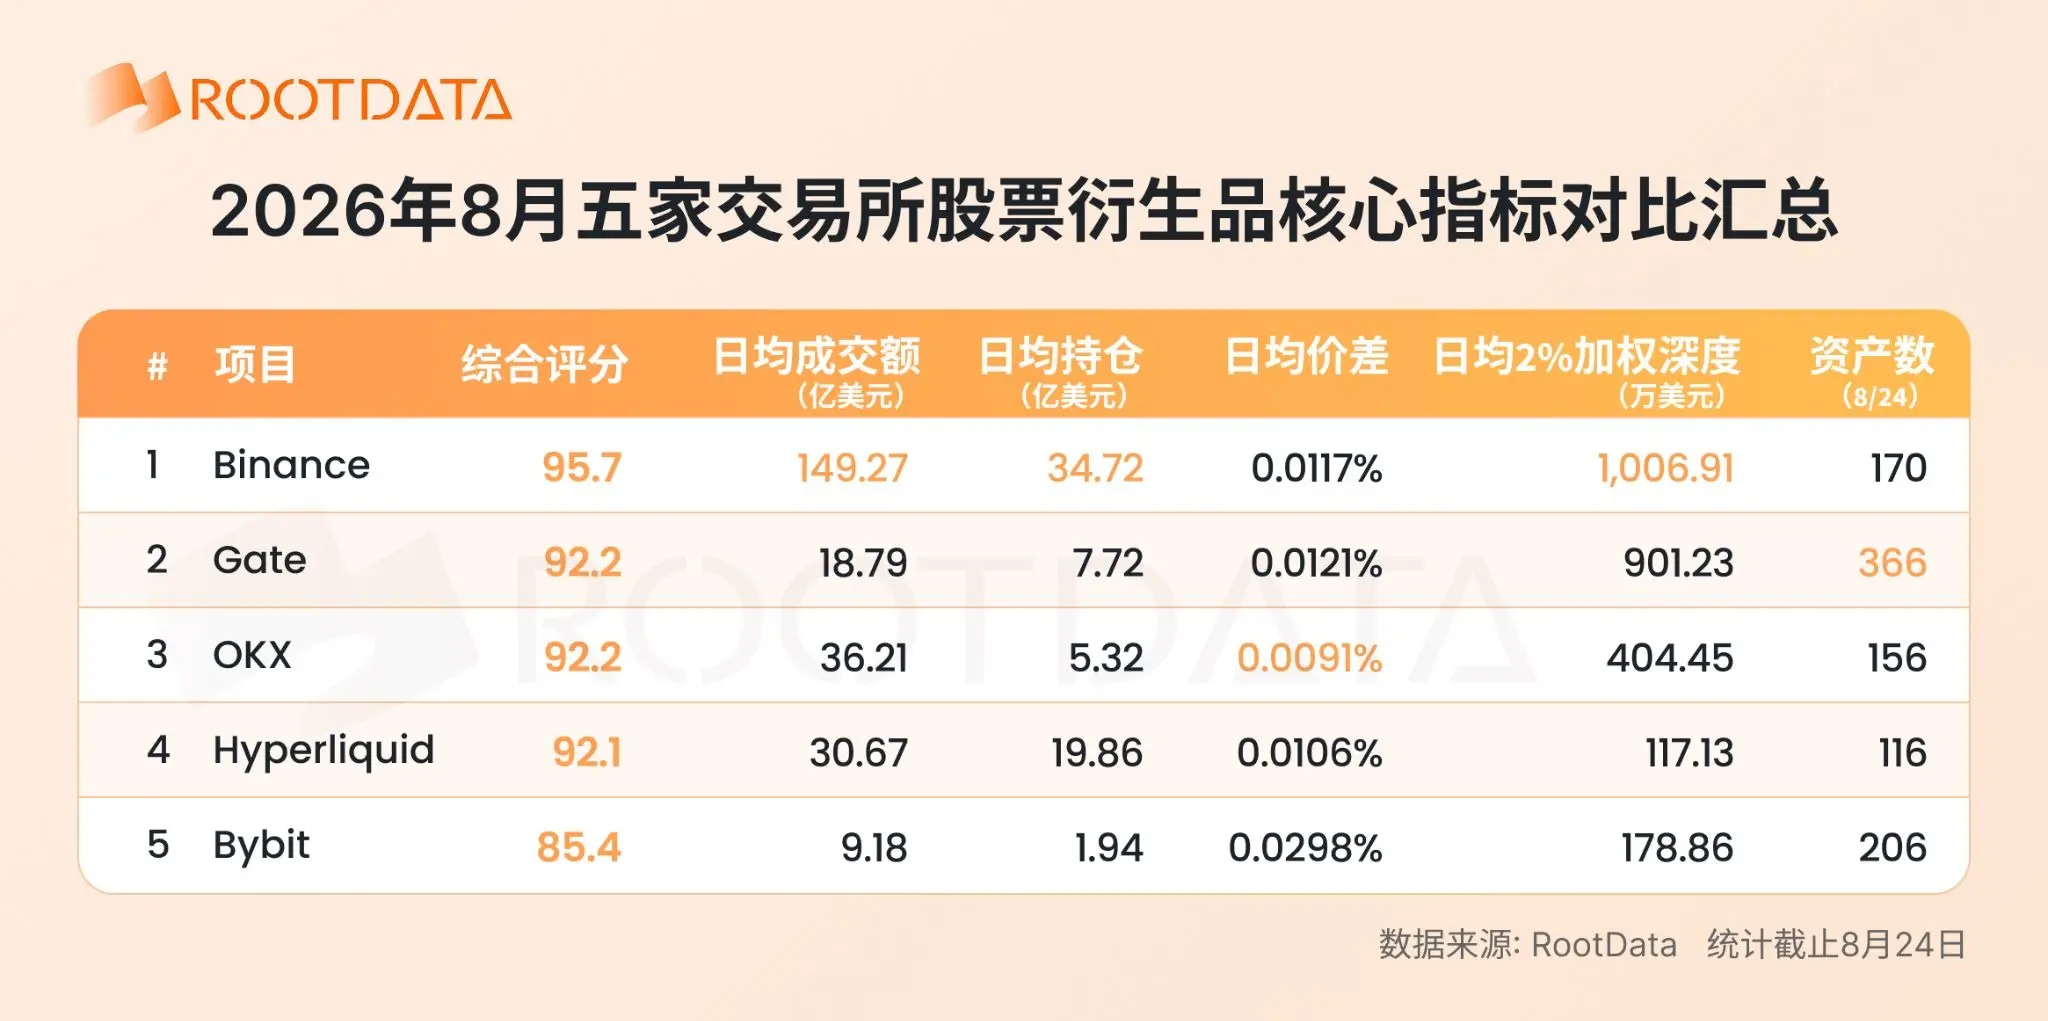
Binance ranks first in comprehensive scoring, average daily trading volume, average daily OI, and average daily 2% weighted depth; it is the main bearer of current stock derivatives liquidity and has an irreplaceable central position in broad-based assets.
Gate has a comprehensive score that ties for second, ranks second in average daily 2% weighted depth, is first in asset number with 366, and has the highest month-on-month growth rates in July and August among the five, demonstrating active performance in variety coverage breadth and growth momentum.
OKX has a comprehensive score that ties for second, with an average daily spread of 0.0091% being the lowest among the five, performing outstandingly in terms of trading costs, attractive to traders who focus on quote quality.
Hyperliquid has the second-highest average OI, also ranked high in spread control, but has relatively lower average depth, reflecting its platform characteristic of users having longer holding periods and lower trading frequencies, overall showing a style of "high accumulation, low turnover."
Bybit ranks second in asset number, while its other dimensions are positioned between fourth and fifth; the overall scale shows a gap with leading platforms, with its layout in the stock derivatives sub-track still in the expansion stage.
4. Conclusion
In 2026, TradFi assets have rapidly grown from a marginal category to a core track with monthly trading volumes reaching hundreds of billions of dollars, with the cumulative trading volume of cryptocurrency exchanges in TradFi assets reaching $1.3 trillion in the first half of the year, marking the accelerating dissolution of borders between cryptocurrency platforms and traditional financial markets.
The exchange landscape is also evolving simultaneously. Binance remains the absolute center of flow and stock, but its trading volume share has fallen from 78% at the beginning of the year to below 60% in August, indicating a shift from "unipolar concentration" to "multipolar dispersion." OKX has quickly increased its volume with low trading costs, and Hyperliquid attracts long-term funds with high accumulation, establishing barriers on both the cost and allocation sides, respectively. Gate is a variable worth continuously observing in this landscape; it has a certain gap in overall scale compared to Binance but demonstrates a relatively balanced overall operational level, with recent growth rates being relatively leading. In certain sub-assets, its liquidity depth and spread have developed certain competitiveness.
Looking forward to the second half of the year, the competitive logic of the TradFi track is shifting from who has larger traffic to who can provide better quotes and deeper market experiences on core assets across multiple dimensions. Platforms that complete their positioning early will be more likely to capture the next round of increments.
免责声明:本文章仅代表作者个人观点,不代表本平台的立场和观点。本文章仅供信息分享,不构成对任何人的任何投资建议。用户与作者之间的任何争议,与本平台无关。如网页中刊载的文章或图片涉及侵权,请提供相关的权利证明和身份证明发送邮件到support@aicoin.com,本平台相关工作人员将会进行核查。


