Written by: Hickerzed, Xunye
2026 Q2 Web3 Talent Market: Contraction and Scarcity Occur Simultaneously
Since 2026, more than 40 companies in the Web3 industry have laid off a total of over 7,000 people, with Coinbase and Kraken both shrinking. On July 23, the well-established exchange BitMEX announced it would completely shut down trading operations in September.
We compared seven external industry reports with Moledao platform's delivery data for Q2 2026. The comparison points to a phenomenon that has been less discussed previously: the most job postings by companies do not align with candidate applications; in areas where candidate competition is most concentrated, job supply is actually limited.
Since 2026, the Web3 industry has laid off more than 7,000 people, according to the CryptoJobsList “Layoffs Report 2026,” with Figure 1 showing the eight companies that have laid off the most.
The proportion of job descriptions requiring AI skills has risen from 23% in early 2025 to 53.1% in March 2026.
Moledao data shows that engineering positions account for 46.0% of recruitment demand, while candidate applications account for 27.1%, with a concentration index of 0.6×, the lowest among all major functions. This is the clearest signal of talent scarcity this quarter.
The Industry is Contracting, with Significant Differences Across Functions
Bitcoin has dropped from a historic high of approximately $126,200 in October 2025 to a range of $60,000 to $64,000 at the end of July 2026, losing nearly half its value. The industry's contraction has occurred almost simultaneously. On May 5, Coinbase announced layoffs of about 700 people, accounting for 14% of its total workforce; CEO Brian Armstrong described this adjustment in an internal letter as a shift to “AI-native.” This was reported by The Block. In the same month, Kraken laid off 150 people. On June 23, the Ethereum Foundation laid off 54 people.
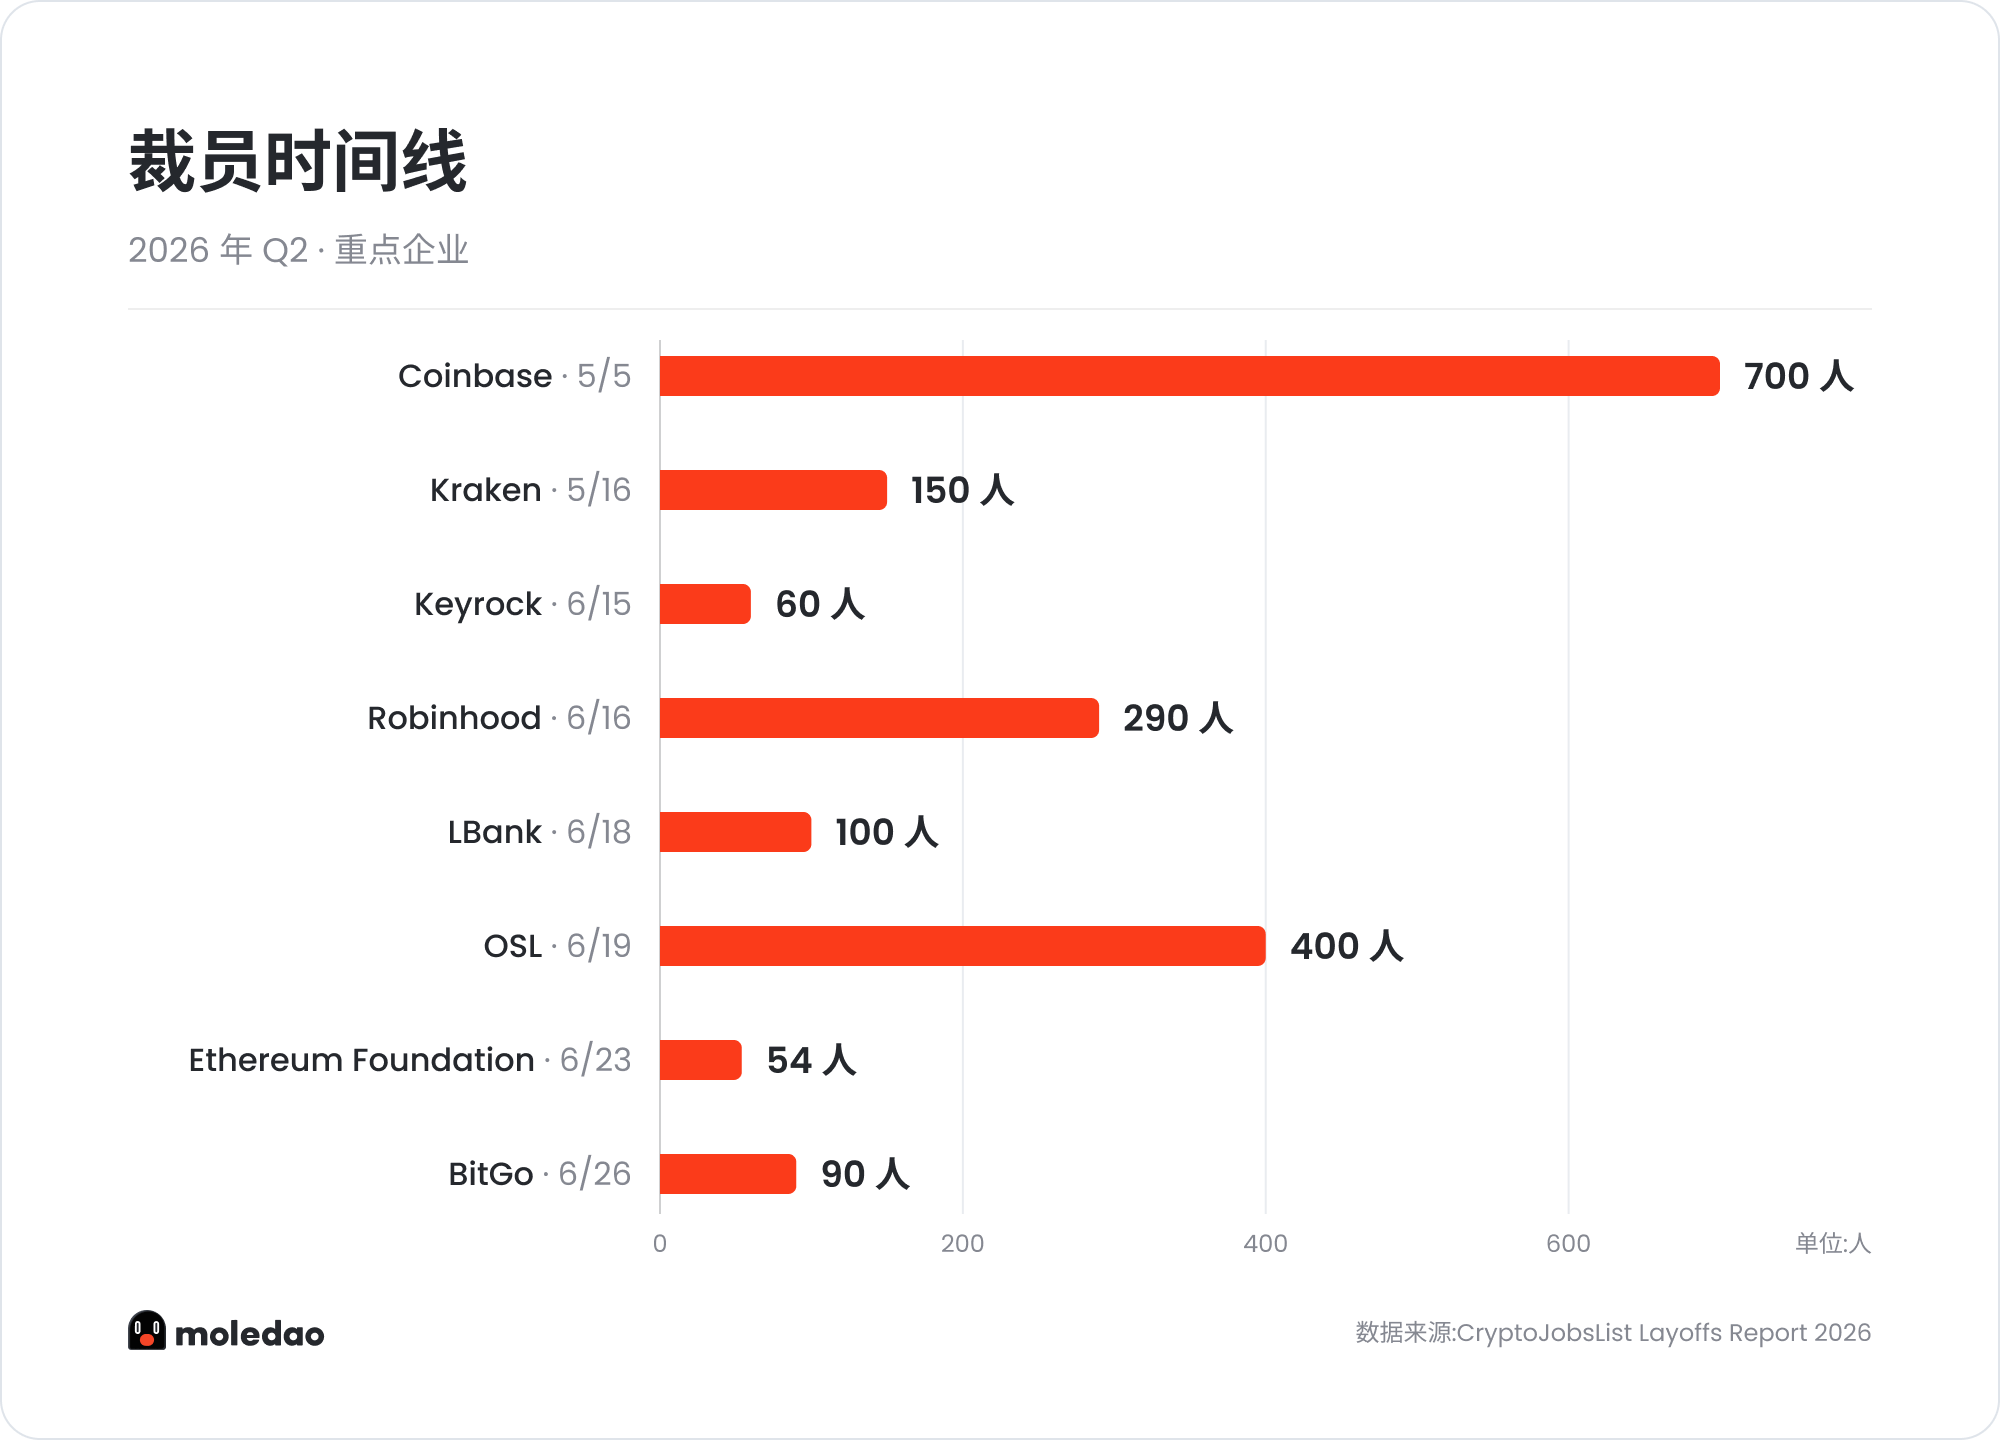
Figure 1 | Timeline of Key Company Layoffs in Q2 2026
Contraction is concentrated in certain functions. Tiger Research's statistics on 2,932 active positions in H1 2026 show that engineering remains the function with the highest recruitment demand, accounting for 34.1%, followed by compliance/legal at 10.4%, with demand in both directions relatively stable. Gaming/NFT roles only account for 2.4%, representing the most obvious area of contraction. The 34.1% figure is the sample size from Tiger Research’s entire network, which is different from the 46.0% job structure metric from the Moledao platform used later.
Many companies have provided similar reasons for layoffs in their announcements, such as streamlining management and cutting redundant positions. Coinbase explicitly stated the elimination of “pure management positions,” shifting to a “player-coach” model. From the announcement's perspective, the adjustments are concentrated at the organizational structure level, with core technical positions being less affected.
During the same period, AI skills are entering job requirements. The proportion of roles requiring AI skills has increased from 23% in early 2025 to 53.1% in March 2026.
Independent reports from CryptoJobsList and Tiger Research corroborate the numbers. In terms of geographical distribution, according to Tiger Research, Singapore is one of the regions where office positions were relatively concentrated in the first half of 2026.
Salaries Continue to Rise, with Clear Hierarchies Between Functions
According to Gate Research data, the global average salary for crypto professionals rose about 18% in 2026. There are significant differences when viewed by function; quantitative development engineers can earn up to $200k, while junior developers earn around $77k, showing a nearly 3-fold discrepancy.
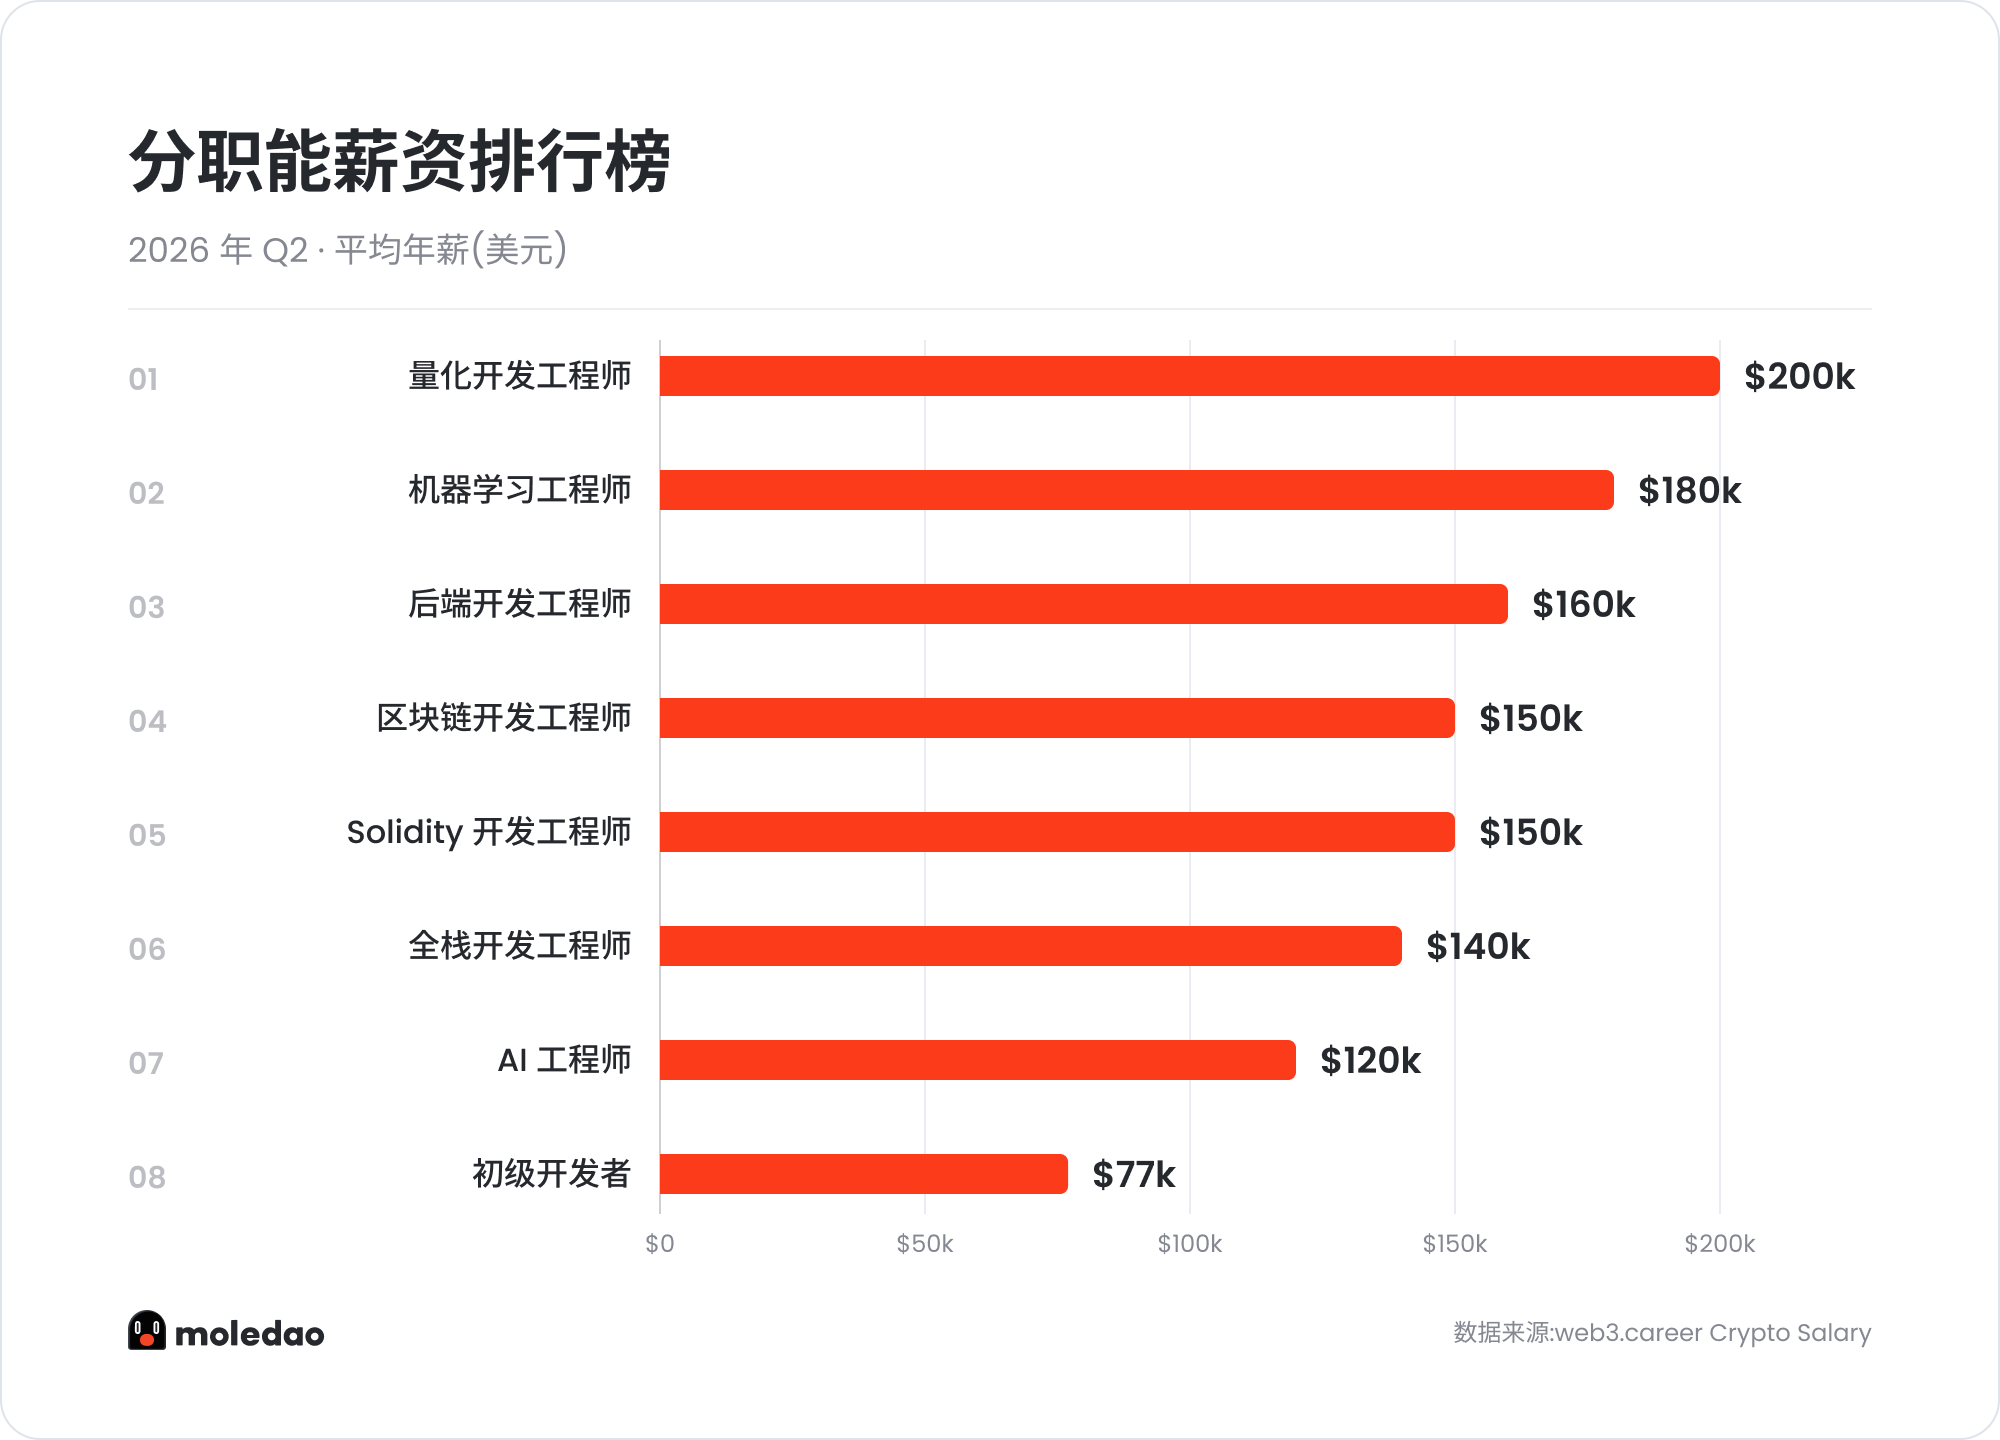
Figure 2 | Salary Comparison by Function
AI skills bring significant premiums. According to CryptoJobsList data, medium-level AI-related positions have an average salary of $115k, while non-AI positions average $95k, a difference of 21.1%. The proportion on the demand side is rising, and the salary premium is also increasing; both sets of data are aligned.
Moledao Data: Misalignment Between Job Supply and Candidate Applications
The above presents the overall industry situation. General market reports do not answer one question: are job seekers actually applying for these posted positions?
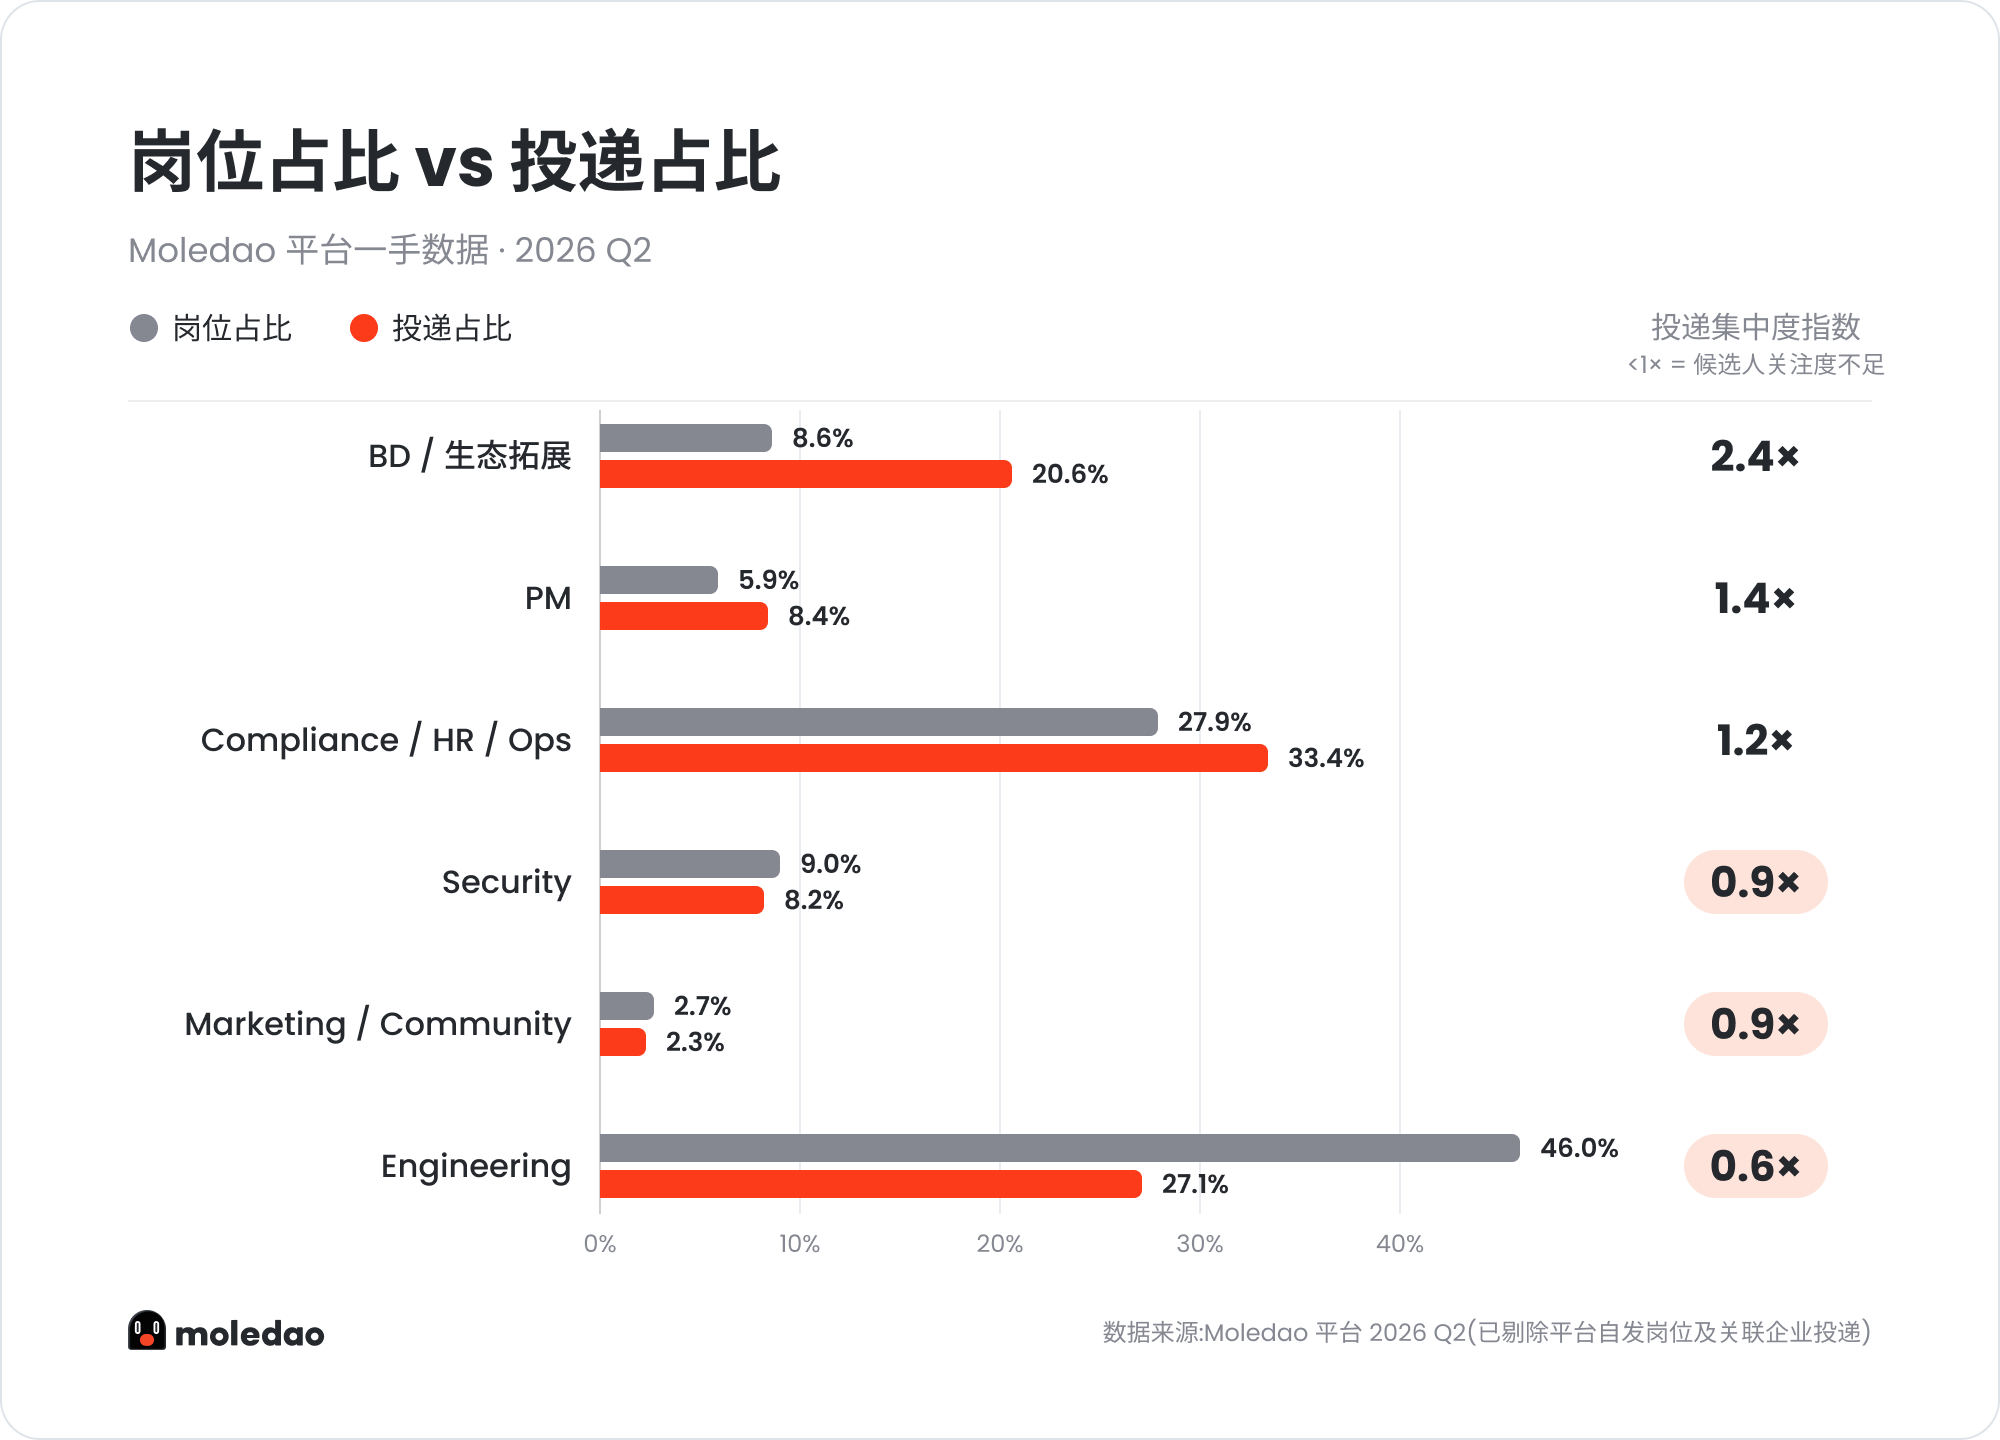
Figure 3 | Comparison of Moledao Job Share and Application Share
Based on Moledao Q2 2026 data, we compared the job share (recruitment demand) and application share (candidate competition) for each function, with the ratio calculating the application concentration index. An index greater than 1 indicates that candidates are relatively concentrated and job supply is relatively scarce; less than 1 indicates that candidate interest is lower than job supply, corresponding to a real talent gap. The low index for technical positions may partly stem from higher self-selection thresholds, but the directional conclusion remains unaffected.
Engineering has the highest recruitment demand, with a job share of 46.0%, application share of 27.1%, and a concentration index of 0.6×, showing that candidate interest is significantly lower than supply, indicating a clear talent scarcity signal this quarter. Security is similar, but to a lesser extent, with an index of 0.9×.
BD, PM, and Compliance/HR/Ops are on the other end, with more concentrated candidate competition. The BD index is 2.4×, indicating it is the most competitive direction for candidates. PM has an index of 1.4×. Compliance/HR/Ops has an index of 1.2×, with relatively moderate competition, but job share as high as 27.9%, making it the function with the most positions outside of engineering. For companies, a higher index category makes it easier to receive applications after posting roles.
Several recruitment agencies have mentioned similar situations in their 2026 market reviews. Technical positions such as security auditing, ZK engineers, and Rust developers have very few qualified candidates globally, which aligns with Moledao data showing lower candidate interest compared to supply in engineering.
Viewing layoffs and scarcity together, these two clues describe the same structural adjustment. What has been cut is often management levels and redundant functions, while companies are competing for specialized technical capabilities.
Recommendations for Job Seekers
The demand for recruitment in engineering is the strongest, while candidate interest is relatively lacking, and the actual competitive pressure is less than the level indicated by the number of available positions. This judgment has a prerequisite: candidates must possess the specialized skills currently needed in the market. Areas such as security auditing, ZK, and Rust are currently the most clear gaps on the demand side.
BD and PM represent a different situation. Positions are limited, and candidate concentration is high, making it difficult for generic resumes to be seen; job seekers need to differentiate themselves in niche directions and verifiable project records to stand out from other candidates. Multiple recruiters have noted significant quality differences between top and lower-tier candidates within BD and PM resumes received.
Job seekers from backgrounds in Compliance/HR/Ops or Security have corresponding positions. The former is the function with the highest number of roles outside of engineering, with a job share of 27.9% and an application concentration of 1.2×, resulting in moderate competition pressure compared to BD and PM. The latter has an index of 0.9×, falling within the low candidate interest range similar to engineering, indicating a lesser degree of gap. These two areas are not widely discussed, and the ratio between competition intensity and opportunity quantity is relatively favorable for job seekers.
Regarding AI skills, over half of job descriptions now include relevant requirements, with about a 20% salary premium reflecting the market pricing. No matter which direction is chosen, job seekers need to prepare AI skills as part of the job requirements.
Recommendations for Employers
Engineering positions find it difficult to attract enough candidates by merely waiting for applications after posting. Candidate interest lags behind supply; proactive outreach is necessary, including headhunting, developer community operations, and internal referral incentives.
The situation in the Security direction is similar, with an index of 0.9×, lighter than Engineering, and relying on passive applications may not fill positions either.
BD and PM positions naturally attract more applications, making them suitable for brand exposure, but the screening costs need to be considered in advance. Positions with high application volumes often come with significant candidate quality disparities; pre-defining screening criteria can prevent being overwhelmed by the application volume.
The challenge for Compliance/HR/Ops lies in the screening end. This is the recruitment direction with the most positions outside of engineering, with a job share of 27.9% and an application concentration of 1.2×, leading to relatively abundant supply, but a large number of candidates also results in high-quality variance. For these roles, having clear screening criteria is more urgent than increasing exposure.
AI skill requirements have already covered 53.1% of positions. Companies that lag in this aspect may lose a considerable proportion of qualified candidates in the screening phase.
Data Explanation
Moledao data samples are from Q2 2026 (April to June), based on platform applications and job records, excluding positions released by the platform itself.
The Marketing/Community category further excludes submissions from a single company associated with this report to avoid bias from a single source. The sample size is limited, and conclusions only reflect directional trends.
External data mainly comes from Tiger Research, the CoinGecko “H1 2026 Global Crypto Hiring Market Analysis Report,” Gate Research “Q1 2026 Crypto Employment Trends White Paper,” CryptoJobsList “Layoffs Report 2026” and “The 2026 Web3 Workforce Report,” Bitget and Blockchain4Youth “Web3 Next-Gen Talent Intelligence Report,” web3.career “Crypto Salary” and CoinCup H1 2026 report. The publication dates and statistical standards for each data source vary significantly, and specific numbers are for directional reference only.
免责声明:本文章仅代表作者个人观点,不代表本平台的立场和观点。本文章仅供信息分享,不构成对任何人的任何投资建议。用户与作者之间的任何争议,与本平台无关。如网页中刊载的文章或图片涉及侵权,请提供相关的权利证明和身份证明发送邮件到support@aicoin.com,本平台相关工作人员将会进行核查。


