Author: insights4vc
Translation: Deep Tide TechFlow
Deep Tide Introduction: The scale of on-chain tokenized assets looks appealing, but behind it lies a fundamental contradiction—products that can circulate freely often lack true ownership, while products that have real legal validity are often illiquid. This report uses concrete data to dissect how much of this "1.89 billion dollar market" is real cash, serving as a necessary wake-up call for any investor considering a position in on-chain securities.
The stock market has not moved on-chain. What has emerged is a more credible layer of infrastructure—used for distributing securities, recording ownership claims, and completing transaction settlements through blockchain-based systems.
Data from RWA.xyz shows that the value of distributed tokenized stocks grew from 951 million dollars in March 2026 to 1.89 billion dollars in July, nearly doubling. However, this growth primarily comes from a few products and platforms.
The most significant progress has come from regulated market infrastructure, particularly the same CUSIP settlement model as Nasdaq, along with commercial rollouts in the DTC program. Liquidity, investor distribution, and independent on-chain price discovery mechanisms remain very limited. Tokenized government bonds continue to show a stronger product-market fit, while stock ETFs may scale more easily than single stocks.
Therefore, this market is best understood as a divided "Layer 2.5" system: products with the most solid legal foundations often have the weakest liquidity and distribution capabilities, while the most actively traded packaged products typically enjoy the weakest ownership rights.
This report is an update to insights4vc's March 2026 analysis on the state of on-chain real assets, focusing on the substantial changes that have occurred since its publication.
The State of On-Chain Real Assets

What Substantial Changes Occurred After March
The March report distinguished between two types of assets: those recorded on the blockchain and those that can be transferred to external wallets. This distinction remains important. Within the framework of RWA.xyz, "represented assets" stay within the issuer or platform's own environment; "distributed assets," on the other hand, can be transferred externally, albeit transfers may still be limited to approved or whitelisted wallets.
However, transferability alone is no longer sufficient to judge a product's maturity.
Since March, offshore products have become more convenient for cross-chain liquidity and use in decentralized markets. Ondo expanded to Ethereum, BNB Chain, and Solana, introducing decentralized routing and adding continuous minting and redemption features for some products. xStocks has also broadened its distribution channels and collateral integrations.
Meanwhile, regulated U.S. infrastructure has taken a different path: the focus is not on unrestricted portability but on legal certainty, controlled wallets, compliant custody, transfer agent records, and integration with DTC.
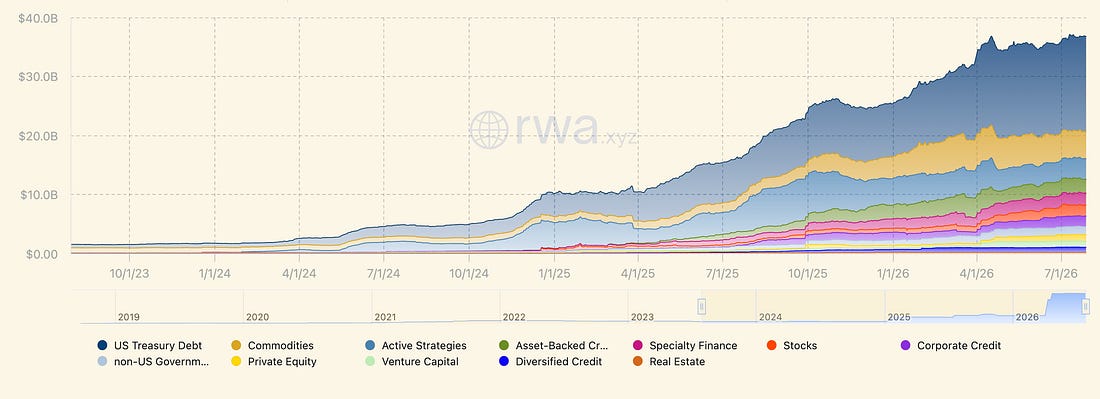
Figure: Evolution of Various RWA Asset Market Values from 2019 to 2026 (including tokenized stocks, government bonds, etc.)
These two paths address different issues: offshore packaged products enhance accessibility and composability; regulated infrastructure strengthens the connection between tokens and legal ownership claims.
"Canonical shares" are the underlying securities authorized by the issuer, whose transfer is recognized in official ownership systems. They are fundamentally different from third-party tools that only track stock prices or performance.
Currently, no product can achieve all four elements simultaneously at scale: standard ownership, widespread wallet distribution, institutional liquidity, and independent on-chain price discovery.
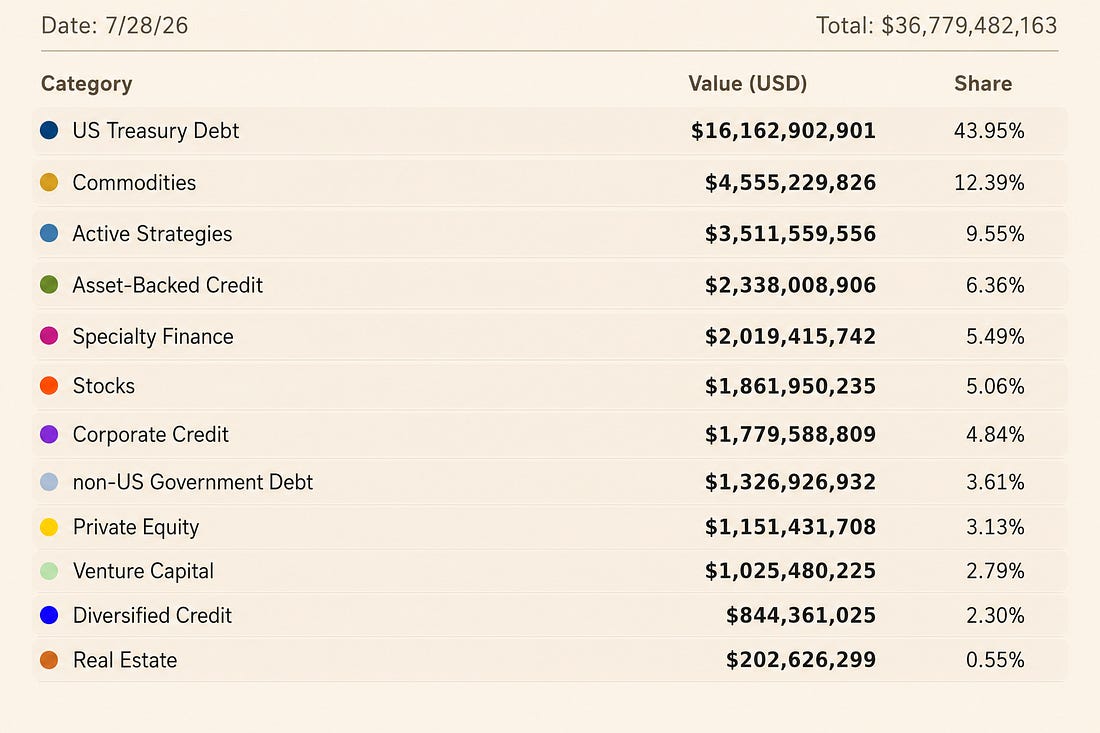
Figure: Total Statistics of On-Chain Real Assets (as of July 28, totaling approximately 36.78 billion dollars, with U.S. government bonds accounting for 43.95%)
Macro-level RWA total data also needs to be interpreted cautiously. Data reported by RWA.xyz on July 29: distributed value is 36.81 billion dollars, represented value is 218.27 billion dollars. Although represented value appears to have declined by 12.43 billion dollars, this should not be interpreted as a capital outflow or redemption wave. Between the two observation dates, many datasets underwent additions, deletions, reclassifications, or revaluations.
These numbers describe the equity value covered by the platform's methodology at specific points in time, rather than a measure of the movement of investor funds.
The series of tokenized stocks is more valuable for reference, as the same "bridging token value" methodology can be applied to both periods. Even so, the reported 98.5% increase cannot be clearly broken down into three parts: new issuances, price increases, and categorization adjustments.
FGRS provides a useful example. Figure raised capital by issuing 4.375 million shares of blockchain stock at 32 dollars per share, but the reported value subsequently fluctuated with the market price. Without daily data on minting, burning, and net asset values for each product, it is impossible to reliably reconstruct the total market net issuance.
Why the 1.88 Billion Dollar Headline Figure is Misleading
RWA.xyz uses "bridging token value" to measure tokenized stocks, calculated as: bridging circulating supply multiplied by net asset value.
Circulating supply does not include balances identified as treasury holdings or pre-mint inventories. The bridging number also excludes tokens locked in known bridging contracts to avoid double counting when an asset is locked on one network and issued on another.
This is an effective measure of distributed value but differs from free-floating shares. Free-floating shares refer to the portion of securities truly available for public trading after excluding restricted positions, strategic holdings, and concentrated holdings.
Timing of data is also crucial. The provided asset-level export data shows that the distributed total value on July 27 was 1.8879 billion dollars, matching the approximately 1.88 billion dollars displayed on the dashboard. A snapshot on July 29 across platforms and networks totaled approximately 1.872 billion dollars.
The difference between the two is 15.8 million dollars, accounting for 0.84%, consistent with changes in price and token supply between the two observation dates. Therefore, specific growth calculations for tools in this report utilize data from July 27, while platform and network market shares rely on the July 29 snapshot, and the two datasets do not mix in the same calculation.
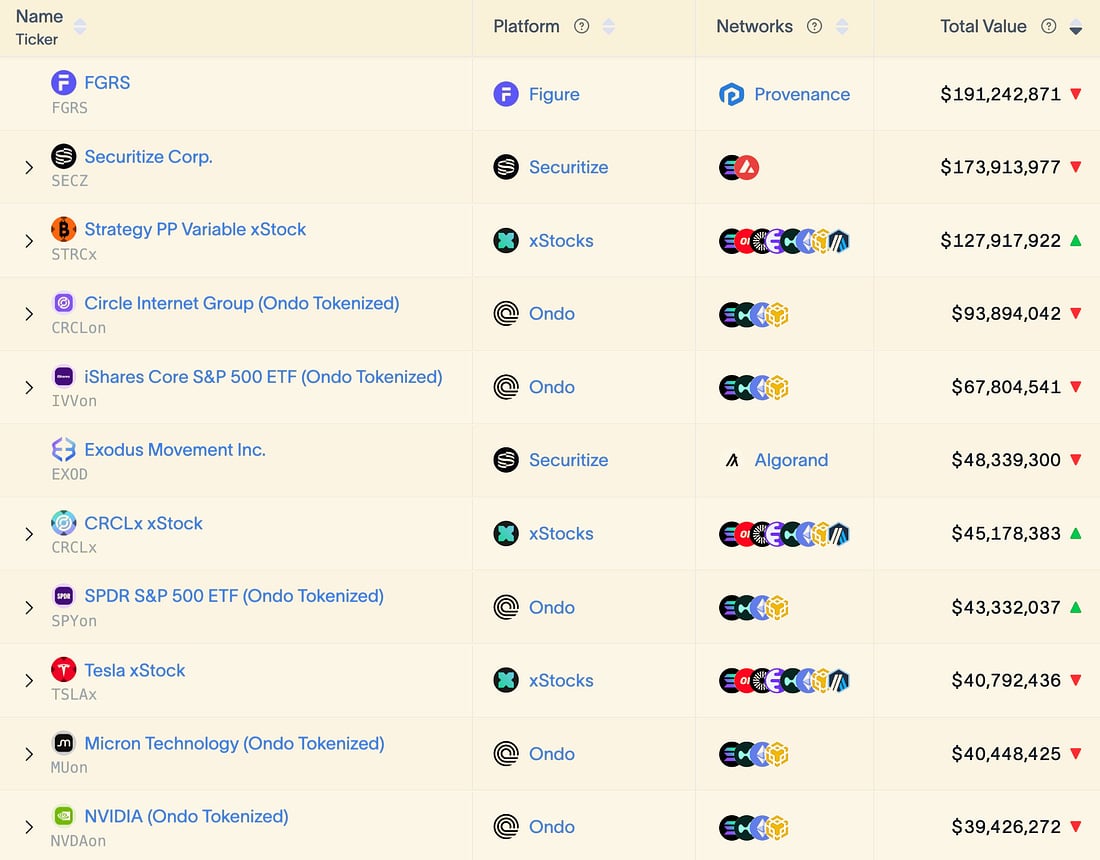
Figure: Details of Tokenized Stocks (10 assets categorized by issuance platform and network, with FGRS at approximately 191 million dollars)
Three named tools contributed about half of the incremental growth: SECZ increased by 169 million dollars post-listing, FGRS added 162.9 million dollars, and STRCx contributed 126.6 million dollars. Together, they accounted for 458.6 million dollars, or 49% of the total incremental growth of 936.8 million dollars. Long-tail products contributed another 150.5 million dollars, making up 16.1% of the increment.
These numbers reflect changes in distributed value rather than investor subscription amounts.
SECZ is influenced by both the number of represented shares and the Securitize NYSE price. FGRS provides a comprehensive reflection of issuance, conversion activity, and market price changes. STRCx depends on the circulating supply and value of certificates tied to Strategy floating-rate preferred stock.
Labeling the growth of these three items as "inflows into tokenized stocks" merges several economically distinct events into a single, potentially misleading figure.
Concentration is more apparent at the platform level. In the July 29 snapshot, Ondo and xStocks together accounted for 72.7% of distributed value. Including Securitize, the combined share of the top three platforms rises to 85.1%.
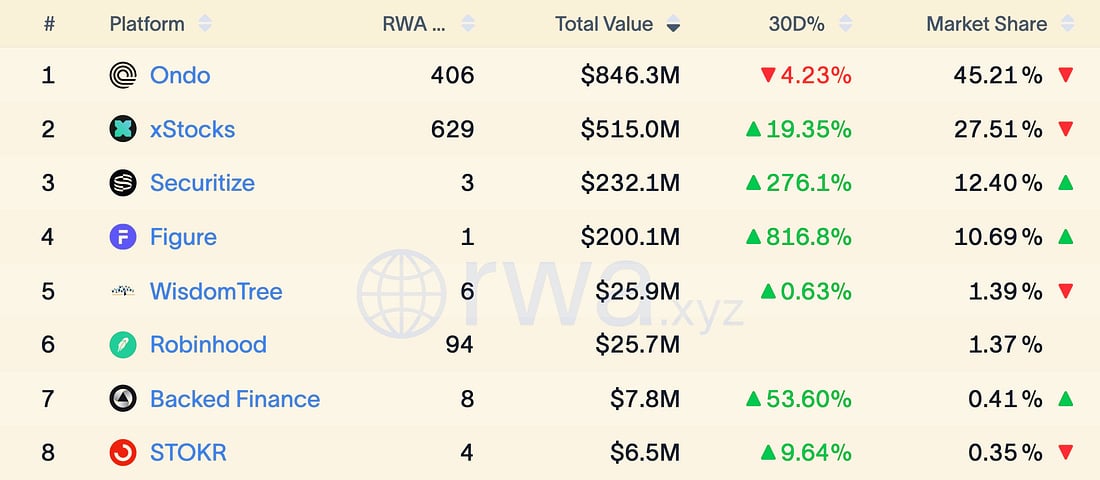
Figure: RWA.xyz Platform Rankings—Ondo (45.21%), xStocks (27.51%), Securitize (12.40%) are the top three
Distribution across different blockchain networks is more decentralized, but this does not eliminate underlying common dependencies. Ethereum leads with a 36.2% value share, followed by Solana (19.6%) and BNB Chain (15.8%). Provenance and Avalanche are mainly driven by Figure and Securitize, respectively.
Products issued on different networks may still rely on the same packaging issuer, broker, custodian, securities agent, or reference price provider.
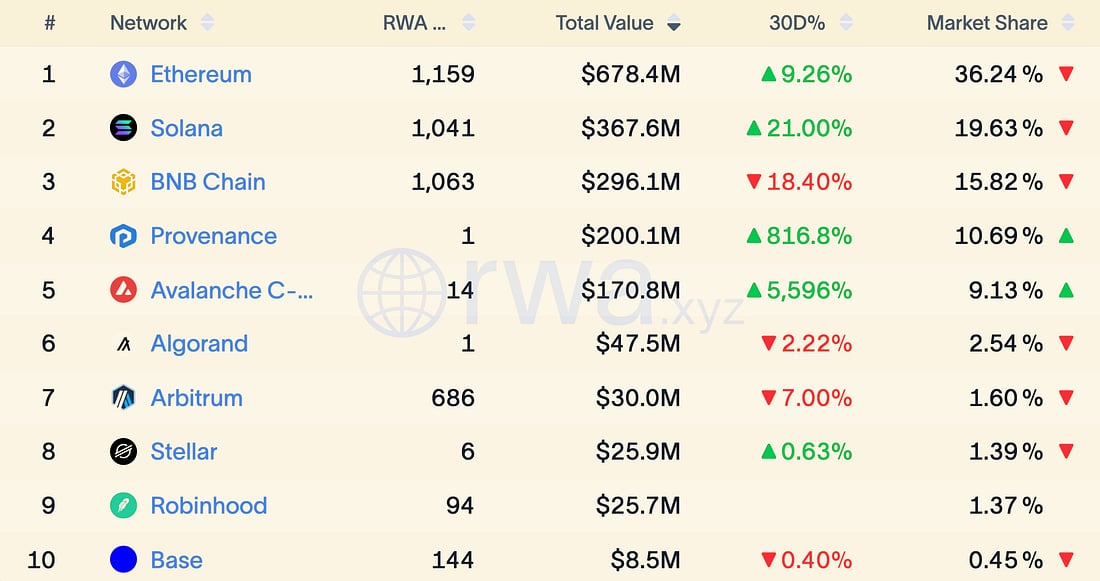
Figure: RWA.xyz Network Rankings—Ethereum (36.24%), Solana (19.63%), BNB Chain (15.82%) are the top three
This market has broadened in scope but remains legally fragmented. Multiple tokens can refer to Apple stock or S&P 500 ETF at the same time, yet each is a separate legal liability subject to different jurisdictions and reliant on different intermediaries.
The bridging adjustments prevent the same token from being counted twice across different networks, but they cannot—and should not—collate products that reference similar assets yet offer substantively different legal rights.
免责声明:本文章仅代表作者个人观点,不代表本平台的立场和观点。本文章仅供信息分享,不构成对任何人的任何投资建议。用户与作者之间的任何争议,与本平台无关。如网页中刊载的文章或图片涉及侵权,请提供相关的权利证明和身份证明发送邮件到support@aicoin.com,本平台相关工作人员将会进行核查。


