BTC 4-Hour Market Analysis
Market Signal Overview
1. Bollinger Band Structure
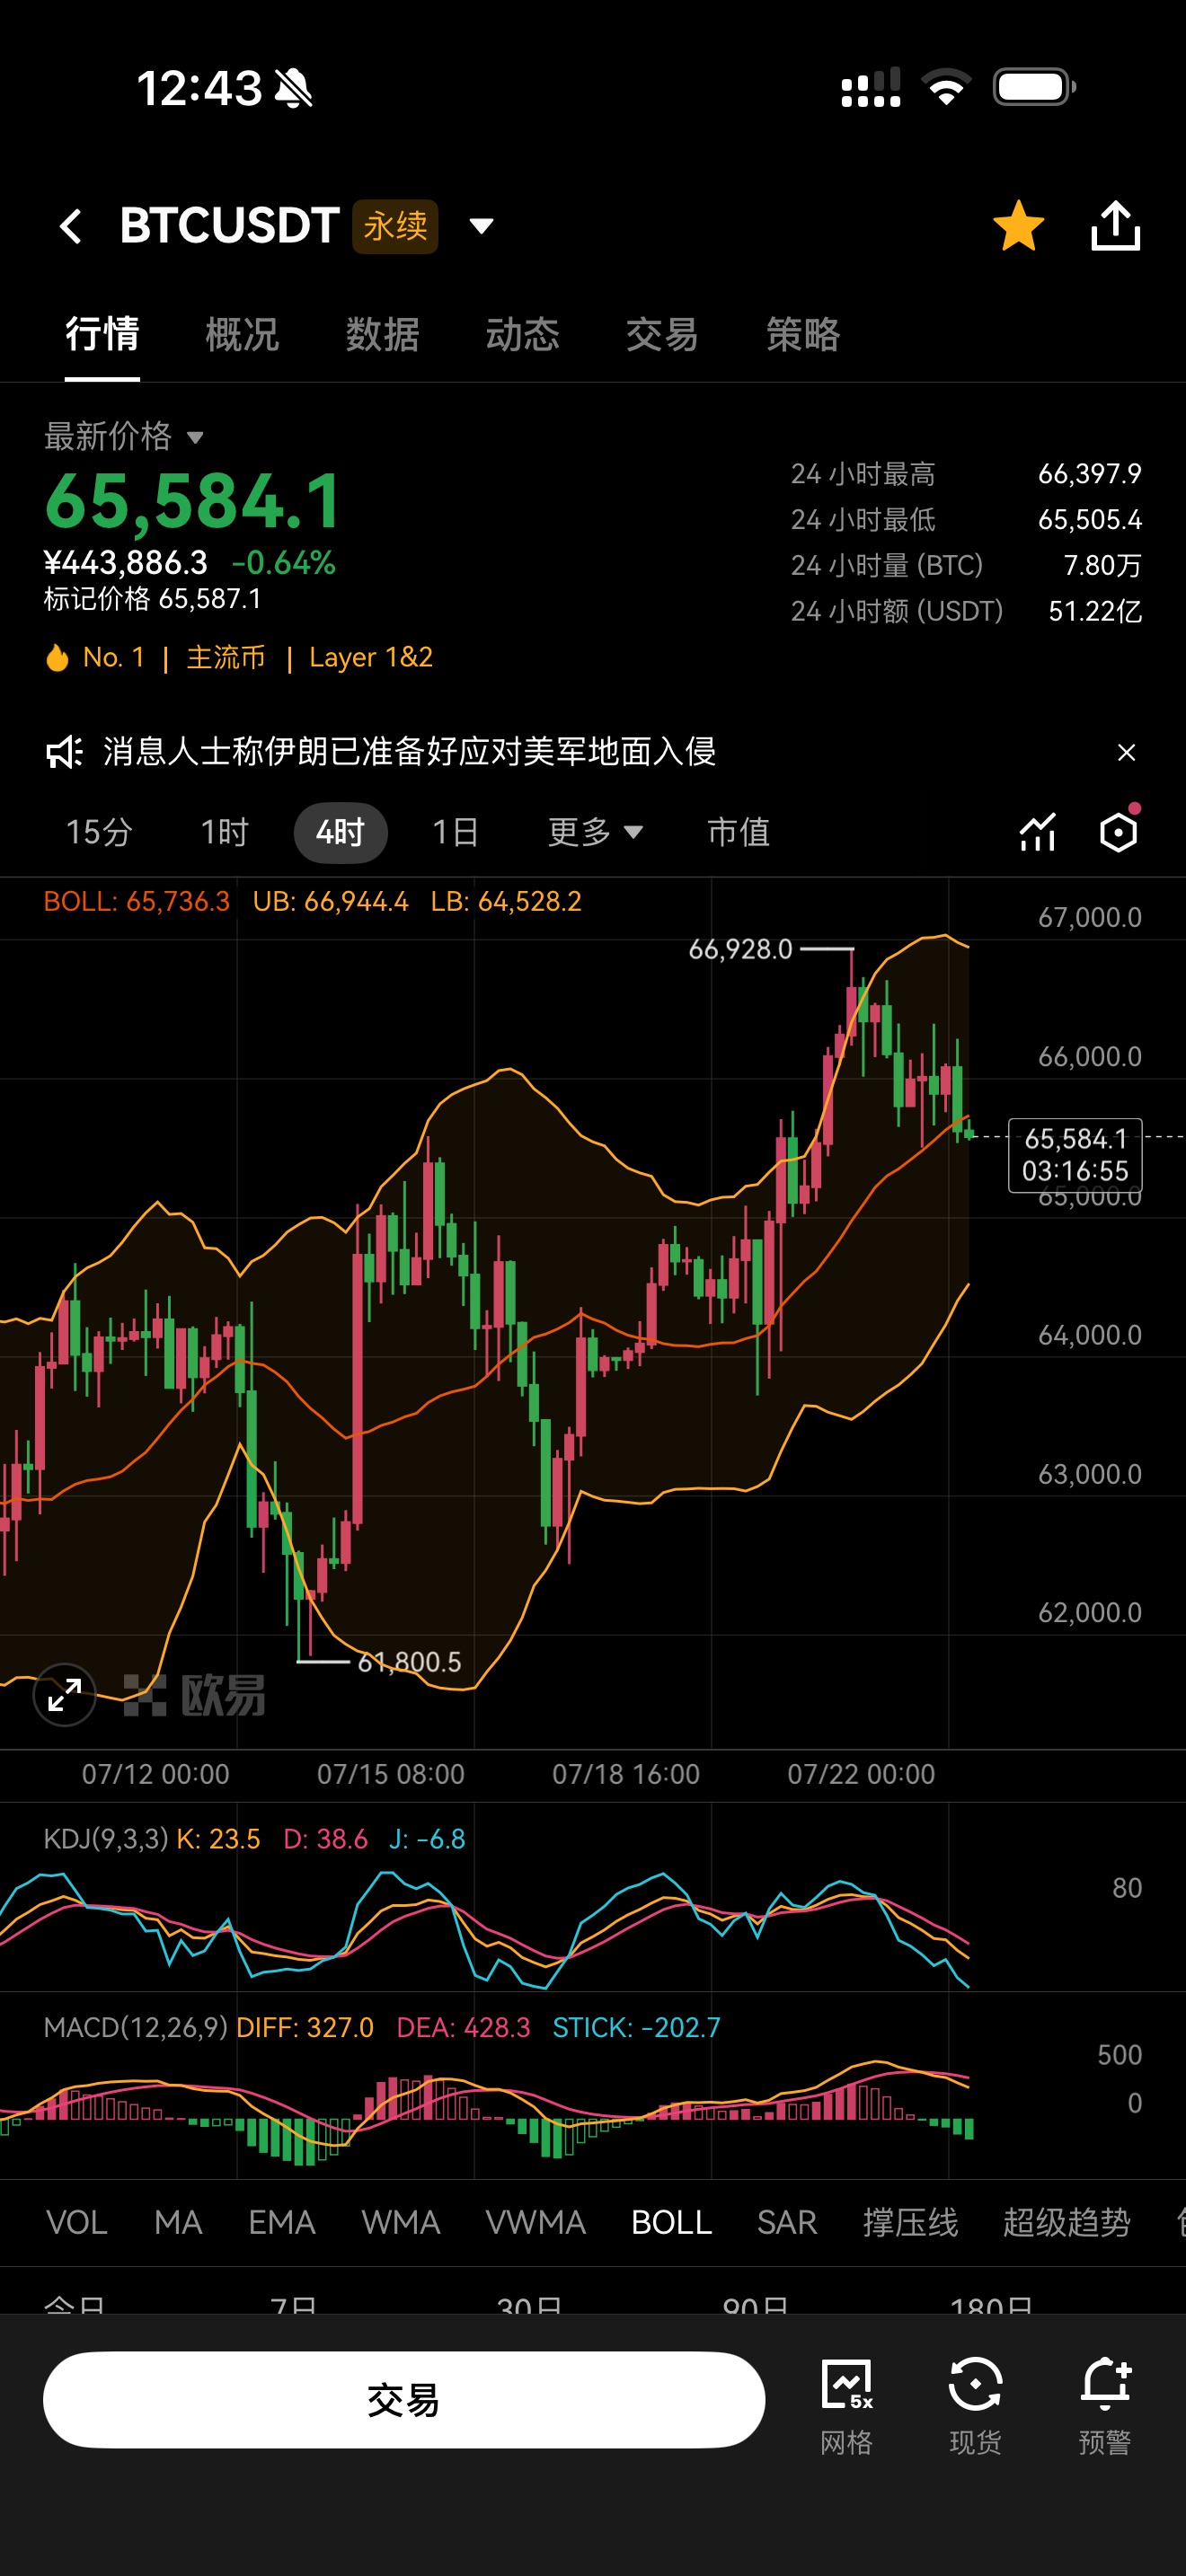
The 4-hour Bollinger middle band is at 65736, the current price of 65584 has slightly broken below the middle band. The previous high of 66928 touched the upper band and fell back under pressure, with the price gradually moving down from the upper edge of the channel.
The Bollinger middle band is the dividing line between strength and weakness in this rally. Staying above it indicates a bullish fluctuation pattern, but if effectively broken below, the downside correction space will further open up, with the first target below looking towards the Bollinger lower band at 64528.
2. Technical Indicator Status
KDJ forms a death cross continuing to decline, and the J value has entered the negative zone, currently in a phase of short-term oversold recovery, with the possibility of a small rebound at any time;
The MACD indicator DIFF has crossed below DEA, with green bars continuously expanding, while bullish momentum continues to weaken, and bearish strength is slowly taking over the short-term dominance.
3. K-Line Pattern
After reaching the phase high of 66928, it has consecutively closed with red candles fluctuating downwards, with the highs gradually descending, which constitutes a persistent downward trend after the high. The current state represents a phase adjustment after a bullish surge.
Key Support and Resistance
Resistance Levels
First Resistance: 65736 (Bollinger middle band), primary resistance for rebound;
Strong Resistance: 66500-66928 previous high range, must regain stability here to reverse the short-term adjustment trend.
Support Levels
Short-term Support: around 65500, current battle point;
Core Support: 64528 (Bollinger lower band);
Important Trend Support: around 63800.
Market Classification
After reaching the peak, it has entered a phase adjustment cycle. The short-term bears dominate, but short-term indicators are oversold, likely to execute a "small rebound under pressure, then downward" rhythm.
Any fluctuation rebound is seen as a lure for recovery; a true opportunity awaits for a volume breakout to realize lower targets.
Official Account——Bitcoin Bear X
(Note: 📣 Due to the limited timeliness and depth of information on public platforms, the market is constantly changing, and key turning points, precise operational strategies, and sudden risk alerts must be synchronized through the official account in real time. Here you can get: real-time strategy updates, in-depth analytical support, interactive Q&A, personalized risk warnings and optimization suggestions for your holdings. 🚨 Remember: The market always rewards those who act faster and have more accurate information! Be a winner among the minority.)

免责声明:本文章仅代表作者个人观点,不代表本平台的立场和观点。本文章仅供信息分享,不构成对任何人的任何投资建议。用户与作者之间的任何争议,与本平台无关。如网页中刊载的文章或图片涉及侵权,请提供相关的权利证明和身份证明发送邮件到support@aicoin.com,本平台相关工作人员将会进行核查。


