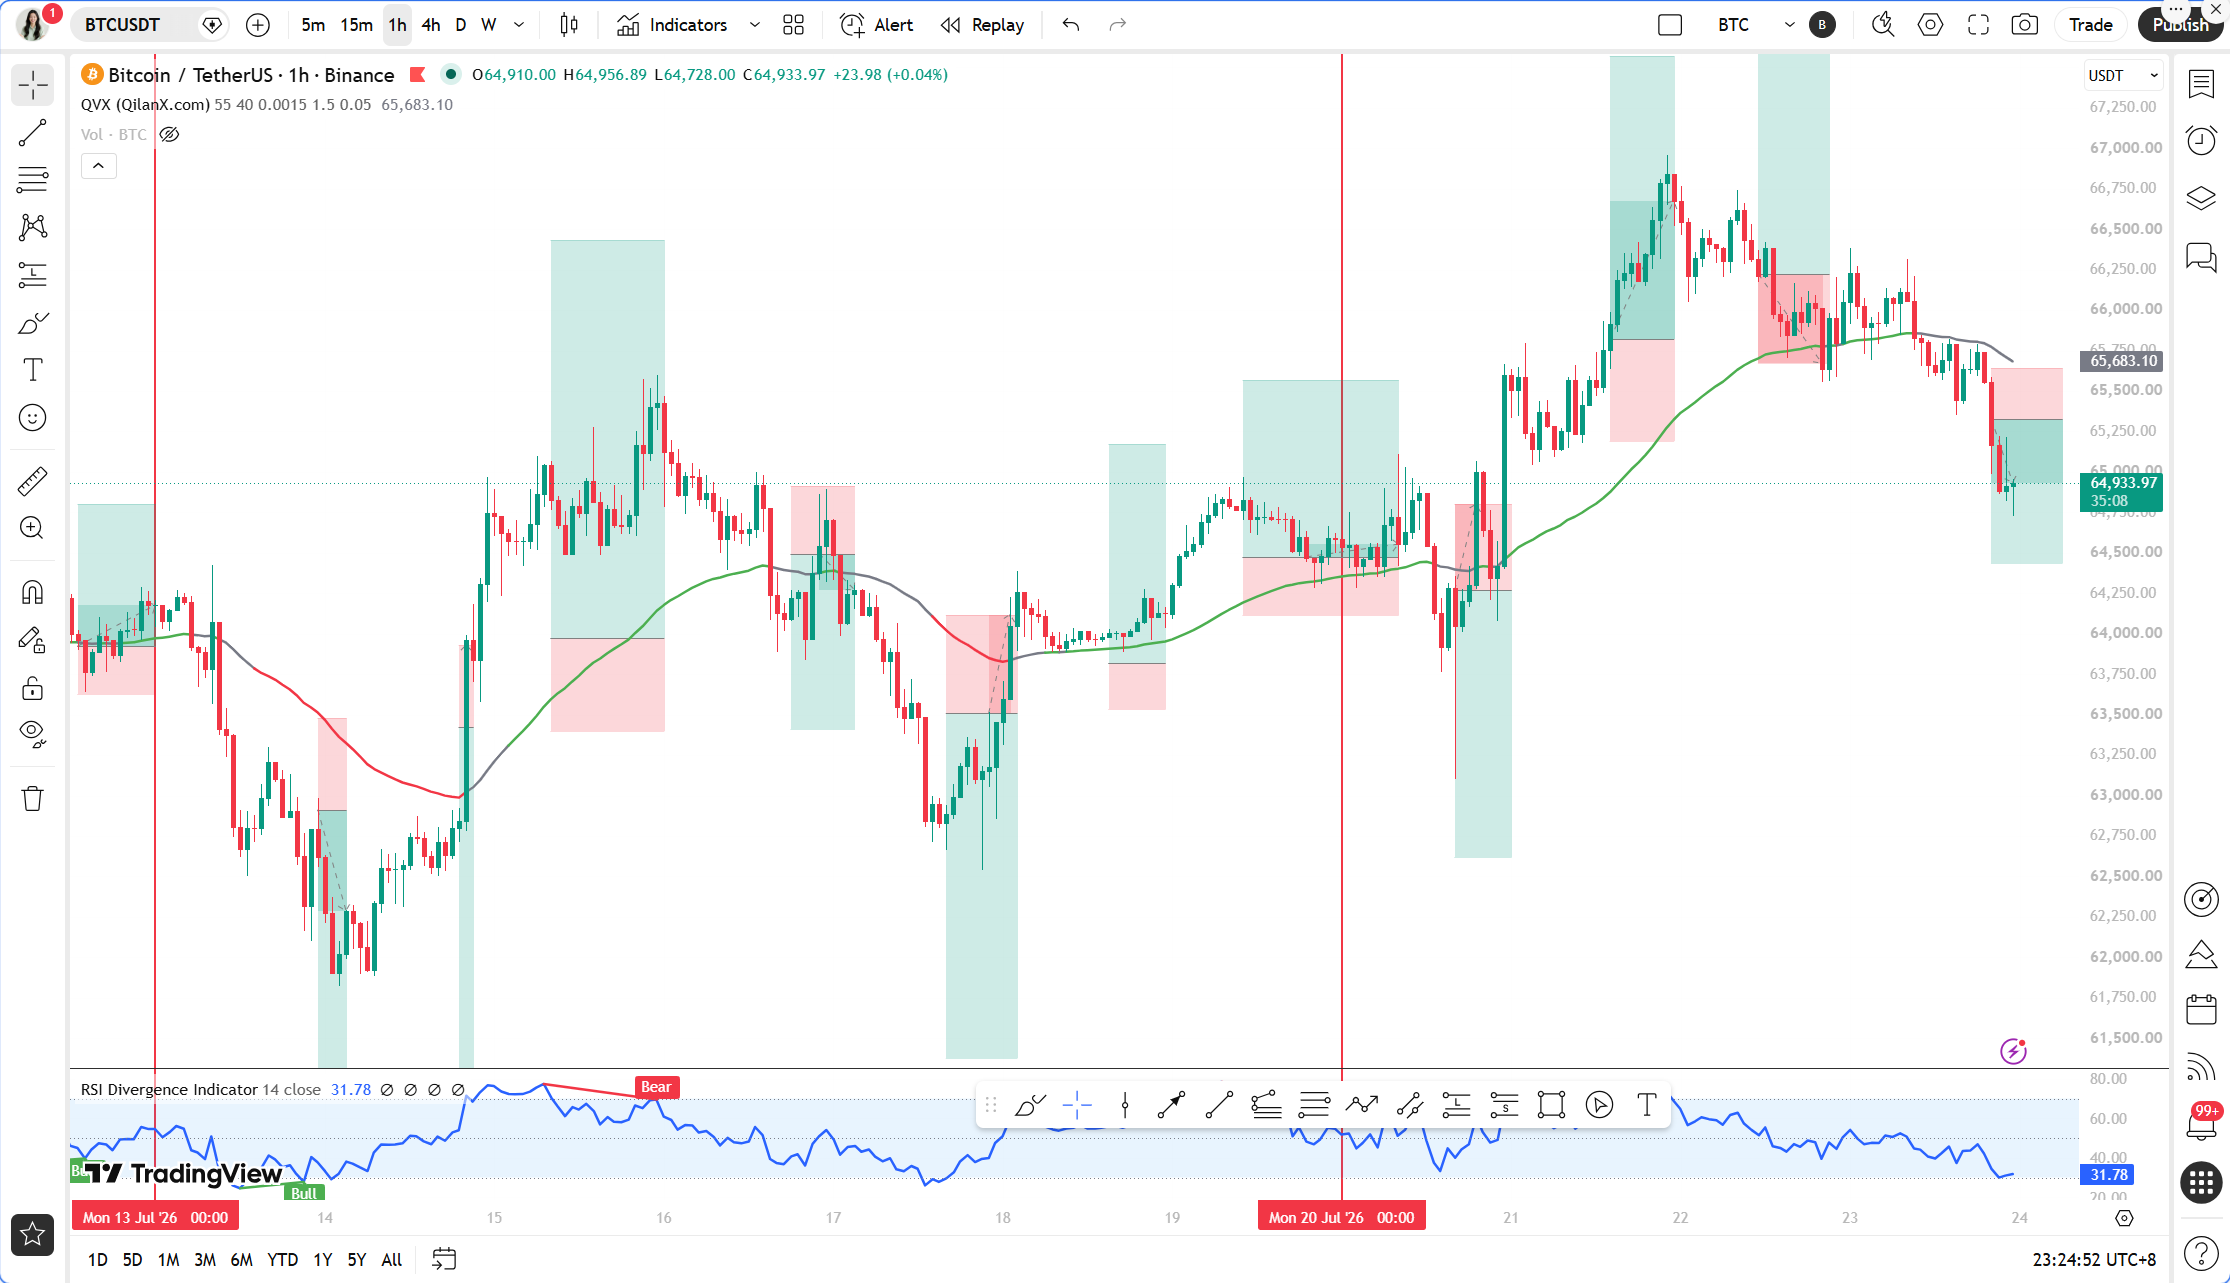
Team members, tonight's market conditions are nerve-wracking. WTI crude oil surged 5% in a single day, the U.S. military has launched strikes on Iran for 12 consecutive nights, and geopolitical conflicts are directly raising inflation expectations; meanwhile, the market bets on a Federal Reserve interest rate hike, with Brent crude surpassing $100, putting immense macro pressure on risk assets. BTC fell below $65,000, short-term volatility has intensified, and market sentiment has dropped into the fear zone. In this situation, is it a bottom-buying opportunity or a continuation of the decline? Sister Qinglan lets the data speak, taking you through the current market analysis.
Currently, the BTC price is reported at 64913 USDT, time fixed at July 23, 23:26. The 24-hour drop is 1.68%, market share is 56.61%, and the fear and greed index is at 31, indicating cautious market sentiment. On-chain data shows no significant movements, but the negative signals from the macro environment need to be taken seriously.
Let’s review the multi-timeframe state, starting with the daily chart. The daily MA5 is at 65512, MA10 at 64995, and MA30 at 62913, with the price above all moving averages. The MACD histogram is at 292.77, and the RSI is at 57.46, indicating an overall bullish trend. However, note that although the daily MACD histogram is positive, it has started to flatten, and upward momentum is weakening. On the 4-hour level, MA5 is at 65537, MA10 at 65772, and MA30 at 65423, with the price having fallen below both MA5 and MA10. The MACD histogram is at -171.37, and the RSI is at 31.76, indicating that bearish momentum is being released. The 1-hour level is even more pronounced, with MA5 at 65084, MA10 at 65366, and MA30 at 65734, and the price has fallen below all of them. The MACD histogram is at -87.70, and the RSI is at 26.17, indicating short-term overselling. On the 15-minute level, MA5 is at 64954, MA10 at 64985, and MA30 at 65389, with the price struggling below the moving averages. The MACD histogram is at -28.72, and the RSI is at 31.22, with bearish momentum somewhat diminishing.
Now let's verify signals using Qinglan's TPV system. The core rule is that the 1-hour EMA55 serves as the boundary for long and short positions. Currently, EMA55 is at 65662.71, and the price of 64913 is far below this, indicating a bearish trend. For short conditions, firstly, the price is pressured below the 1H EMA55, and over the past 8 1-hour candles, the closing price has been above EMA55 only once, with it crossing twice, thus meeting the condition of two consecutive closing prices below EMA55. Secondly, there is an encountered resistance pattern; from the 1-hour chart, the price has repeatedly failed to break through the 65600-65700 area, forming a clear top reversal structure. Thirdly, the rebound is weak; although the 1-hour MACD histogram has shortened for two consecutive periods, the RSI has limited upward movement from 26.17, and the MACD histogram remains negative, indicating that bearish momentum has not fully exhausted. Overall, the TPV system gives a bearish signal, but we need to be cautious of a technical rebound after an oversold condition.
Oscillation auxiliary data shows that in the past 8 1-hour candles, the closing price above EMA55 occurred 1/8 times, with 2 crossings, and the price is 1.14% away from EMA55, not meeting the oscillation threshold, currently indicating a one-sided bearish trend. This means do not easily attempt to buy the bottom; wait for clear stabilization signals before considering long positions.
Regarding on-chain funding, the fear and greed index is at 31, which falls into the fear range. Historically, this sentiment often corresponds to a temporary bottom, but confirmation with technical analysis is required. BTC's market share is at 56.61%, indicating that funds are still seeking refuge in BTC, while altcoins may be under heavier pressure. On the macro front, the surge in oil prices and interest rate hike expectations are the dominant factors in the short term, and if geopolitical risks persist, risk assets may continue to be under pressure.
Key defense and attack points: the first resistance level is near the 1-hour EMA55, around the 65662-65700 area, which is the boundary for long and short positions; breaking through and stabilizing above it would indicate a bullish trend. The second resistance is near the 4-hour MA10, around the 65770-65800 area. The first support level below is in the 64500-64800 area, which is a cluster of previous lows; if broken, it may accelerate the decline to the 63000-63500 area, corresponding to the daily MA30.
Trading strategy: the direction is clear; short positions dominate in the short term, but it is severely oversold, and pursuing shorts is not recommended; instead, wait for a rebound to resistance levels to layout short positions. Entry conditions: if the price rebounds to the 65500-65600 area and the 1-hour candle shows a long upper shadow or top reversal structure while the MACD histogram remains negative, a light short position can be taken. Set the stop-loss above 65850, and target at 64500. If it breaks below 64500, hold the position for 63500. If the price directly breaks below 64500, do not pursue shorts; wait for a rebound confirmation before entering. If a long lower shadow or bottom reversal structure appears in the 64500-64800 area, and the 1-hour MACD histogram shortens for two consecutive periods with RSI rebounding from the oversold area, a light long position can be tried, with stop-loss set below 64200 and target at 65500-65600.
Risk warning: macro uncertainty is high, and geopolitical conflicts along with the Federal Reserve's meeting results may trigger severe volatility; strictly set stop-losses and control position sizes.
Follow Qinglan's crypto class to seize more trading opportunities! Welcome to visit the official website www.qinglan.org
📊 Qinglan TPV trading strategy backtesting reference
🕒 Last backtesting time 07-23 07:00:01
Total analysis: 3143 Backtests: 2364 Accuracy rate: 76.7% (1814/2364)
免责声明:本文章仅代表作者个人观点,不代表本平台的立场和观点。本文章仅供信息分享,不构成对任何人的任何投资建议。用户与作者之间的任何争议,与本平台无关。如网页中刊载的文章或图片涉及侵权,请提供相关的权利证明和身份证明发送邮件到support@aicoin.com,本平台相关工作人员将会进行核查。


