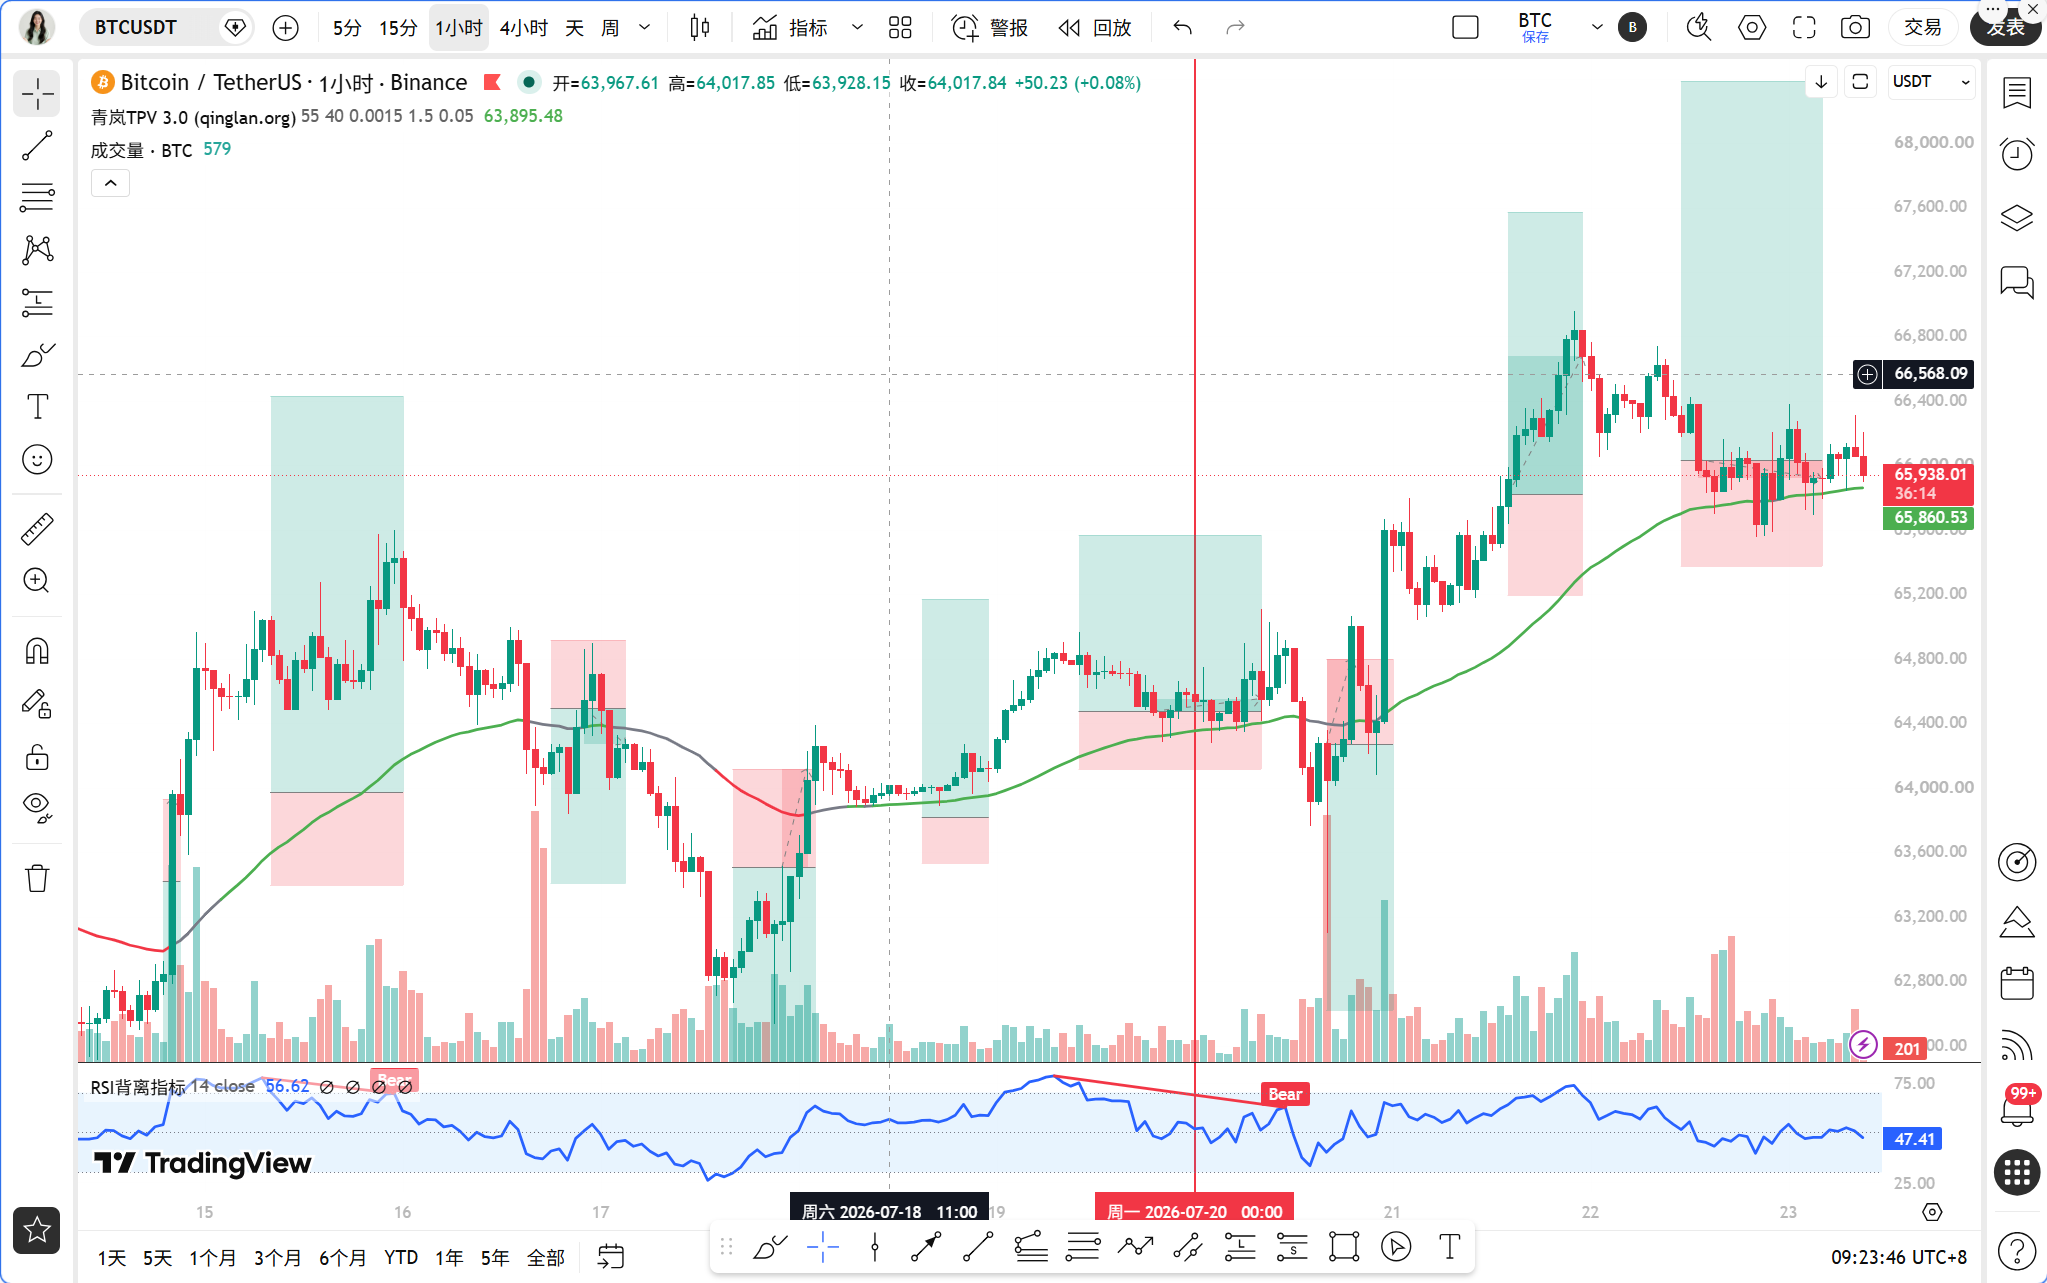
Dear teammates, I am Sister Qinglan. In today’s morning session, the market sentiment was stirred by two major pieces of news: the escalation of the US-Iran conflict increased oil prices, and Google's after-hours plummeted 4% due to raised capital expenditures, putting pressure on tech stocks. This is a typical macro bearish combination for BTC. Currently, BTC is hovering around 65932 USDT, and the 66,000 mark is in jeopardy. Let’s dive into the data and break down the current situation using the TPV system.
Current Price and Time
Time: July 23, 09:24
BTC Price: 65932 USDT
24-hour Change: -0.69%
Fear and Greed Index: 31, the market is in the fear range, and retail sentiment is leaning bearish.
Multi-Cycle Status Overview
On the daily level, MA5 is at 65716, MA10 is at 65097, the price is above the averages, MACD bars are at 357.83, bullish momentum is still present, but RSI is 63.17, which is not overly bought, showing a neutral to strong tendency. On the 4-hour level, MA5 and MA10 are around 66006 and 66176, the price is slightly below the short-term averages, MACD bar is -57.60, bear momentum appears, RSI is 62.00, retracting from the high. On the hourly level, MA5, MA10, and MA30 are near 66044, 66021, and 66099, the price is operating below the averages, MACD bar is 1.48, but DIF and DEA are still below the zero axis, RSI is 48.05, neutral to weak. On the 15-minute level, MACD has a death cross, RSI is 43.42, short-term bears are dominating.
Overall, bullish structures are still present on the daily and 4-hour levels, but have weakened on the hourly and 15-minute levels, creating contradictions across multiple cycles, which is a typical precursor to fluctuation or correction.
TPV Signal Verification
According to the Qinglan TPV system, we use the 1-hour EMA55 (65863.57) as the bullish-bearish dividing line. The current price is 65932, above EMA55, theoretically within the bullish trend area. However, supporting oscillation data shows that out of the last 8 hourly candlesticks, the closing price was above EMA55 8 out of 8 times, with 0 crossings, indicating the price has been consistently operating above EMA55 without crossing. Additionally, the absolute magnitude of the distance from EMA55 is only 0.10%, indicating tight fluctuations, increasing the probability of oscillations. This does not meet the threshold for a unilateral trend, the system indicates an increasing probability of oscillation.
Conditions for Going Long: Although the price remains stable above EMA55, the patterns on the 15-minute and hourly charts have not displayed significant long lower shadows or bottom formations, MACD bars on the hourly chart are positive, but DIF and DEA are below the zero axis with no significant exhaustion of downward momentum. Conditions for Going Short: The price has not been pressured below EMA55, and the condition of two consecutive hourly closing prices below EMA55 is not satisfied. Hence, the current TPV system does not present clear signals for going long or short, residing in an observation area for oscillation.
On-Chain/Fundamentals
On-chain data indicates a fear and greed index of 31, signaling market fear, which is often a range for large fund accumulation. However, there is a slew of bearish news: the US-Iran conflict, the plummet of tech stocks, and the Federal Reserve's interest rate hike probability rising to 31.5%, which dampens risk appetite. On the bullish side, the head of research at Grayscale believes that if the Federal Reserve pauses interest rate hikes, Bitcoin may have bottomed out, but this is expectation, not reality. In terms of fund flow, BTC's market share is 56.73%, indicating that funds are still taking refuge in BTC, but lacking incremental inflow.
Key Attack and Defense Levels
Upper Resistance: The 1-hour MA30 is at 66099, and the 4-hour MA10 is at 66176, this is a strong short-term resistance. If broken, the next target is in the 66500-66800 range.
Lower Support: The 1-hour EMA55 is at 65863, this is the bullish-bearish dividing line. If broken, the 4-hour MA5 near 66006 might provide temporary support, but more critical support lies at the daily MA5 of 65716 and MA10 of 65097.
Trading Thoughts
The current TPV system has no clear signals, and the probability of oscillations is increasing, it is advisable to mainly observe. However, if the price shows a clear breakout, operations can be carried out according to the following thoughts.
Direction: Going Long
Entry Conditions: The price pulls back to the 1-hour EMA55 (65863) without breaking, and shows long lower shadows or bottom formations, while a 15-minute MACD golden cross or RSI rebounds from below 30. The entry range is between 65850-65950.
Stop Loss: Below 65700 (below the daily MA5), with a stop loss margin of about 250 points.
Target: First target at 66200 (near the 1-hour MA30), second target at 66500 (above the 4-hour MA10).
Direction: Going Short
Entry Conditions: Price breaks below the 1-hour EMA55 (65863), and two consecutive hourly closing prices fall below that line, while a 15-minute top formation or long upper shadow appears. The entry range is between 65800-65700.
Stop Loss: Back above 66000, with a stop loss margin of about 300 points.
Target: First target at 65500 (below the 4-hour MA5), second target at 65100 (near the daily MA10).
Risk Disclaimer
The current macro bearishness adds to technical oscillations, volatility may intensify, and it is crucial to operate with light positions and strict stop losses.
Follow Qinglan's Crypto Class to grasp more trading opportunities! Visit the official website www.qinglan.org
📊 Qinglan TPV Trading Strategy Backtest Reference
🕒 Last Backtest Time 07-23 07:00:01
Total Analysis: 3143 Backtest: 2364 Accuracy: 76.7% (1814/2364)
免责声明:本文章仅代表作者个人观点,不代表本平台的立场和观点。本文章仅供信息分享,不构成对任何人的任何投资建议。用户与作者之间的任何争议,与本平台无关。如网页中刊载的文章或图片涉及侵权,请提供相关的权利证明和身份证明发送邮件到support@aicoin.com,本平台相关工作人员将会进行核查。


