Source: Insightful Talks
Core Views:
1) Macroeconomic Environment: Fed's hawkish dominance puts pressure on precious metals.
The first FOMC meeting under Warsh's leadership sent a strong hawkish signal, while U.S. Treasury yields remain high. Coupled with limited imports from India and weak retail sales in China, other demand sectors are temporarily retreating, leading to a 22% drop in gold prices since the end of February.
2) Core Logic: ETFs regain marginal pricing power over gold.
With central bank and physical demand intensity waning, rate-sensitive ETFs are becoming marginal sellers. The negative correlation between gold prices and U.S. Treasury yields has significantly returned, with sensitivity now higher than before 2022, closely tracking the Fed's movements in the short term.
3) Gold: Short-term range fluctuations, long-term resilience remains.
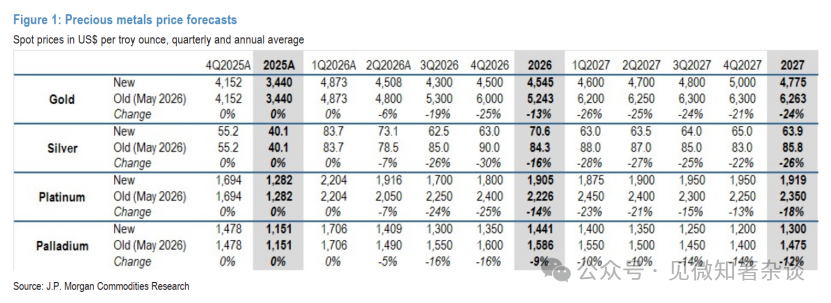
The baseline forecast for average prices in 3Q26 is $4,300, and in 4Q26 is $4,500. Despite short-term suppression by hawkish sentiments and the risk of falling below $4,000, the fundamental logic for central banks buying gold hasn't changed, with an expected recovery in the upward trend by 2027.
4) Silver: Photovoltaic demand collapses, asymmetric volatility reversal.
Silver demand in the photovoltaic sector is expected to drop by 30% this year, shifting the market from shortage to balance, weakening price support. Volatility characteristics have reversed from previously "following up but not down" to "following down but not up," with the gold-silver ratio continuing to rise.
5) Other Precious Metals: Platinum has a cost floor, palladium adjusts with sectors.
Platinum is close to the $1,600 cost line for South African mining companies, with limited downside potential, poised to rebound after gold stabilizes. Palladium, however, is relatively weak due to the substitution effect from electric vehicles, relying on an expanding platinum-palladium price gap to support demand.
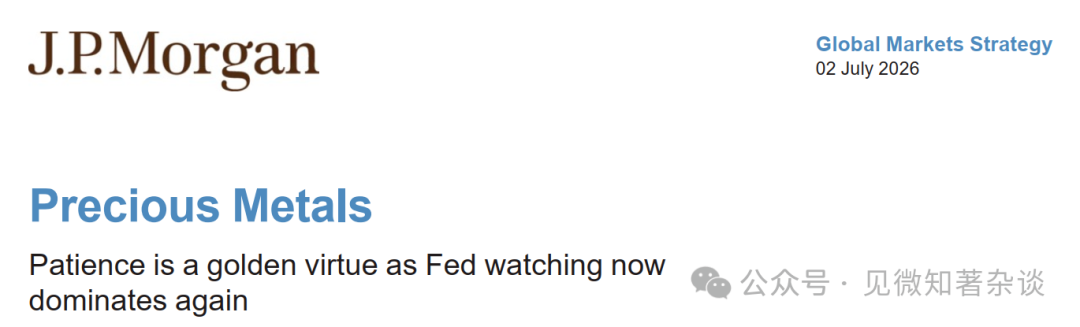
Patience is the golden virtue of the moment: The Fed's direction reigns supreme.
· As buying pressure from other demand sectors temporarily weakens, rate-sensitive ETF flows regain marginal pricing power in gold, re-establishing the negative correlation between gold prices and real yields.
· Although we ultimately believe the Fed will maintain stronger patience this year, preventing a sustained significant drop in gold prices from current levels and laying the foundation for rebounds in the second half of 2026 (2H26), the downward revision of demand expectations indicates that short-term gold benchmarks will be more range-bound—we anticipate an average price of $4,300 per ounce in 3Q26 and $4,500 per ounce in 4Q26.
· In the short term, although gold has shown an encouraging rebound from the $4,000 per ounce level, the risks associated with this baseline scenario remain skewed to the downside: if economic data for the remainder of the summer exceeds expectations, it could prompt the Fed to raise rates sooner.
· Nevertheless, we maintain a long-term bullish outlook for gold. As the fundamental logic supporting central bank structural purchases of gold and physical demand remains unchanged, we expect gold prices to recover further in 2027, at which point central bank and physical demand will strengthen again.
· Silver is continuing to diverge from the tight spot market that significantly outperformed gold last year. Overall, we believe this transition will drive the gold-silver ratio further toward normalization to around 70 in the second half of 2026, about 75 in 2027, therefore the average price of silver during our covered forecast period will be in the range of $60-65 per ounce.
· Current platinum prices are around $1,600 per ounce, near the critical fundamental incentive level we believe is crucial for South African supply stability. As gold stabilizes in the second half of 2026, we expect platinum to also find a more solid bottom, rising to $1,800 per ounce by the end of 2026 and reaching $1,950 per ounce by the end of 2027.
I. Review of Core Views
In previous reports, we predicted that as the U.S.-Iran conflict resolves and the Strait of Hormuz reopens, the tail risks of energy and inflation would dissipate, serving as a catalyst to reignite investor demand and drive gold back up.
Although the U.S.-Iran understanding memo initially did indeed promote a rebound in the precious metals sector, this relief was short-lived—during the first FOMC meeting under Chairman Warsh, it sent an unequivocally hawkish signal, severing the current link between energy prices and interest rates/dollar.
A typical case is that oil prices have returned to pre-conflict levels, but U.S. 2-year and 10-year real yields are still about 160 basis points and 55 basis points higher, respectively, leading to a 22% drop in gold prices since the end of February.
The focus has shifted back to the Fed's direction. Against the backdrop of weakened buying power from other demand sectors, rate-sensitive ETF flows have regained marginal pricing power in gold, establishing a negative correlation between gold prices and real yields. This means that before the Fed's hawkish tendencies significantly fade, gold prices will be subject to some pressure.
Although we ultimately believe the Fed will maintain stronger patience this year, preventing sustained substantial declines in gold prices from current levels and laying the groundwork for a rebound in the second half of 2026, the downward revision of demand expectations means that short-term gold benchmarks will be more range-bound—with an average price of $4,300 per ounce in 3Q26 and $4,500 per ounce in 4Q26 (see Figure 1).
In the short term, despite an encouraging rebound driven by weaker-than-expected job growth in June from the $4,000 per ounce level, the risks associated with this baseline scenario remain skewed to the downside: if economic data for the remainder of the summer exceed expectations, it may prompt the Fed to raise rates sooner.
Nevertheless, we maintain a long-term bullish outlook for gold. As the structural central bank purchases and physical buying strengthen again (the long-term themes supporting this accumulation trend have not changed substantively), we anticipate further recovery in gold prices in 2027.
Figure 1: Precious Metal Price Forecast
II. Current Focus Returns to Fed Direction
Since March, gold prices have firmly reconnected with real yields (see Figure 2). We believe this is not only due to fluctuations in energy prices and the new Fed chair/hawkish shift making rates a more core focus but also reflects the current low activity level in the gold market—marginal pricing power has shifted again.
Figure 2: 60-day Rolling Correlation of U.S. 10-Year Real Yields and Gold Prices
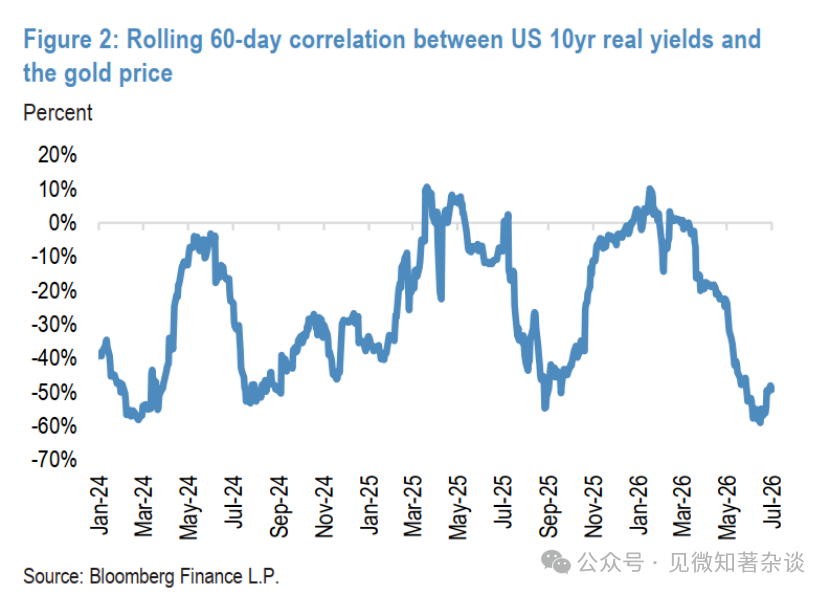
Figure 3: Global Gold ETF Holdings vs. U.S. 10-Year Real Yields
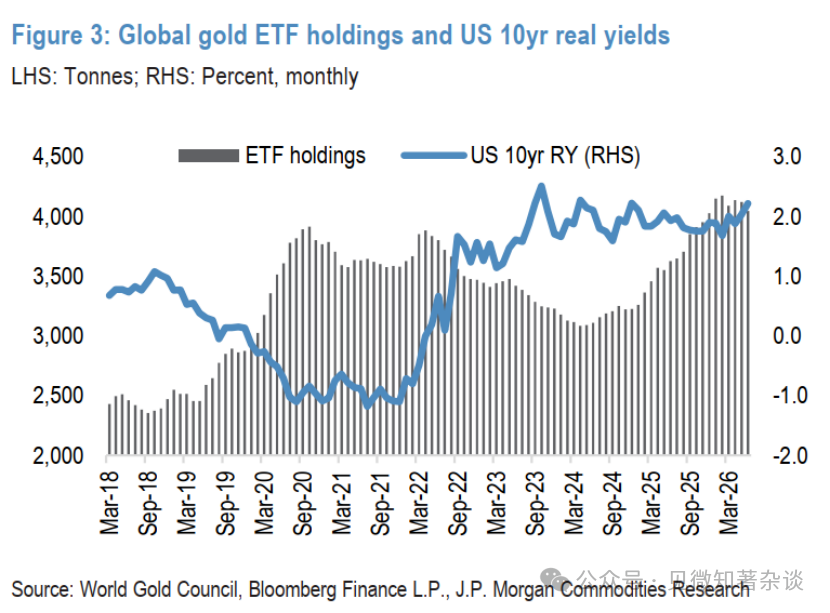
Before 2022, gold prices were closely and neatly negatively correlated with U.S. real yields. This was primarily due to rate-sensitive demand sectors (ETF holdings, futures investors) dominating the marginal funds flow into gold. At that time, central bank and retail bar and coin demand were relatively stable, while ETFs were mainly driven by Western investors—sensitive to the opportunity cost of holding non-yielding gold (relative to TIPS).
From 2022, gold prices decoupled from real yields, not because ETF holders and futures investors changed their behavior, but because during the Fed's rate-hiking cycle, real yields soared, prompting them to sell gold (see Figure 3). The real reason was that central bank demand suddenly surged, enough to offset this outflow, initially driving the decoupling—ETF holders lost marginal pricing control, supporting gold prices.
From the initial decoupling to March this year, central bank demand has continuously strengthened, and gold prices generally lack stable correlation with real yields. After real yields peaked in 2024, the outflow of ETFs became neutral, allowing gold prices to rise before a larger depreciation trade in 2025, spurring momentum and significantly boosting physical and retail gold demand across various products (including substantial growth in Asian ETF holdings).
Figure 4: Gold Premium/Discount in China and India
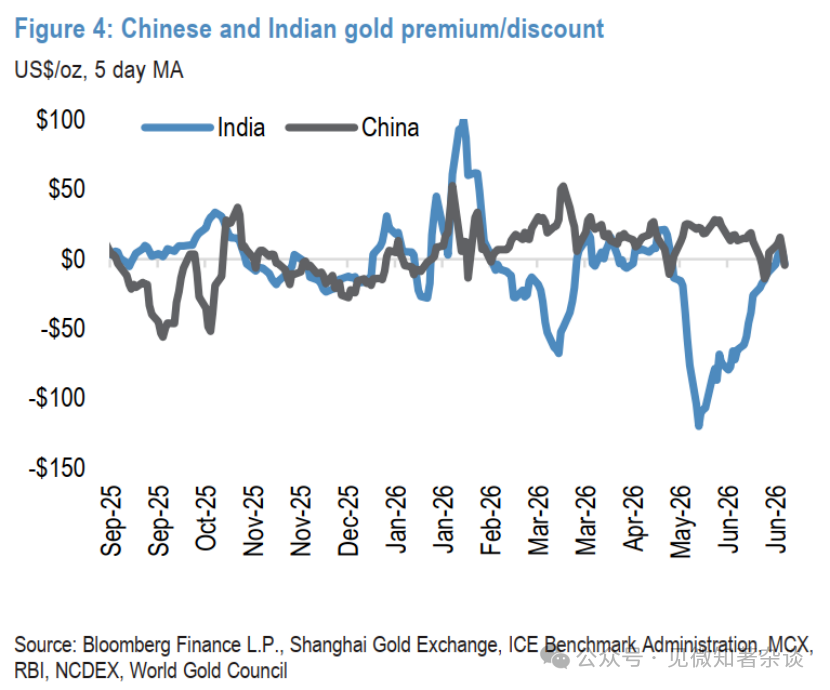
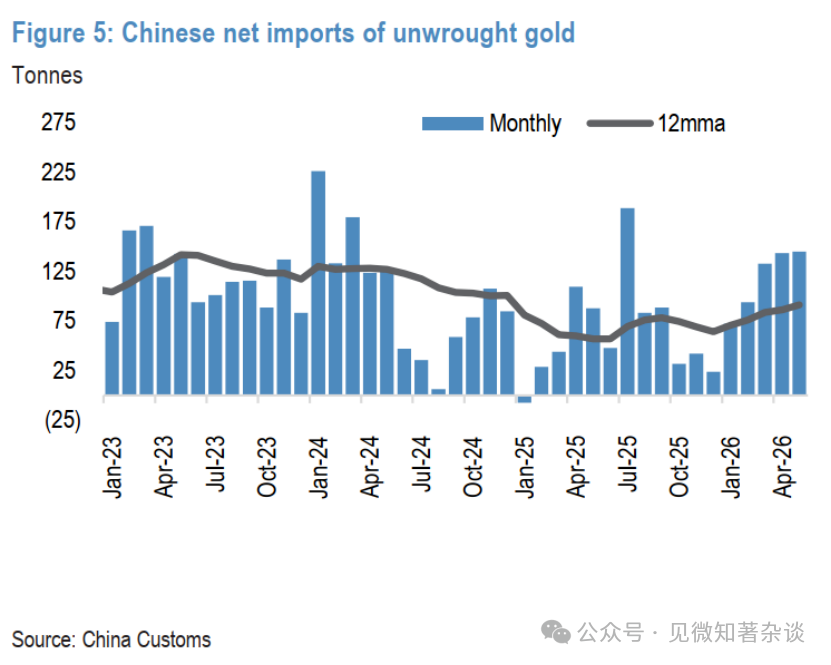
Figure 5: Net Gold Imports in China
ETF flows are now back at the helm of gold price. Initially sparked in March by the geopolitical conflict between the U.S. and Iran, this was followed by a general stagnation in demand from other sectors.
On the physical front, in order to protect external accounts under the pressure of energy prices, India has implemented higher tariffs and import restrictions, severely curtailing demand. Even in China, weak domestic premiums reflect extremely lackluster retail demand (see Figure 4).
Central banks returned as net marginal buyers in April and May, but their buying intensity still appears more cautious. While Chinese gold imports remain strong (coupled with weak domestic retail demand, possibly indicating more official accumulation), central bank demand has not fully unleashed its potential, temporarily losing its past breadth (see Figure 5).
Investors (including retail) have currently postponed their depreciation trades, partly due to Warsh reaffirming the goal to pull inflation back, turning their attention to other themes like storing chips, leaving the precious metals sector almost unnoticed.
Figure 6: Global Gold ETF Weekly Fund Flows vs. Gold Prices
Vertical Axis: Average Gold Price per Week (USD/Ounce); bubble size indicates scale of inflows (green)/outflows (red)
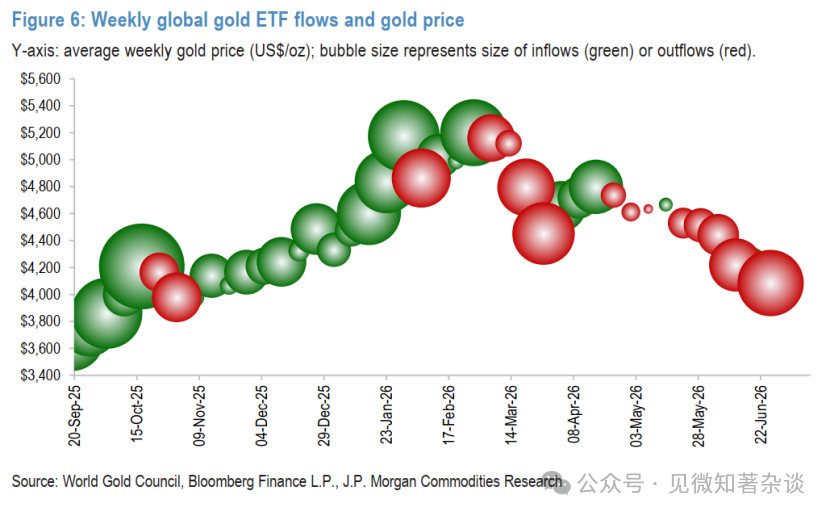
The overall dormancy in other demand sectors has effectively made outflows from rate-sensitive ETFs the main marginal sellers. With this shift, real yields have again taken the driver's seat of gold prices (see Figures 6 & 7). Moreover, this reconnection is very intense—real yield increases have a greater impact on prices than can be inferred just from ETF tonnage outflows.
Since the end of February, global ETF holdings have seen a net outflow of approximately 128 tons (-3%), aligning closely with the historical relationship corresponding to a rise in U.S. 10-year real yields of about 50 basis points during the same period (see Figure 8). Recent quarterly relationships between changes in gold demand and price fluctuations show that this outflow alone could lead to a price drop of about 4% (holding other conditions constant).
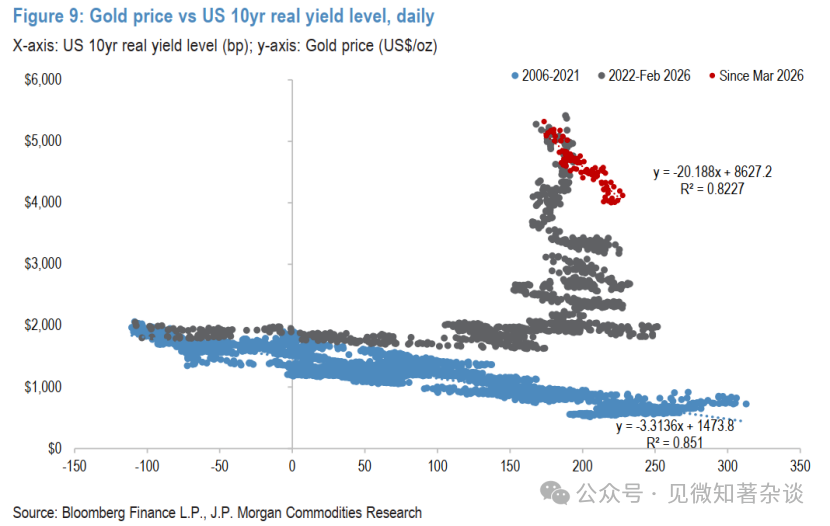
However, since the end of February, for every 1 basis point increase in U.S. 10-year real yields, gold prices have declined by nearly $20 per ounce (0.4-0.5%), with a cumulative drop exceeding 20%—even when accounting for base differences using percentage calculations, this negative correlation is more intense than the mechanism observed before 2022 (see Figure 9).
Of course, other conditions never remain completely unchanged. This heightened price response also reflects the investor deleveraging from March, sporadic central bank selloffs, and a general retreat of retail enthusiasm.
Even after that, this increased rate sensitivity continues to reflect the sluggish state of demand in other sectors, amplifying the impact of real yields and ETF reductions.
Figure 7: Global Gold ETF Weekly Fund Flow (in tons)
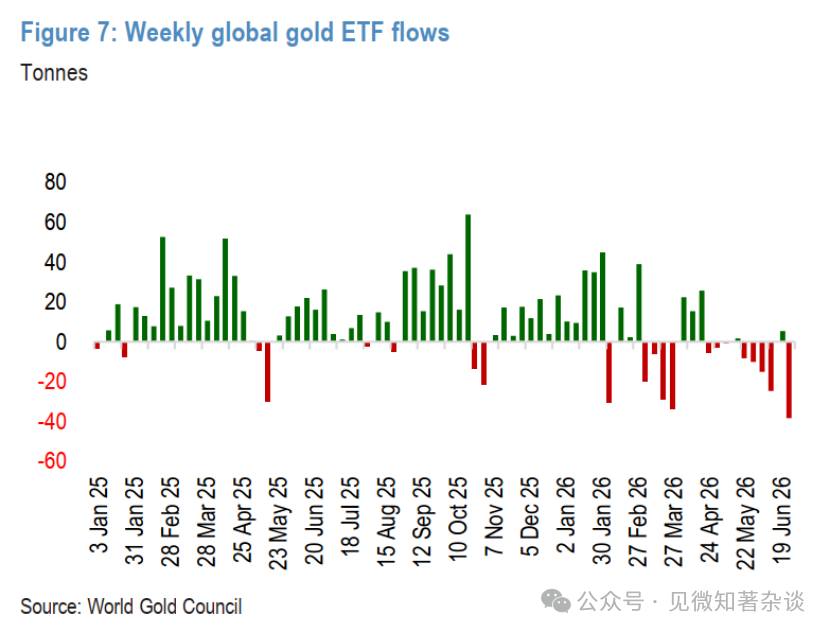
Figure 8: Changes in Global Gold ETF Holdings vs. Changes in U.S. 10-Year Real Yields (quarterly)
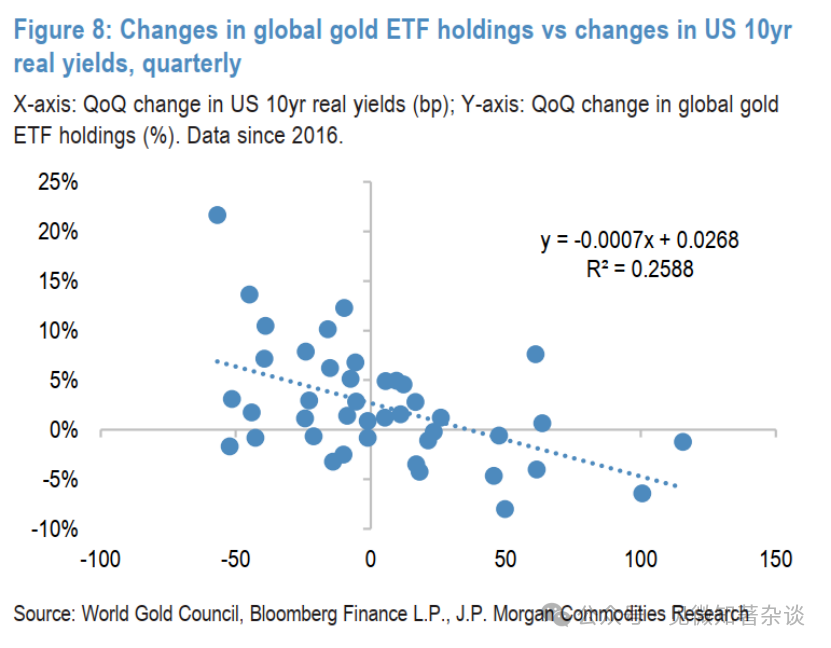
Figure 9: Gold Prices vs. U.S. 10-Year Real Yield Levels (daily)
III. Gold Outlook: Patient Fed Will Eventually Provide Stronger Support, But Upside Limited Before Clear Dovish Shift
Before the Fed's hawkish tendencies diminish, gold prices will be under pressure. With U.S. Treasury yields back at the helm, unless demand from other sectors (central banks, retail, private banking, Asian physical demand) strengthens again (which requires time, new catalysts, and/or lower gold prices), the outlook for gold will once again heavily depend on the Fed in the coming months.
Following the first FOMC meeting under Warsh's leadership, the OIS forward market has now priced in almost one rate hike within this year and a cumulative increase of nearly 40 basis points by April 2027. This is earlier and more aggressive than JPM's baseline forecast (no rate hikes in 2026, first rate hike in the third quarter of 2027).
Despite ultimately believing the Fed will maintain patience this year, preventing gold prices from experiencing sustained significant declines from current levels and paving the way for rebounds, this macro/rate setup will likely continue to suppress gold to lower ranges.
The question for gold is: even if the Fed does not raise rates as the current market pricing suggests, given the recent momentum in the U.S. labor market and the Fed's stronger anti-inflation intentions, the upward slope of the OIS curve (indicating the next action is priced as a rate hike) may be more stubborn.
Additionally, the middle of the U.S. Treasury curve currently underestimates the risks of a moderate tightening—10-year yields are over 20 basis points lower than what models imply as fair value. Thus, unless employment or inflation data weakens dramatically, the market will continue to push back expectations for the Fed's next rate hike without significantly diminishing the tendency to hike.
Weak data may provide some mild relief for gold prices through yield stagnation and slight declines, but this persistent upward slope will continue to restrict ETF holdings and suppress broader investor demand for gold until there is a more significant and sustained shift in the macro landscape.
Combining the latest predictions for U.S. Treasury real yields, we expect global gold ETFs will see a net outflow of about 50 tons this year (as of June 26, holdings have still increased by about 19 tons year to date)—a significant reduction compared to the previously anticipated inflow of about 400 tons.
Furthermore, while we still expect central bank purchases (once energy risks dissipate, defensive portfolio allocations will gradually diminish) and Asian bar/coin demand (with the eventual lifting of import restrictions leading to pent-up demand) to strengthen by the end of the year, due to a pause in buying intensity mid-year, we are downgrading the global central bank net purchases for 2026 to 600 tons (previously 640 tons), and the year-on-year growth rate for global bar and coin demand to 3.6% (previously 10%).
In summary, these demand forecasts point to gold's short-term recovery being more range-bound: average prices of $4,300 per ounce in 3Q26 and $4,500 per ounce in 4Q26—approximately 20-25% lower than previously expected. While an unexpected clear dovish shift from the Fed remains an upside risk, the risks for the current baseline scenario still lean to the downside: if future data runs too hot, gold prices may continue to decline (see the risk section below).
Nevertheless, we maintain a long-term bullish outlook for gold. We do not believe the theme of depreciation is dead, just significantly masked at present.
We ultimately expect gold prices to recover further in 2027, as the structural central bank and physical buying regain strength. But the intensity of the rebound has been suppressed: gold needs a more explicit dovish shift from the Fed to reignite demand and accelerate the momentum of the long-term upward trend.
IV. Short-Term Risks Still Skewed to the Downside
JPM's baseline for the Fed is no rate hikes, lagging behind the curve, but there is limited tolerance for errors, presenting a real risk of an earlier rate hike. While waiting for every piece of employment and inflation data, gold's short-term risk is skewed to the downside relative to the baseline scenario.
In the absence of the new chair’s willingness to provide forward guidance or transparency in policy response functions, if data pressures the Fed to hike rates earlier, the market may reference mid-cycle rate-hike adjustments from previous cycles.
Our rate strategists believe that the 1999-2000 cycle is the closest to the current situation, suggesting the Fed might hike rates by about 50-100 basis points, corresponding to a further increase of 50 basis points in mid-term U.S. Treasury yields. If the market drastically re-prices to this scenario, it could push gold prices significantly below $4,000 per ounce, triggering further technical breakdowns, pointing to levels of $3,500-$3,600 per ounce.
In addition to purely bearish risks surrounding the Fed, we are also aware of the potential resistance from a stronger dollar. Currently, our forex strategists are seeing signs of the resurgence of American exceptionalism. The major risk for gold is that: the use of AI as a geopolitical lever could exacerbate the divergence between the U.S. and other regions, supporting a further strengthening of the dollar in the second half of 2026.
V. Gold Still Sets the Tone for Other Precious Metals
Downgrading gold forecasts has also fed into our outlook for other precious metals.
1) Silver
Silver’s daily direction will continue to closely follow gold. However, better physical supply will tilt silver’s volatility downward from still relatively high valuation levels this year. Last year, the illiquid tight spot market allowed silver to significantly outperform gold during gold's rise.
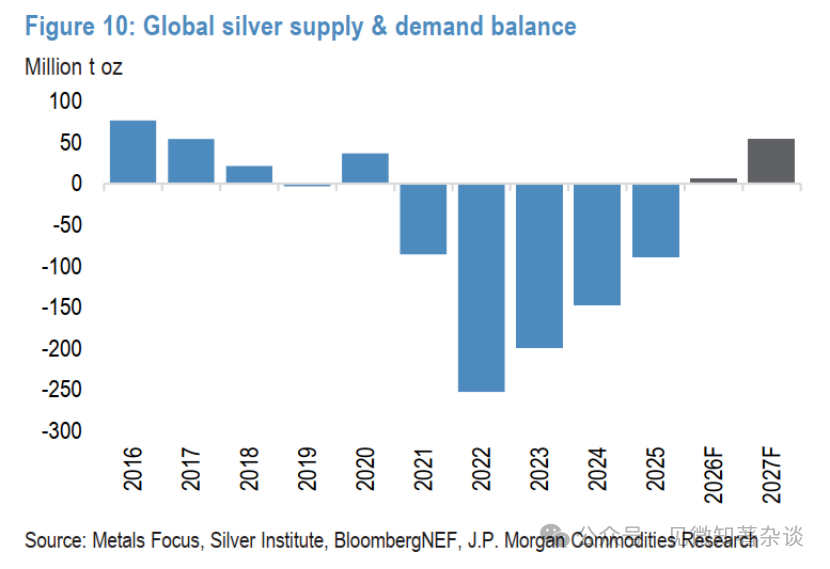
Our fundamental view on silver remains unchanged: we still expect silver demand in the solar sector to decline by about 30% this year (a year-on-year decrease of approximately 60 million ounces), meaning that after five consecutive years of shortages, this year’s silver market (excluding inventory or ETF fund flows) will trend toward balance, with a slight surplus next year (see Figure 10).
Therefore, the significant relief in physical tightness from high valuations of silver will continue to tilt its volatility downward. In other words, this creates a backdrop where, on days when gold declines, silver will experience greater drops—contrary to last year’s asymmetry (when silver outperformed on rising days).
Overall, this will drive the gold-silver ratio further toward normalization to around 70 in the second half of 2026, around 75 in 2027, with silver prices during our forecast period averaging between $62-65 per ounce.
Figure 10: Global Silver Supply and Demand Balance
2) Platinum
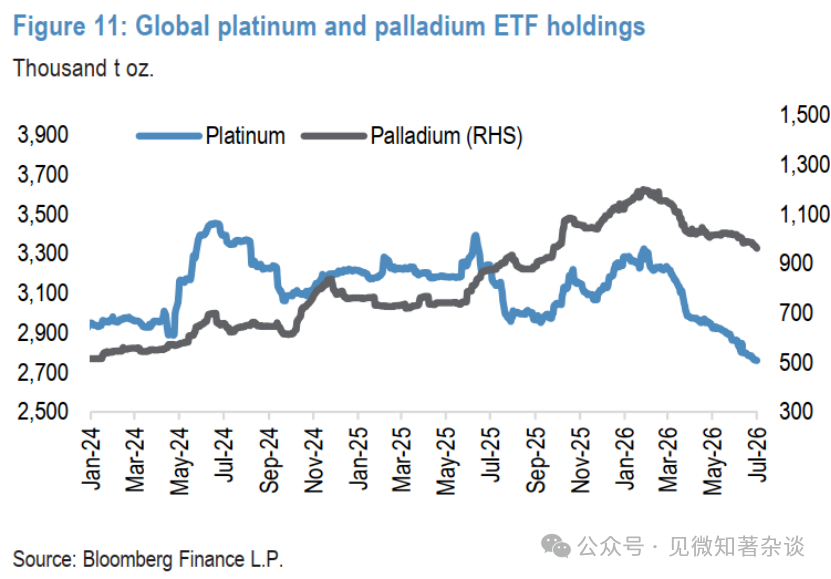
Platinum is expected to rebound from around $1,600 per ounce, as gold stabilizes. Similar to gold, platinum and palladium have also faced severe ETF sell-offs, providing ample metal to the spot market and intensifying the decline in sync with gold (see Figure 11).
Although both metals each have their basic characteristics, the overall momentum of gold remains the primary driver of pricing across the entire precious metals sector.
Ultimately, we believe that gold must first stabilize and rebound for platinum group metal prices to find a firmer bottom.
Current platinum prices are around $1,600 per ounce, nearing what we consider the important fundamental incentive level. If it falls below $1,600 per ounce, we believe the risks will rise again: necessary supply investments in South Africa may not materialize, leading to more severe and longer-lasting tension in the market.
As gold stabilizes in the second half of 2026, we expect platinum to also find a more solid bottom, rising to $1,800 per ounce by the end of 2026 and reaching $1,950 per ounce by the end of 2027.
Palladium forecasts are also adjusted downward along with the sector.
We still believe that the expansion of the platinum-palladium price gap is fundamentally necessary to continue accelerating the substitution trend, which would support palladium demand against the backdrop of encroaching demand from electric vehicles, avoiding a significant market oversupply.
Accordingly, we predict that palladium will rebound to $1,350 per ounce by the end of 2026, but will be limited in its upward movement in 2027, averaging around $1,300 per ounce for the year.
Figure 11: Global Platinum and Palladium ETF Holdings (thousands of ounces)
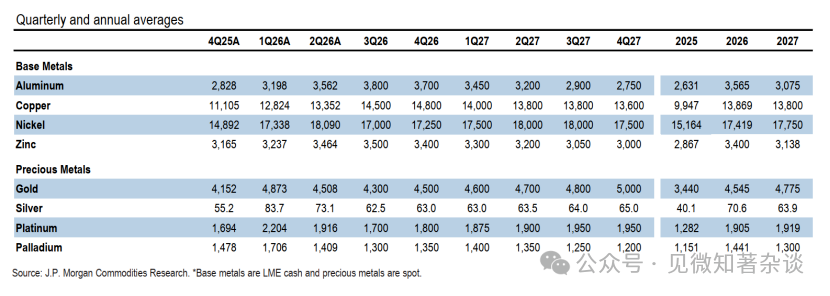
VI. J.P. Morgan Metal Price Forecast
免责声明:本文章仅代表作者个人观点,不代表本平台的立场和观点。本文章仅供信息分享,不构成对任何人的任何投资建议。用户与作者之间的任何争议,与本平台无关。如网页中刊载的文章或图片涉及侵权,请提供相关的权利证明和身份证明发送邮件到support@aicoin.com,本平台相关工作人员将会进行核查。


