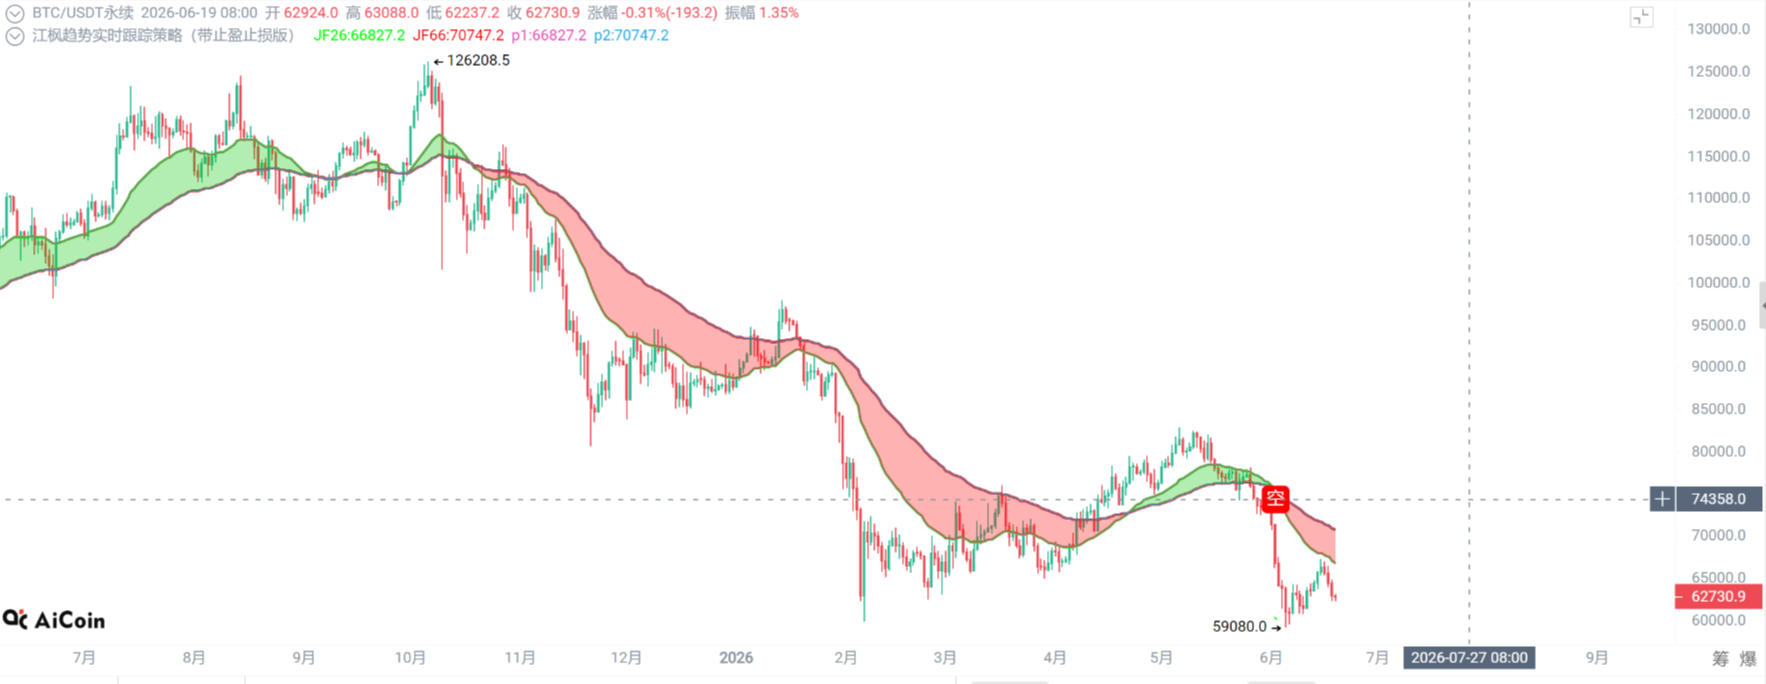
Dear friends, I am Sister Qinglan. This morning when I opened the market, I saw BTC dropped below 63,000 dollars, causing panic in the market. In the focus news, there are two things particularly worth noting: first, after the FOMC meeting, Bitcoin again fell below 63,000 dollars; second, the sharp drop in the crypto market led to 180 million dollars in liquidation within one hour. This wave of decline is not an isolated event, but a result of the resonance between macro sentiment and capital markets. But don’t panic, the data tells us that the bottom often brews in despair. Long-term holders are holding an all-time high in positions, and selling pressure is exhausted, which is a classic signal of a bear market bottom. Today, we will use the Qinglan TPV system to gradually analyze the current market and find trading opportunities.
Current Price and Time
The current time is June 19, 10:41, and the price of BTC is reported at 62,924 USDT. The 24-hour drop is 2.41%, and the fear and greed index is only 15, which falls under extreme fear. At this position, many people dare not look, but Sister Qinglan wants to remind you that fear often means opportunity. We need to look at the multi-timeframe status to determine the direction.
Multi-Timeframe Status Overview
On the daily level, MA5 is at 64,479, MA10 at 64,131, and MA30 at 68,230, with prices dropping below all short-term moving averages. The MACD's DIF is -2,400.71, DEA is -2,821.78, and the histogram is 421.08; although the bars are shortening, both DIF and DEA are still below the zero axis, indicating a clear bearish trend. The RSI is 57.32, in the neutral and slightly weak area. The daily chart is overall bearish, but the shortening of the histogram suggests that the downward momentum may be exhausting.
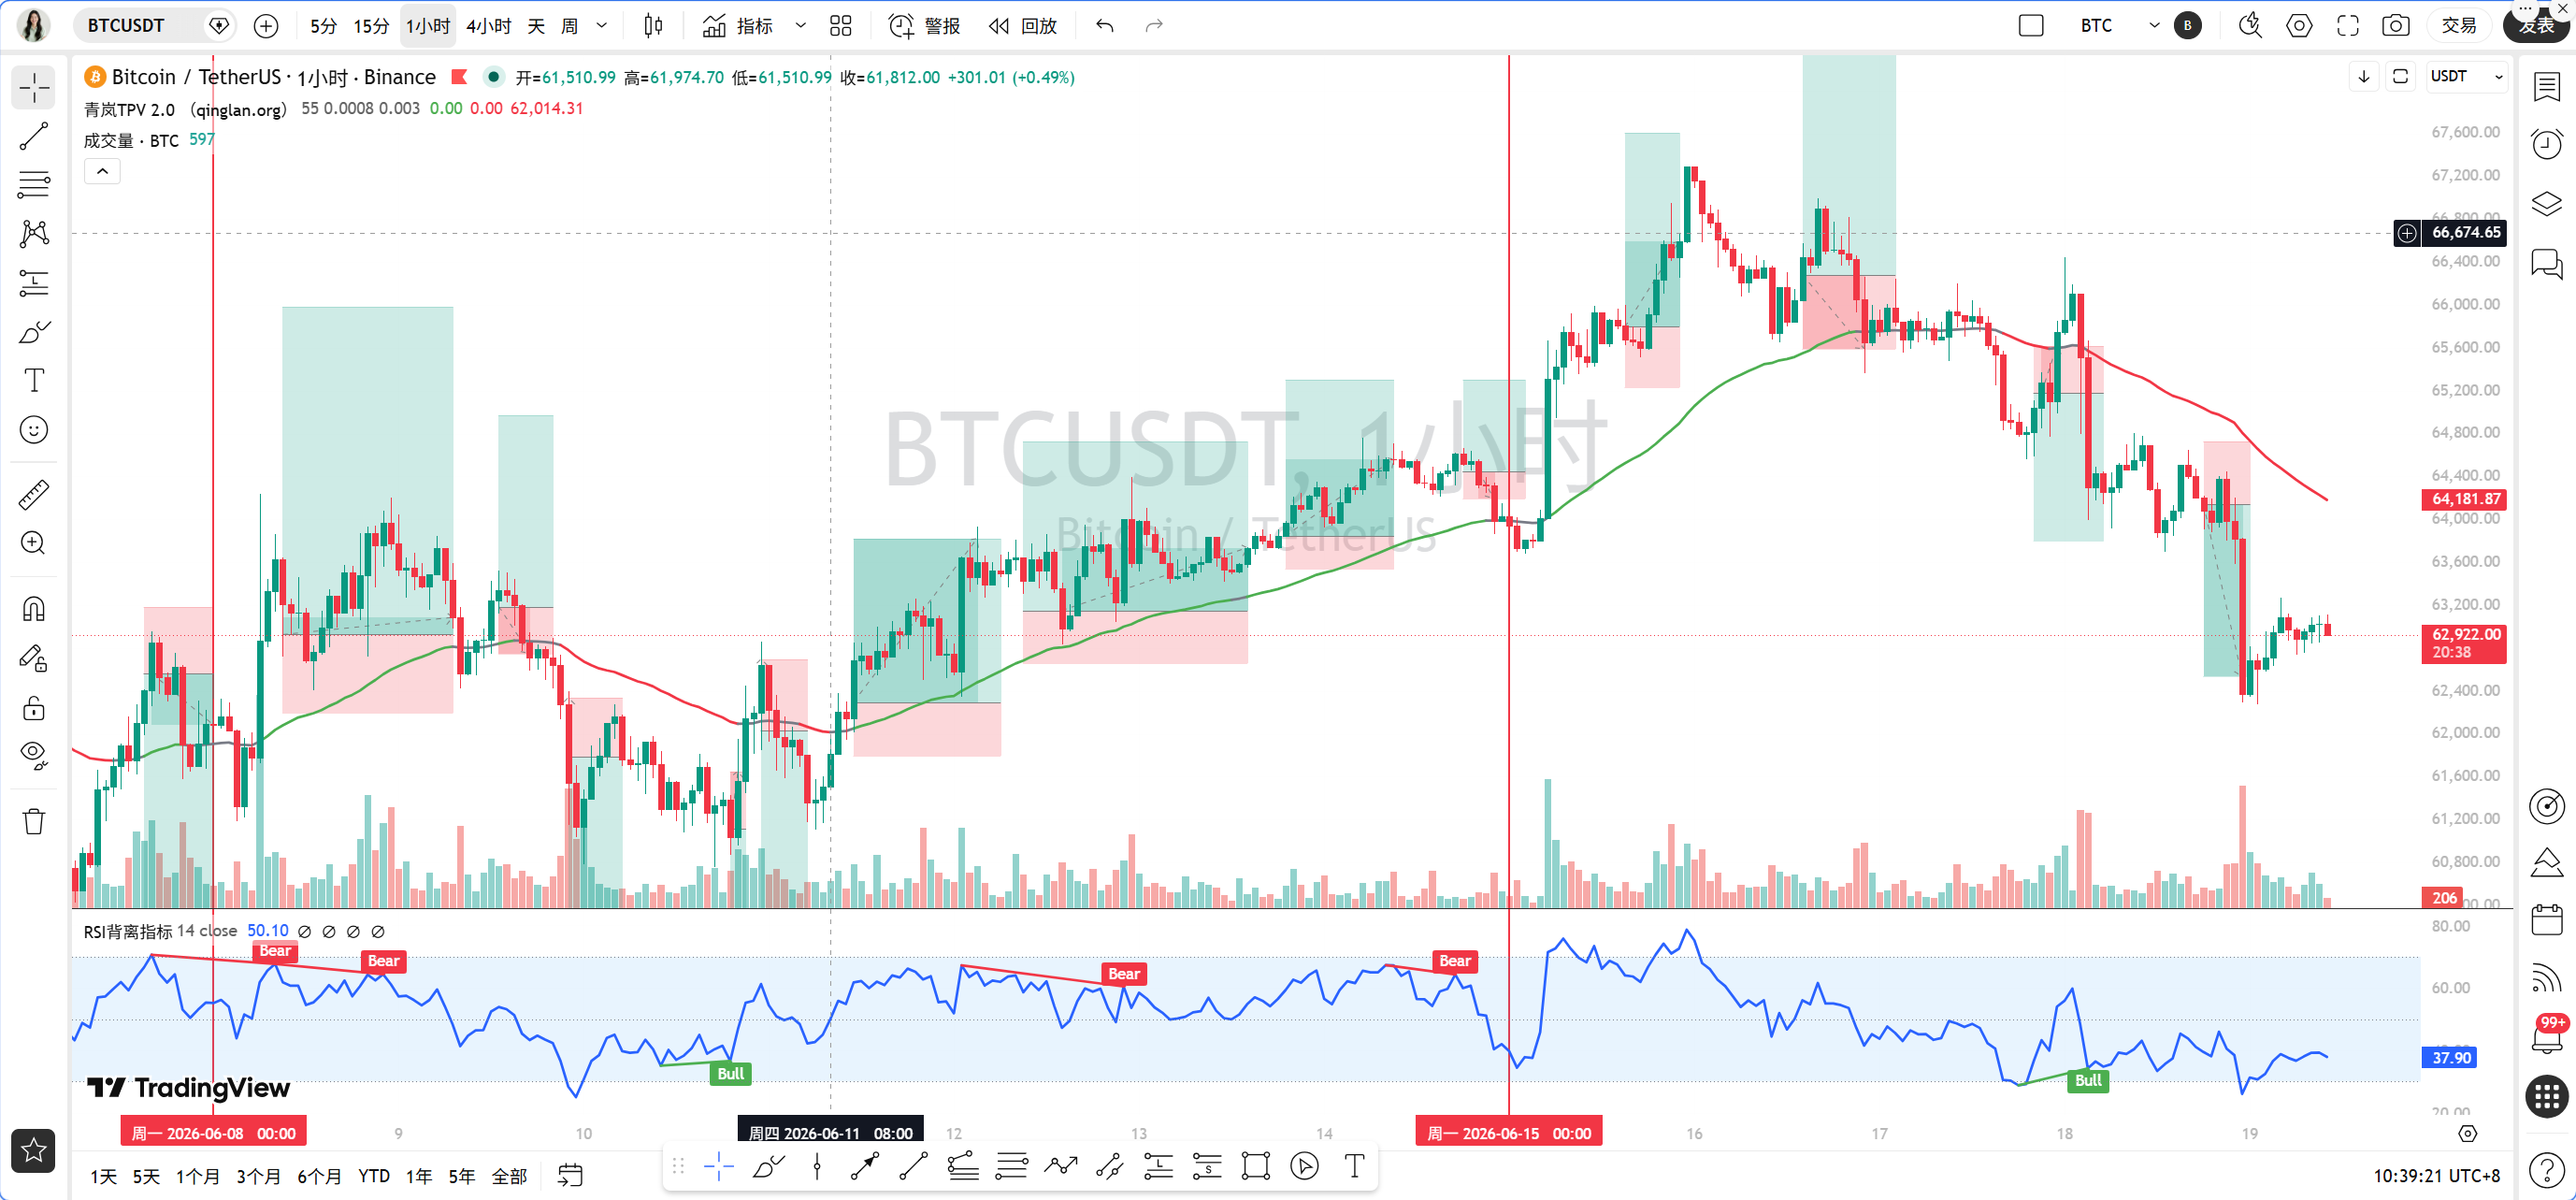
On the 4-hour level, MA5 is at 63,035, MA10 at 63,853, and MA30 at 65,052, while the price struggles around MA5. The MACD's DIF is -510.49, DEA is -160.86, and the histogram is -349.62, and bearish momentum is still being released. The RSI is 30.45, close to the oversold area. On the 4-hour level, the price is in a low-level oscillation, but the MACD histogram is still widening in the negative, indicating that short-term bearish strength has not fully released.
On the 1-hour level, MA5 is at 62,961, MA10 at 62,913, and MA30 at 63,684, with the price oscillating in a narrow range between MA5 and MA10. The MACD's DIF is -437.02, DEA is -480.25, and the histogram is 43.23; although the histogram has turned positive, both DIF and DEA are still below the zero axis, indicating a bearish rebound. The RSI is 28.12, having entered the oversold area. On the 1-hour level, there is a rebound demand in the oversold area, but the trend remains bearish.
On the 15-minute level, MA5 is at 62,967, MA10 at 62,979, and MA30 at 62,953, with prices entangled near the moving averages. The MACD's DIF is -8.49, DEA is -19.89, and the histogram is 11.39, indicating weak bullish momentum. The RSI is 59.76, leaning towards strong neutral. On the 15-minute level, there are signs of short-term stabilization, but the strength is insufficient.
To summarize: the daily and 4-hour charts are dominated by bears; the 1-hour and 15-minute charts have oversold rebound demand, but the overall trend is downward. We need to use the TPV system to verify whether an entry signal appears.
TPV Signal Verification
According to the Qinglan TPV system, we first use the 1-hour EMA55 as the dividing line for long and short. The current EMA55 is at 64,260.11, while the price of 62,924 is far below EMA55, with a margin of 2.08%, falling into the bearish trend area. Oscillation auxiliary data shows that among the last 8 one-hour K-lines, the closing price greater than EMA55 is 0, crossing frequency is 0, which does not meet the oscillation conditions, so it is currently a unidirectional bearish trend.
Short Selling Condition Verification: First, prices are pressured below 1-hour EMA55. The closing prices of two consecutive one-hour K-lines are less than EMA55, satisfying this condition. Second, the pressure meets resistance. We see on the 1-hour K-line that there are long upper shadows in the 63,000-63,200 range, indicating heavy selling pressure above. Third, the bounce is weak. Although the 1-hour MACD histogram has turned positive, both DIF and DEA remain below the zero axis, and the RSI rebounded from 28.12, but the strength is weak and fails to form a bullish engulfing. Therefore, some short selling conditions are met, but we need to wait for clearer signals.
Long Buying Condition Verification: First, prices need to stabilize above the 1-hour EMA55, which does not satisfy this condition. Second, support stabilizes. The 15-minute level has a bottom divergence, but the 1-hour level lacks long lower shadows or volume stagnation. Third, the downward momentum weakens. The 1-hour MACD histogram has shortened for two consecutive cycles, but RSI rebounded from 28.12, indicating an oversold rebound and not a genuine weakening of momentum. Therefore, long buying conditions are not met.
Comprehensive Judgment: Currently in a bearish trend, but oversold rebounds may bring short-term oscillation. It is not recommended to actively go long or short; wait for clearer signals.
On-Chain/Fundamentals
In terms of on-chain data, the fear and greed index is 15, indicating extreme fear; historically, this position often corresponds to a temporary bottom. Long-term holders are holding an all-time high in positions, and selling pressure is exhausted, which is a favorable signal. However, the dollar against the yen soared to 161.40, and the strong dollar suppresses risk assets. ETH has lost 1,700 dollars, increasing market selling pressure. Whales shifted from short positions to long after liquidation, indicating that some funds are bottom-fishing, but the momentum is limited. Overall, the capital side is bearish, but long-term holder data suggests that the bottom may not be far off.
Key Support and Resistance Levels
The first resistance level above is the 1-hour EMA55 at 64,260; this position is the dividing line for bearish. If prices rebound to here, it may encounter strong resistance. The second resistance level is the 4-hour MA10 at 63,853, which is also a short-term pressure point. The first support level below is the 62,000 psychological level; if it breaks below, it may test 60,000. The second support level is at 58,000, which is the previous low. In the short term, 63,000 is a key point in the tug-of-war between bulls and bears; if it stabilizes, it may rebound to 63,500-63,800; if it breaks down, it may accelerate the decline.
Trading Strategy
Direction: Bearish trend, but oversold rebounds may bring short-term oscillation; it is recommended to observe or lightly short.
Entry Conditions: If the price rebounds to the 63,800-64,000 range, and the 15-minute level shows long upper shadows or top divergence, a light short can be initiated. If the price breaks below 62,000, and the 1-hour closing price is below 62,000, attempts to short can be made.
Stop Loss Levels: Short stop loss should be set above 64,500; if the price breaks above the 1-hour EMA55, exit the short position. Short stop loss for chasing should be set at 62,500.
Target Levels: The first target is 61,000, and the second target is 60,000. If market sentiment worsens, it could reach 58,000.
Risk Warning
The current market is highly volatile, the fear index is very low, but the trend has not reversed; chasing shorts requires caution, light positions, and strict stop losses.
Follow the Qinglan Crypto Class for more trading opportunities! Welcome to visit the official website www.qinglan.org
📊 Qinglan TPV Trading Strategy Backtest Reference
🕒 Last backtest time 06-19 07:00:01
Total analysis: 2347 Backtest: 1838 Accuracy: 70.8% (1302/1838)
免责声明:本文章仅代表作者个人观点,不代表本平台的立场和观点。本文章仅供信息分享,不构成对任何人的任何投资建议。用户与作者之间的任何争议,与本平台无关。如网页中刊载的文章或图片涉及侵权,请提供相关的权利证明和身份证明发送邮件到support@aicoin.com,本平台相关工作人员将会进行核查。