
Written by: Token Terminal
Compiled by: Saoirse, Foresight News
Ethereum is the core underlying settlement network for on-chain assets, relying on ETH to pay transaction fees and stake to maintain network security. Traditional finance suffers from issues such as slow settlement, many intermediaries, and high counterparty risks, while tokenized assets and stablecoins offer on-chain solutions. By 2025 to 2026, related regulations will gradually mature, and institutions will have the foundational conditions to engage in on-chain business.
Various types of stablecoins, tokenized funds, commodities, and on-chain stocks are being issued and settled on Ethereum. After layer two networks divert transactions, they ultimately return to layer one for confirmation, allowing ETH to continuously accumulate value. Measured by market capitalization, Ethereum remains the world's largest platform for tokenized assets, operated by the Ethereum Foundation and the developer community, with teams like Etherealize specifically connecting with traditional financial institutions to facilitate institutional capital entry. In the first quarter of 2026, Ethereum's ecosystem showed a polarized trend, as detailed below, combined with complete data from Token Terminal.
The first quarter of 2026 exhibited a distinct two-sided market: on-chain usage reached an all-time high—monthly active users, total transaction volume, and throughput all set records; however, the asset size and fee metrics, when measured in US dollars, contracted simultaneously, which diluted total market capitalization, total locked assets, and transaction volume, with both types of fee data declining on a quarter-over-quarter basis. Key events in this quarter profoundly shaped this unique market situation:
In January, the second round of the Fusaka upgrade cycle, only the Blob parameter fork (BPO#2), landed, significantly enhancing data storage capacity;
In February, the ERC-8004 standard launched on the mainnet, becoming the universal standard for AI entities' identities and credit ratings;
The Ethereum Foundation identified three core objectives for the 2026 protocol: scalability, optimizing user experience, and strengthening layer one base security;
A forum for institutional Ethereum was held in March, with traditional financial institutions showing significantly increased participation.
Overview of Core Indicators for Q1 2026
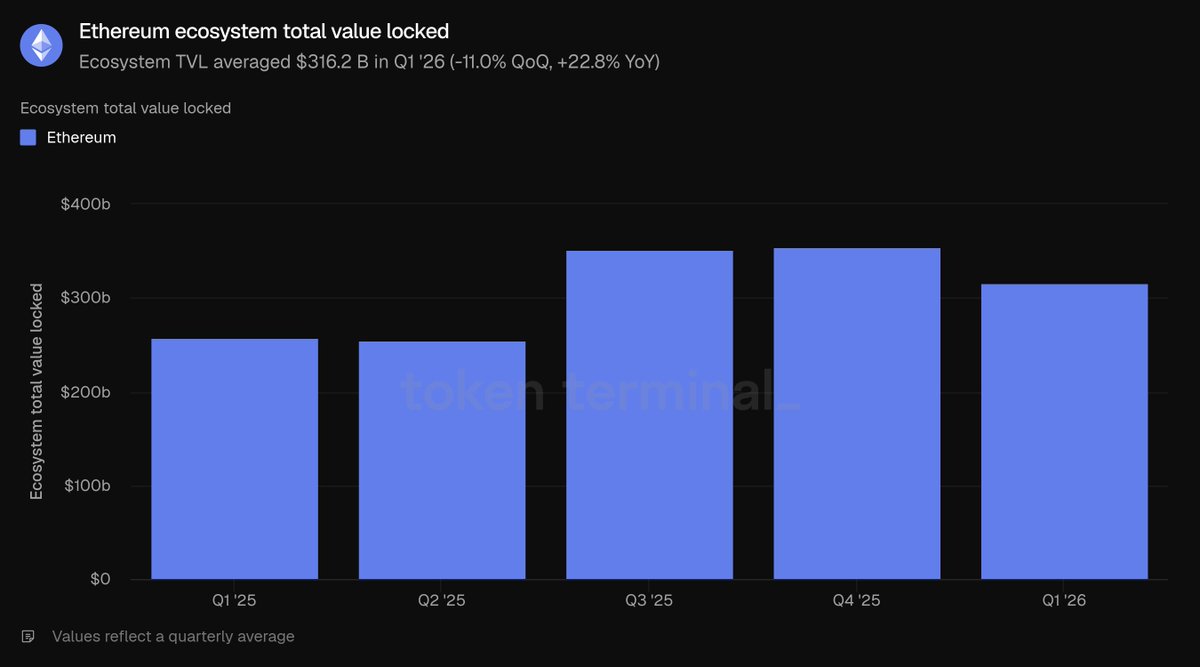
Total locked assets in the ecosystem: $316.2 billion (quarter-over-quarter -11.0%, year-over-year +22.8%)
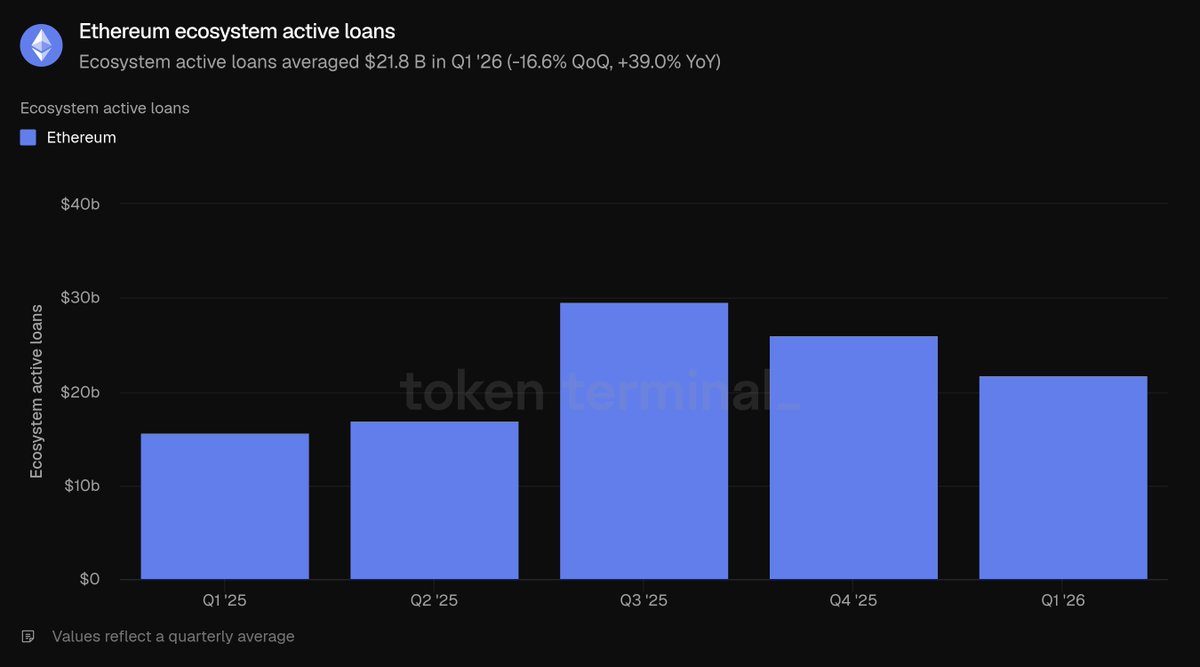
Total active loans in the ecosystem: $21.8 billion (quarter-over-quarter -16.6%, year-over-year +39.0%)
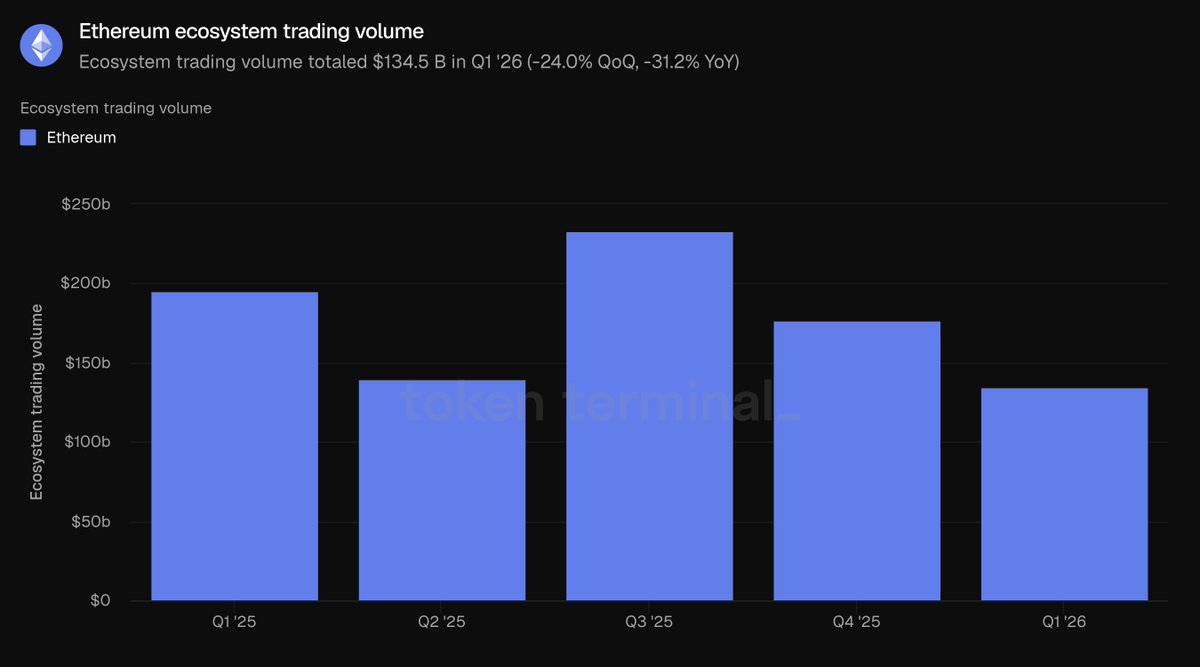
Total trading volume of decentralized exchanges in the ecosystem: $134.5 billion (quarter-over-quarter -24.0%, year-over-year -31.2%)
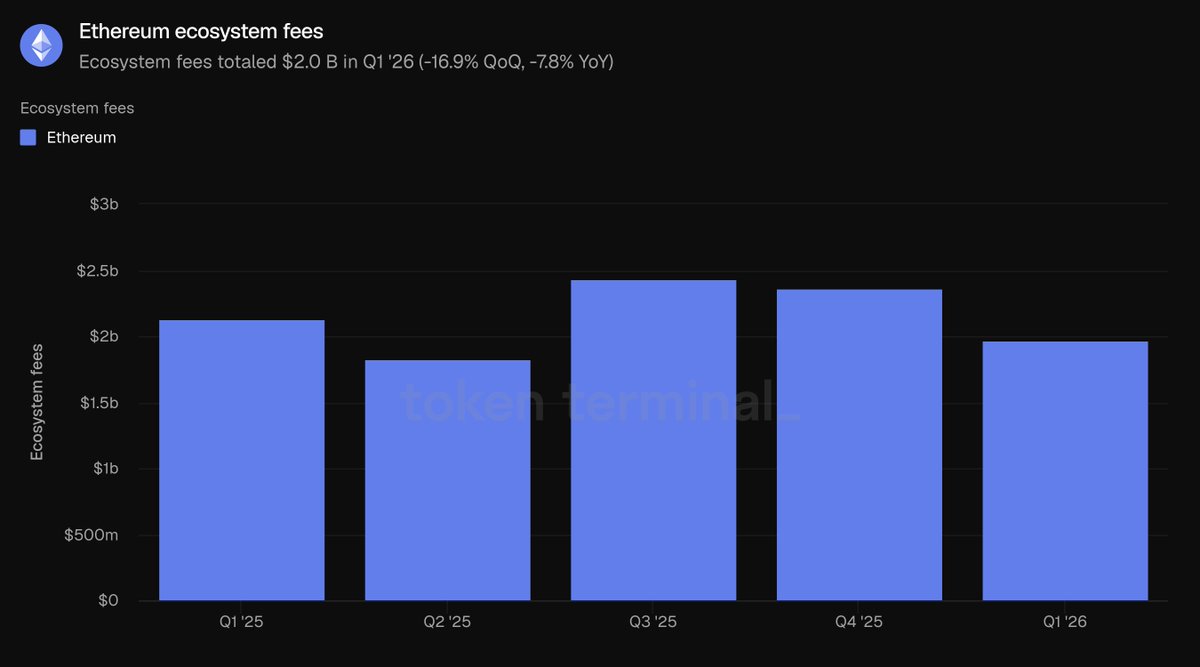
Total revenue from ecosystem application fees: $2 billion (quarter-over-quarter -16.9%, year-over-year -7.8%)
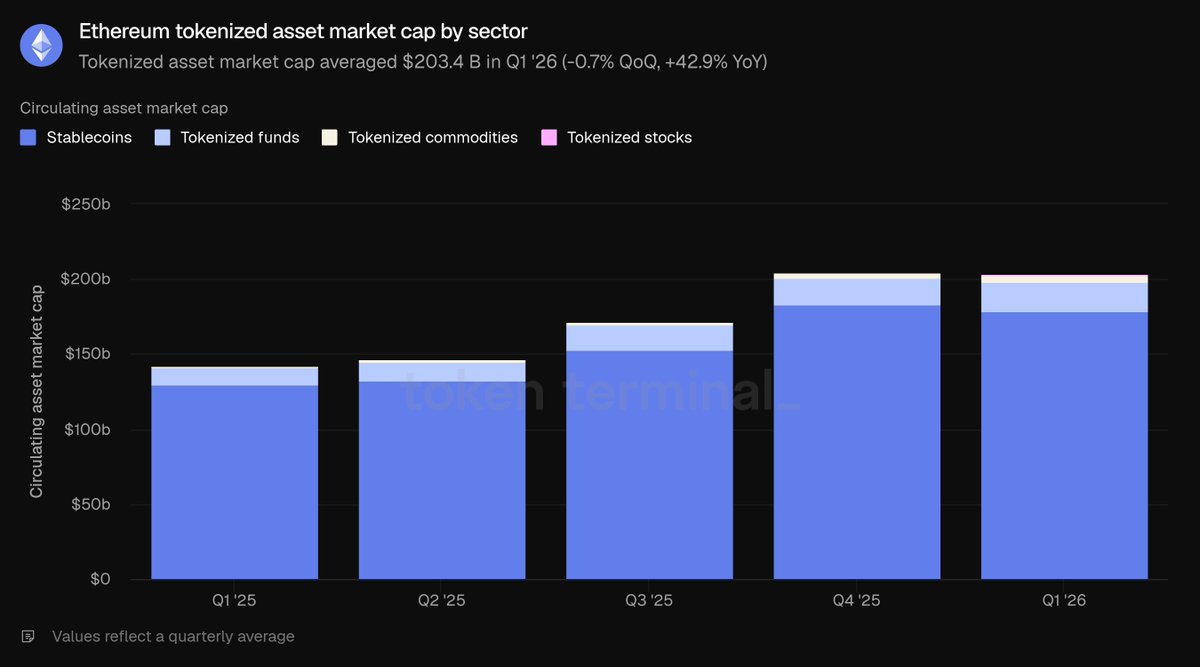
Total market capitalization of on-chain tokenized assets: $203.4 billion (quarter-over-quarter -0.7%, year-over-year +42.9%)
Stablecoins: $178.9 billion (quarter-over-quarter -2.3%, year-over-year +37.6%)
Tokenized funds: $19.4 billion (quarter-over-quarter +4.9%, year-over-year +73.1%)
Tokenized commodities: $4.7 billion (quarter-over-quarter +60.0%, year-over-year +325.9%)
Tokenized stocks: $365.1 million (quarter-over-quarter +16.5%)
Monthly active user addresses: 13.2 million (quarter-over-quarter +53.5%, year-over-year +85.9%)
Total transaction count on layer one: 200.4 million (quarter-over-quarter +38.0%, year-over-year +81.5%)
Average transactions per second: 25.78 (quarter-over-quarter +41.2%, year-over-year +81.7%)
Total revenue from layer one mainnet transaction fees: $39.9 million (quarter-over-quarter -47.9%, year-over-year -81.9%)
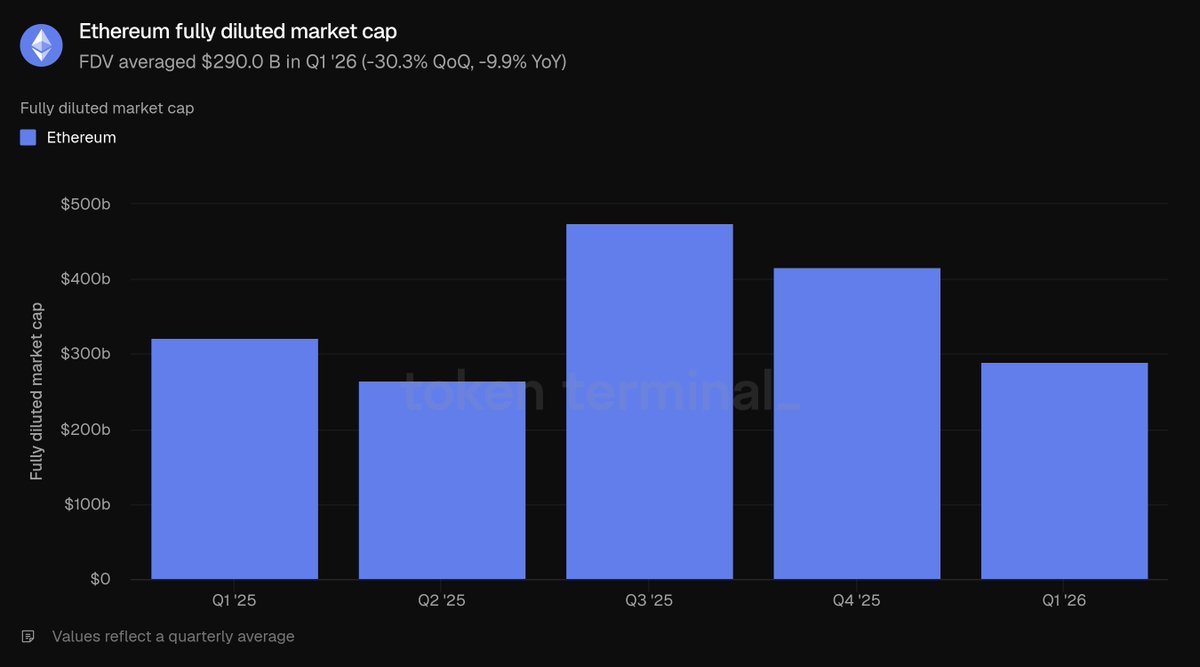
Fully diluted total market capitalization of ETH: $290 billion (quarter-over-quarter -30.3%, year-over-year -9.9%)
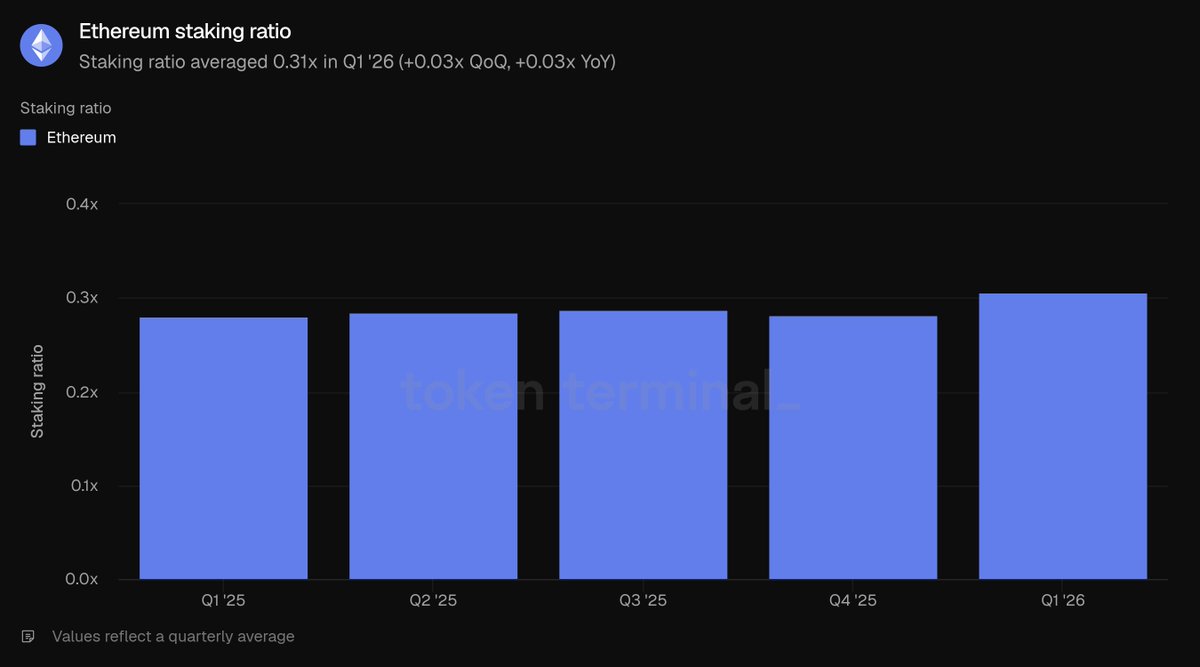
ETH staking ratio: 0.31 (up 0.03 quarter-over-quarter and year-over-year)
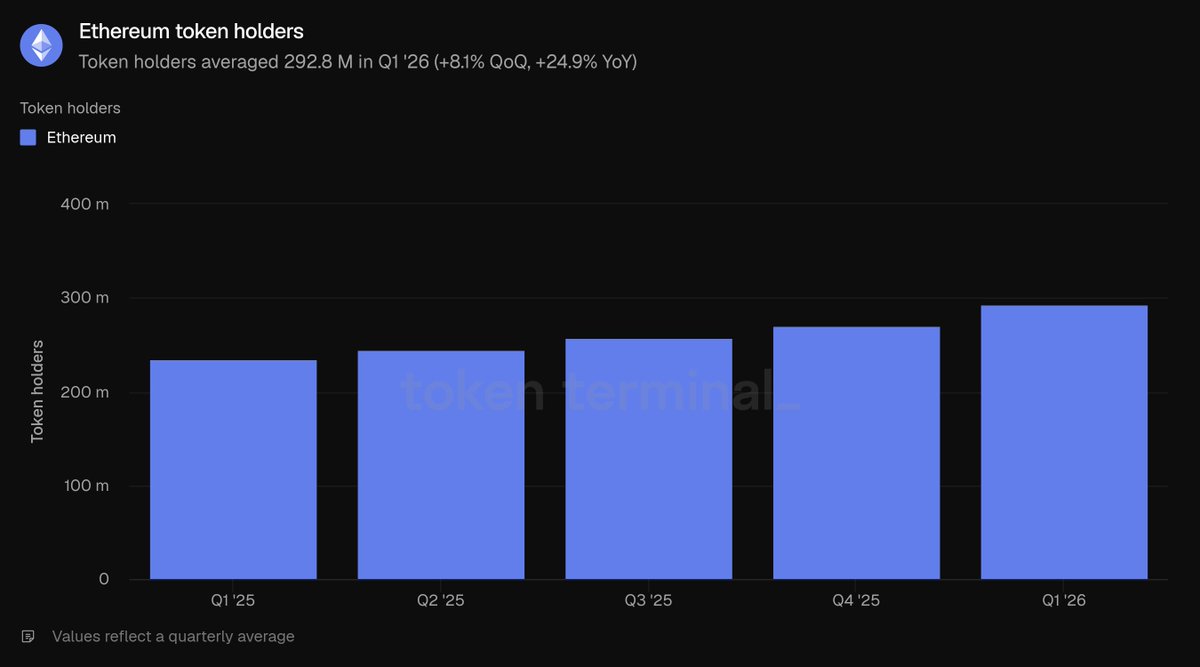
Total number of addresses holding ETH: 292.8 million (quarter-over-quarter +8.1%, year-over-year +24.9%)
Note: This report's statistical scope includes only Ethereum's layer one mainnet, with layer two networks treated as separate public chains; related data are not included in Ethereum's statistics.
Overall Development of the Ecosystem
Total locked assets refer to the total dollar value of assets deposited in various on-chain applications and serve as a leading indicator for revenue-generating businesses such as lending, trading, and staking; this statistic captures the on-chain funds that Ethereum ecosystem users can withdraw at any time. In Q1 2026, Ethereum's ecosystem average total locked assets reached $316.2 billion, down 11.0% quarter-over-quarter, but up 22.8% year-over-year. The quarter-over-quarter shrinkage is due to a general price correction in crypto assets, while the year-over-year significant growth indicates substantial expansion in the ecosystem compared to the same period last year.
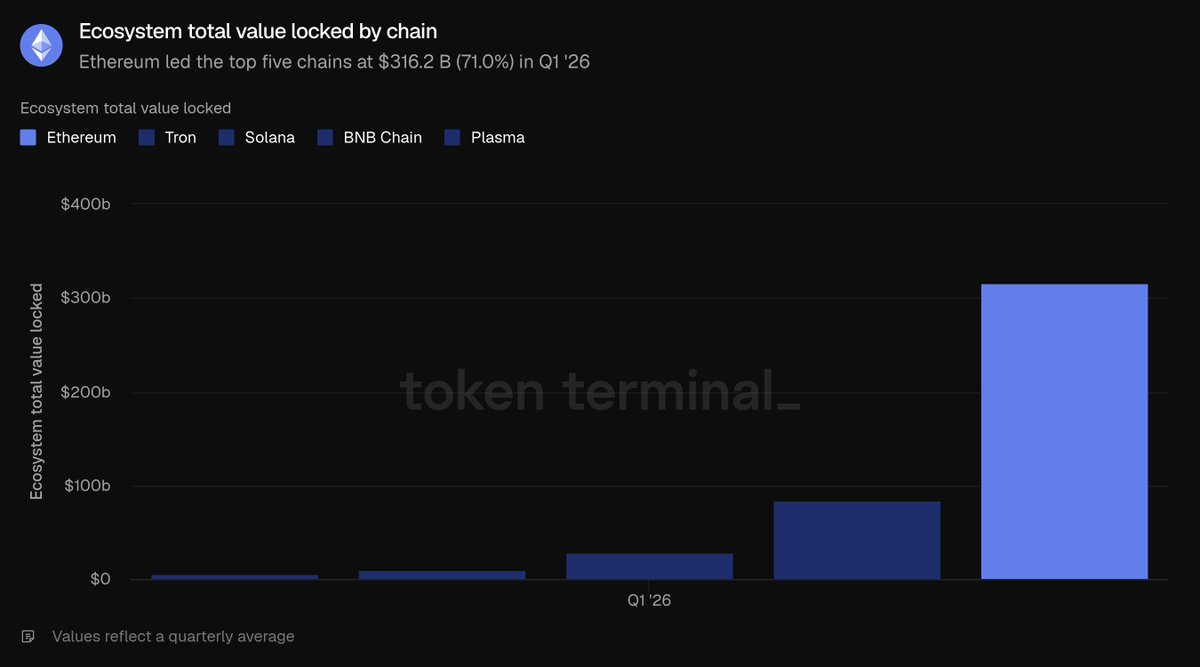
Among the five major public chains, Ethereum's locked asset scale far surpasses its peers: $316.2 billion significantly outstrips Tron ($84.5 billion), Solana ($28.8 billion), BNB Chain ($10.3 billion), and Plasma ($5.7 billion) combined, accounting for 71% of the total locked amount across these five public chains. Funds are mainly concentrated in two sectors: liquid staking led by Lido and the lending sector centered around Aave; re-staking protocols like EigenLayer and ether.fi, as well as platforms for synthetic dollar stablecoins like Ethena and Sky, also hold significant amounts of funds. This concentrated capital is Ethereum's most prominent structural advantage.
The active lending metric represents the scale of deposits that users lend out and generate interest income, directly reflecting revenue from lending activities; this statistic captures the total unpaid loans across all lending applications in Ethereum. The ecosystem average active lending scale in Q1 was $21.8 billion, down 16.6% quarter-over-quarter, but up 39.0% year-over-year. The decline in lending balance corresponds with the contraction in total locked assets, indicating a cooling in the overall market risk appetite, but the scale remains significantly higher than the same time last year.
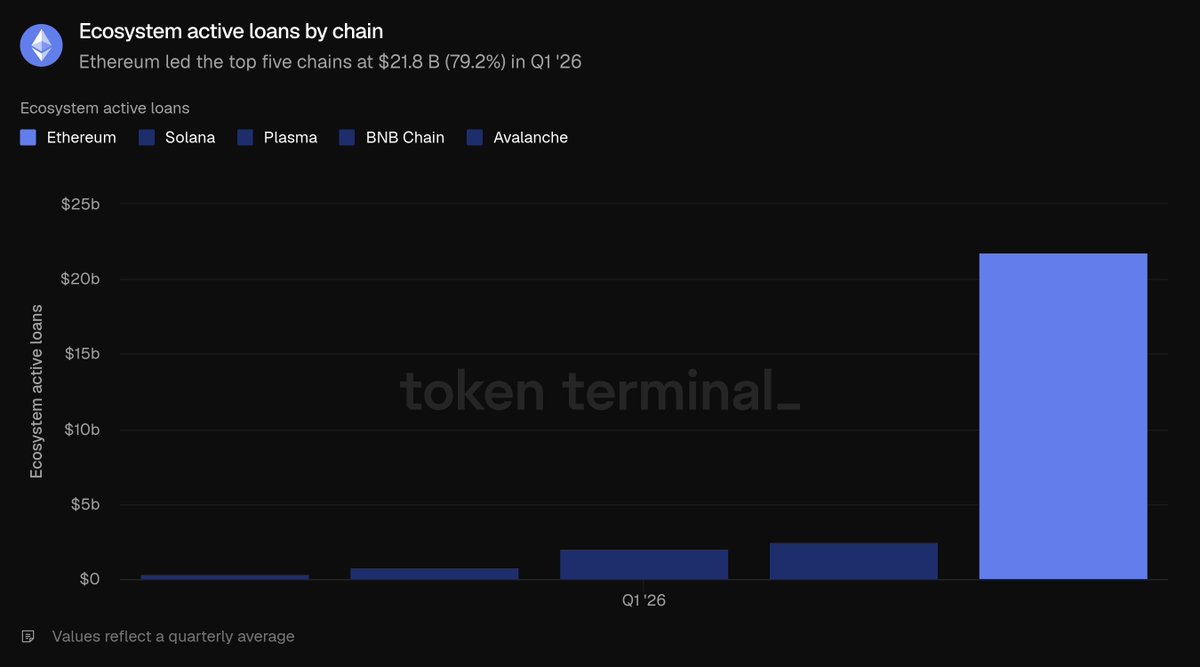
The Ethereum lending market is concentrated within a few capital pools, with Aave dominating: the active lending scale at the end of the quarter was approximately $13.5 billion, capturing the majority of the ecosystem's share; followed by Morpho (approximately $1.9 billion), Spark under Sky (approximately $1 billion), and Maple (approximately $840 million). The shrinkage of lending scale in this quarter was primarily driven by Aave, as falling crypto asset prices reduced lending demand, resulting in an overall reduction in lending volume of about 24%. Compared to the five major public chains, Ethereum's $21.8 billion active lending significantly leads Solana ($2.5 billion), Plasma ($2.1 billion), BNB Chain ($760.8 million), and Avalanche ($392.4 million), accounting for 79.2% of the total lending volume across the five public chains, making this the segment where Ethereum holds the highest market share.
The trading volume of decentralized exchanges refers to the total transaction amount completed by on-chain spot exchanges; traders pay fees during transactions, and the trading volume is highly correlated with platform revenue. This data summarizes the trading activities of DEXs across the entire Ethereum ecosystem. In Q1, the total trading volume of the ecosystem was $134.5 billion, down 24% quarter-over-quarter and down 31.2% year-over-year. The decline in trading volume is steeper than the contraction in locked assets, confirming a significant reduction in market risk appetite during this asset downturn period.
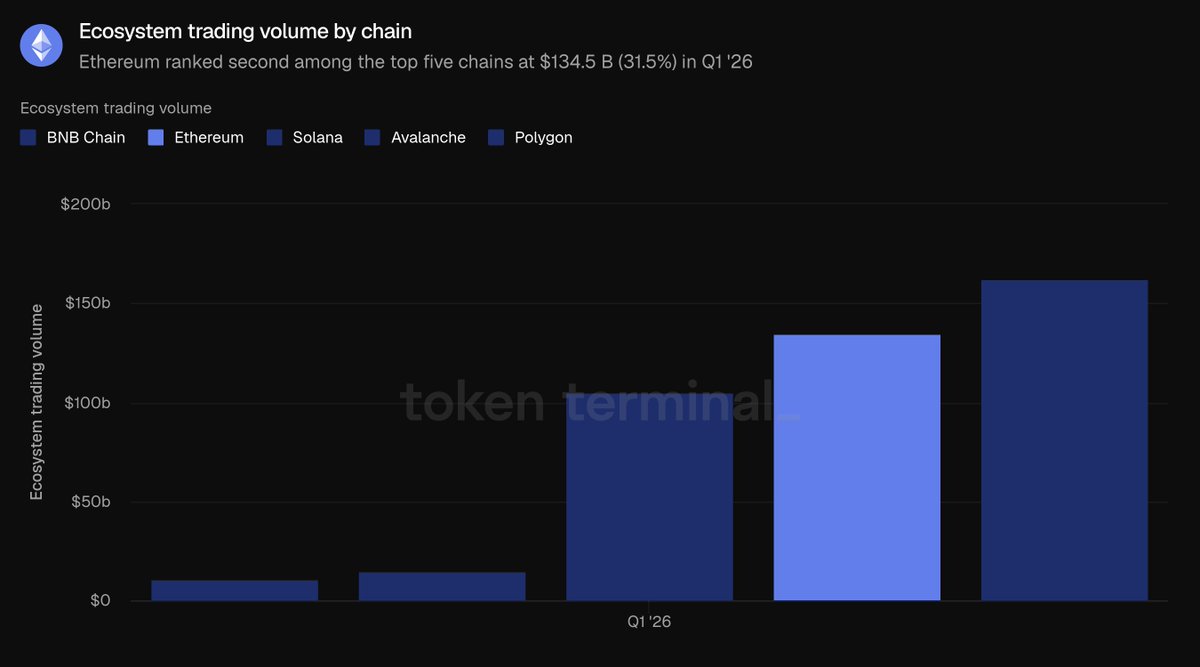
Ethereum DEX trading volume is highly concentrated on major platforms: Uniswap's trading volume in Q1 was approximately $85.5 billion, accounting for two-thirds of the ecosystem's total; followed by Curve (approximately $22.1 billion) and CoW Swap (approximately $12.4 billion). Trading volume is the only metric where Ethereum did not rank at the top among the five major public chains: the total trading volume of BNB Chain was $162.5 billion, surpassing Ethereum's $134.5 billion, followed by Solana ($104.9 billion), Avalanche ($14.5 billion), and Polygon ($10.7 billion) below it. Ethereum's trading volume accounted for 31.5% of the total for the five major chains, second to BNB Chain's 38%.
The ecosystem fee represents all costs incurred by users when using various applications, including borrower interest, and trader transaction fees, directly reflecting the economic value generated by the ecosystem, aggregating the total fees across all Ethereum applications. In Q1, the total fees for the entire ecosystem amounted to $2 billion, down 16.9% quarter-over-quarter and down 7.8% year-over-year, falling in tandem with reductions in transaction and lending activity.
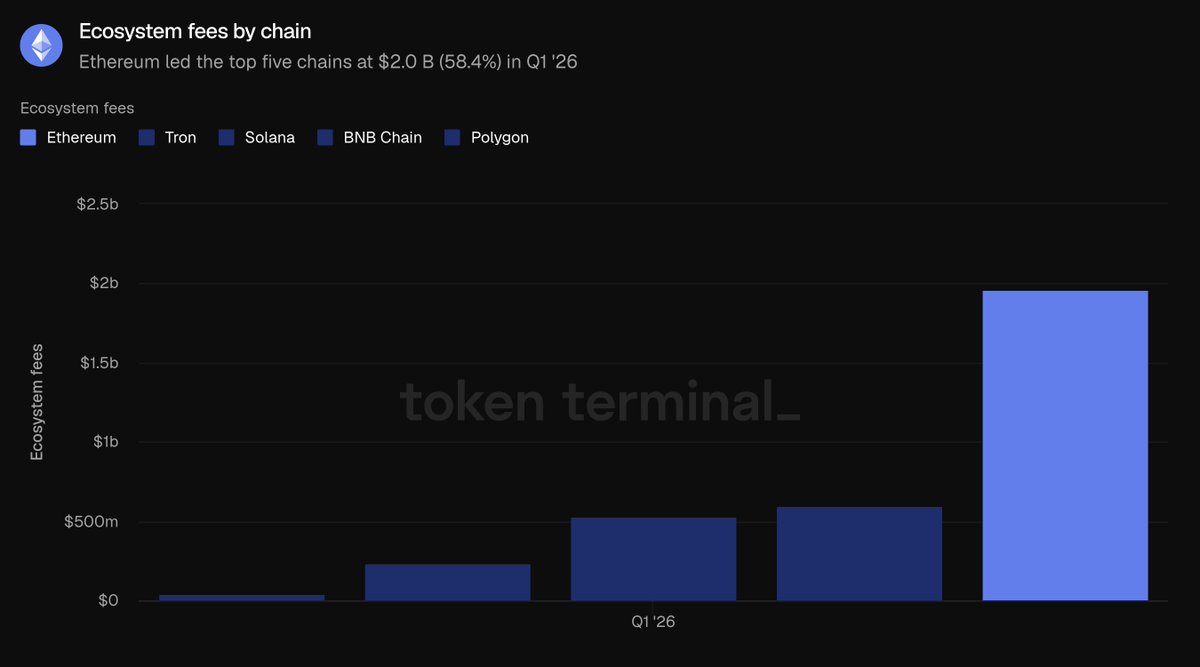
Ethereum's $2 billion in ecosystem fees far surpasses Tron ($599.3 million), Solana ($532.5 million), BNB Chain ($231.9 million), and Polygon ($38.8 million), accounting for 58.4% of the total fees across the five major public chains. Even with the decline in data this quarter, Ethereum remains the primary source of application fees in the industry. Overall, across all metrics in this sector: Ethereum leads the industry in locked funds, lending scale, and ecosystem fees, with only DEX trading volume falling short of BNB Chain.
Tokenized Asset Sector
Total market capitalization of circulating assets refers to the total value of on-chain tokenized assets, calculated by circulating supply times the closing price of the day; stablecoins take the total issuance in circulation, tokenized funds take the scale of on-chain managed assets, and tokenized stocks take the total value of on-chain issued shares, only counting assets issued on Ethereum in this segment.
In Q1, the average total market capitalization of Ethereum's tokenized assets was $203.4 billion, roughly flat quarter-over-quarter (only declining 0.7%), while showing a significant year-over-year increase of 42.9%. Stablecoins accounted for 87.9% of the overall scale, with the remaining shares divided among token funds, commodities, and stocks.
Stablecoins
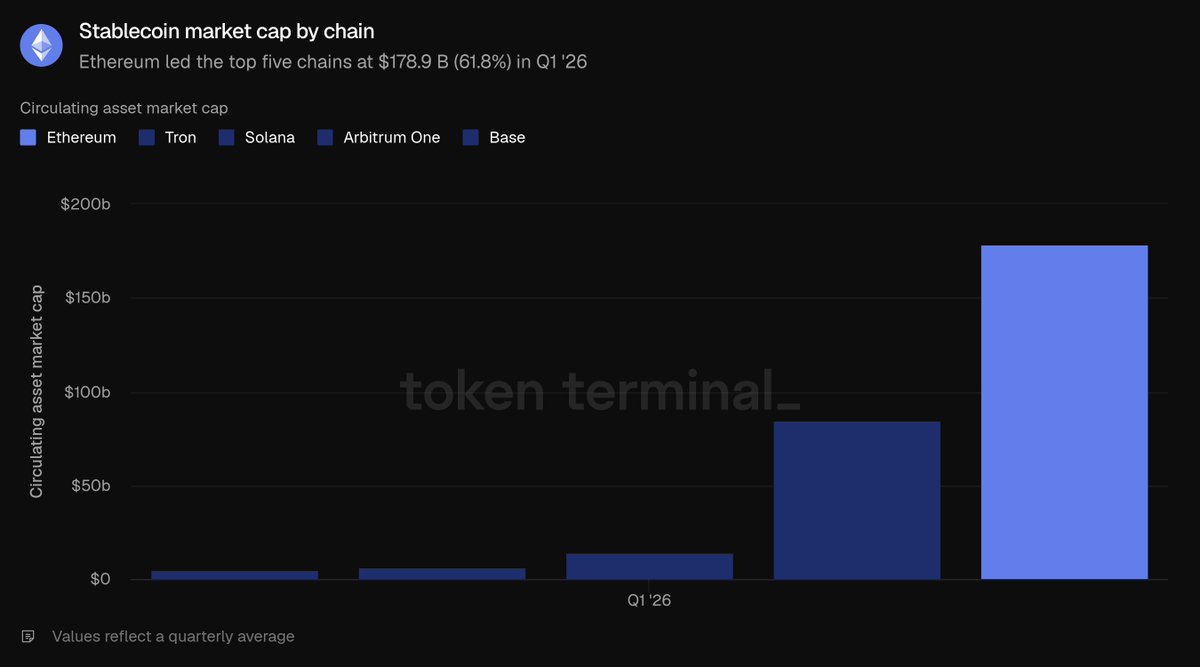
In Q1, the average scale of Ethereum stablecoins was $178.9 billion, slightly down 2.3% quarter-over-quarter and up 37.6% year-over-year, making it the only category among tokenized sub-segments to shrink on a quarter-over-quarter basis. The market is dominated by two major issuers: at the end of the quarter, Tether USDT ($94.1 billion) and Circle USDC ($54.5 billion) together constituted the vast majority of Ethereum stablecoin market capitalization; other leading products include Sky USDS ($12.4 billion), Ethena USDe ($5.9 billion), and PayPal PYUSD ($2.9 billion); the compliance-focused stablecoin RLUSD from Ripple ($1.1 billion) and other new compliant currencies have also been launched. In comparison with the five major public chains, Ethereum's $178.9 billion in stablecoin scale leads Tron ($84.5 billion), Solana ($14.5 billion), Arbitrum One ($6.8 billion), and Base ($4.7 billion), accounting for 61.8% of the total stablecoins across these five public chains.
Tokenized Funds
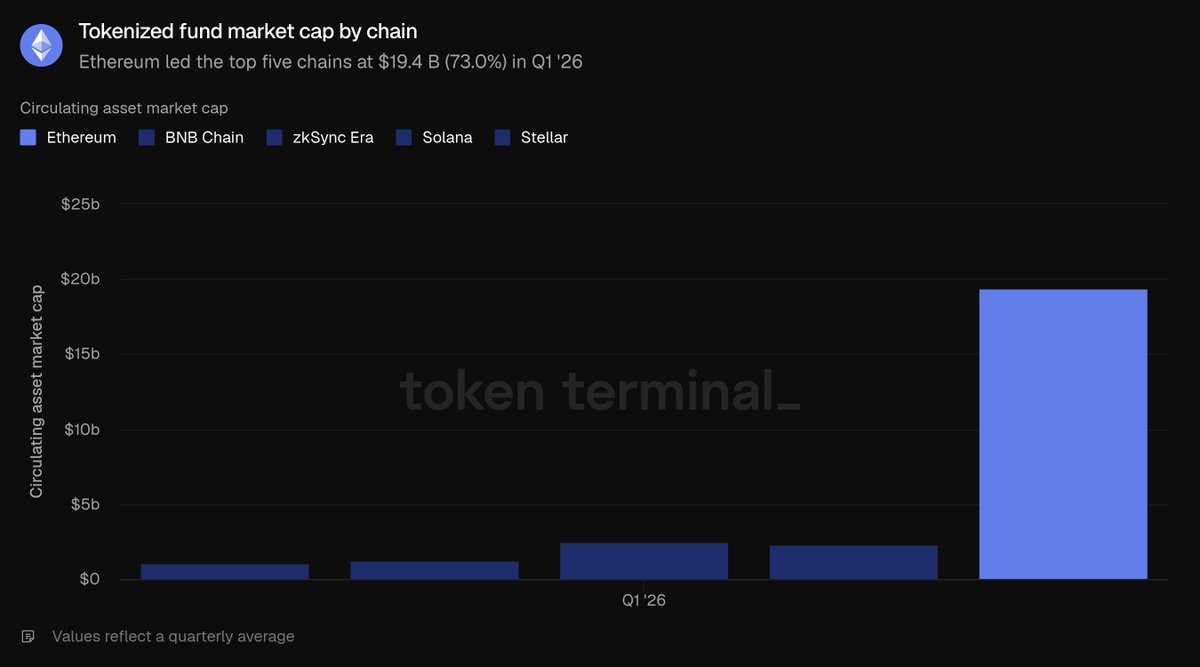
In Q1, the average scale of Ethereum tokenized funds was $19.4 billion, up 4.9% quarter-over-quarter, and a massive increase of 73.1% year-over-year. The sector is divided into two main types:
Yield-based on-chain dollar products (largest scale): Sky sUSDS (approximately $6.4 billion), Ethena sUSDe (approximately $3.5 billion);
Traditional compliant financial funds (core carrier of institutional narratives): BlackRock BUIDL (issued by Securitize, approximately $1 billion), WisdomTree government currency fund (approximately $815 million), Superstate USTB (approximately $620 million), and Ondo OUSG (approximately $320 million) follow closely. In comparison with the five major public chains, Ethereum's $19.4 billion in tokenized funds significantly leads ZKsync Era ($2.5 billion), BNB Chain ($2.3 billion), Solana ($1.3 billion), and Stellar ($1.1 billion), capturing 73% of the total, marking it as the second most evident advantage for Ethereum in the token asset sector.
Tokenized Commodities
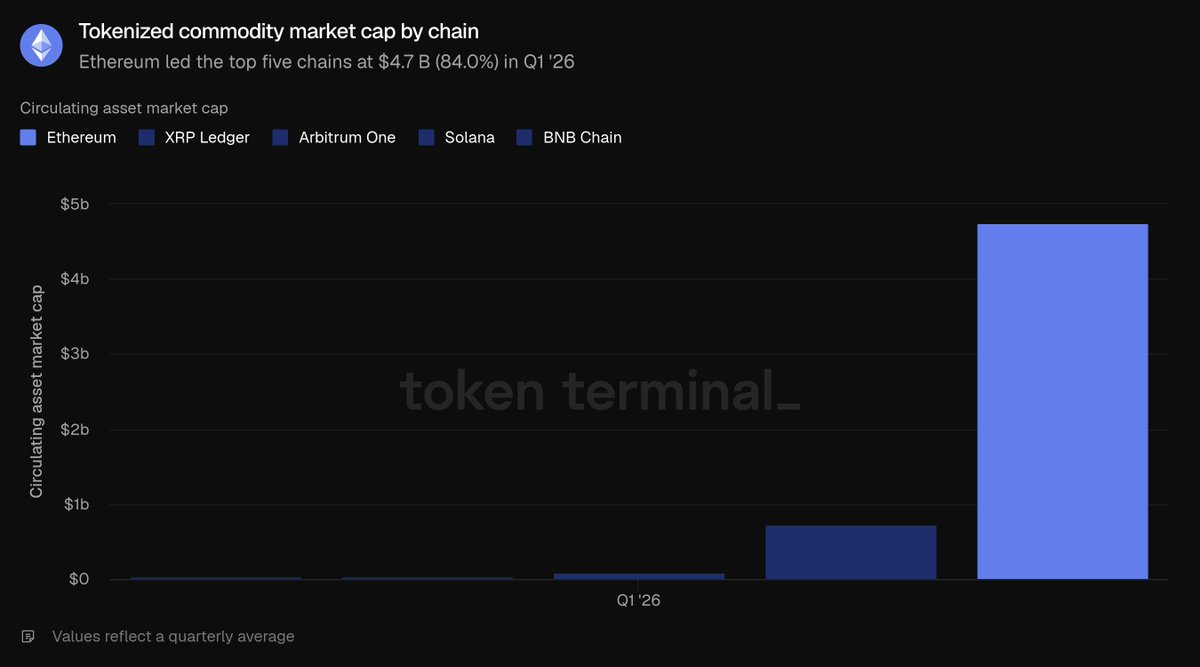
In Q1, the average scale of Ethereum tokenized commodities was $4.7 billion, up 60% quarter-over-quarter and a staggering 325.9% year-over-year, making it the fastest-growing tokenized category. The sector is predominantly composed of on-chain gold: Tether Gold XAUT (approximately $2.6 billion), Paxos Gold PAXG (approximately $2.4 billion) collectively occupy the entire sector's share. In comparison with five major relevant public chains, Ethereum's $4.7 billion scale far surpasses Ripple ($736.6 million), Arbitrum One ($95.9 million), BNB Chain ($38.4 million), and Solana ($29.8 million), taking 84% of the total, making it the segment where Ethereum exhibits the strongest dominance.
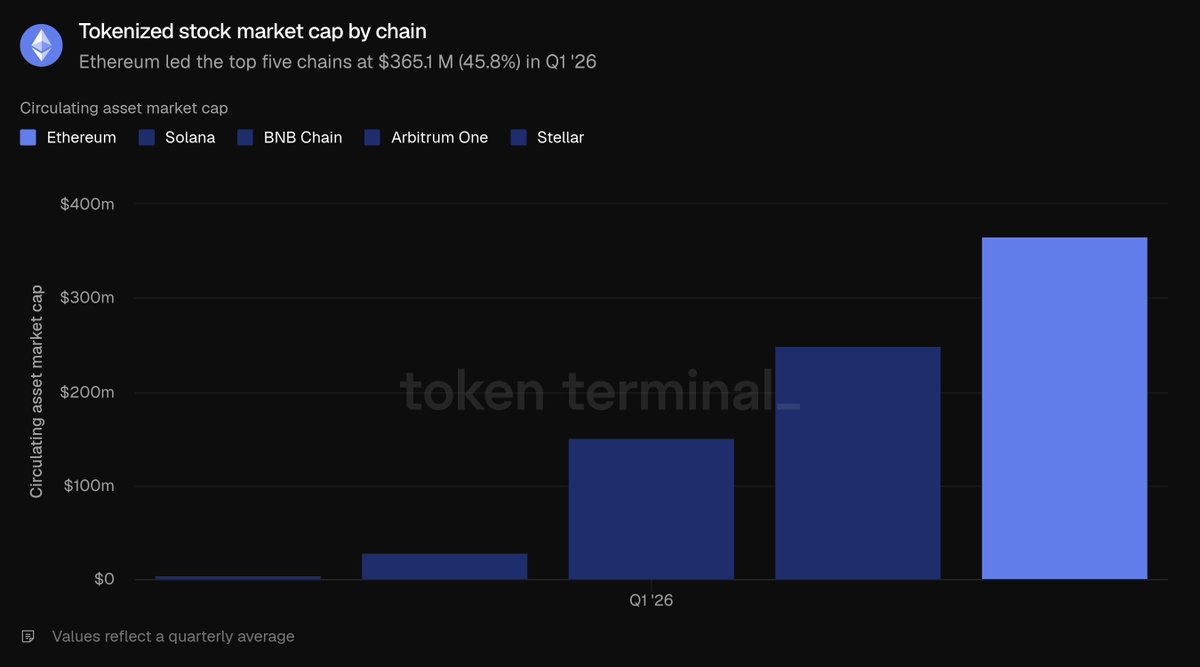
Tokenized Stocks
Tokenized stocks are the smallest subsector, with an average scale of $36.51 million in Q1, nearly zero last year, and up 16.5% quarter-over-quarter. The sector is almost exclusively dominated by Ondo Finance, which issues tokenized assets linked to the S&P 500, NASDAQ 100 broad indices, and dozens of individual stocks, forming the majority of Ethereum's tokenized stock market capitalization. In comparison with the five major public chains, Ethereum's $36.51 million slightly leads Solana ($24.9 million), BNB Chain ($15.05 million), Arbitrum One ($2.9 million), and Stellar ($0.42 million), constituting only 45.8% of the total tokenized stock market across the five public chains, which is the only token asset category where Ethereum does not hold an absolute majority share.
In summary, while stablecoins faced a slight decline in the quarter, Ethereum's monopoly position in token funds and commodities sectors continues to solidify.
On-Chain Usage Activity
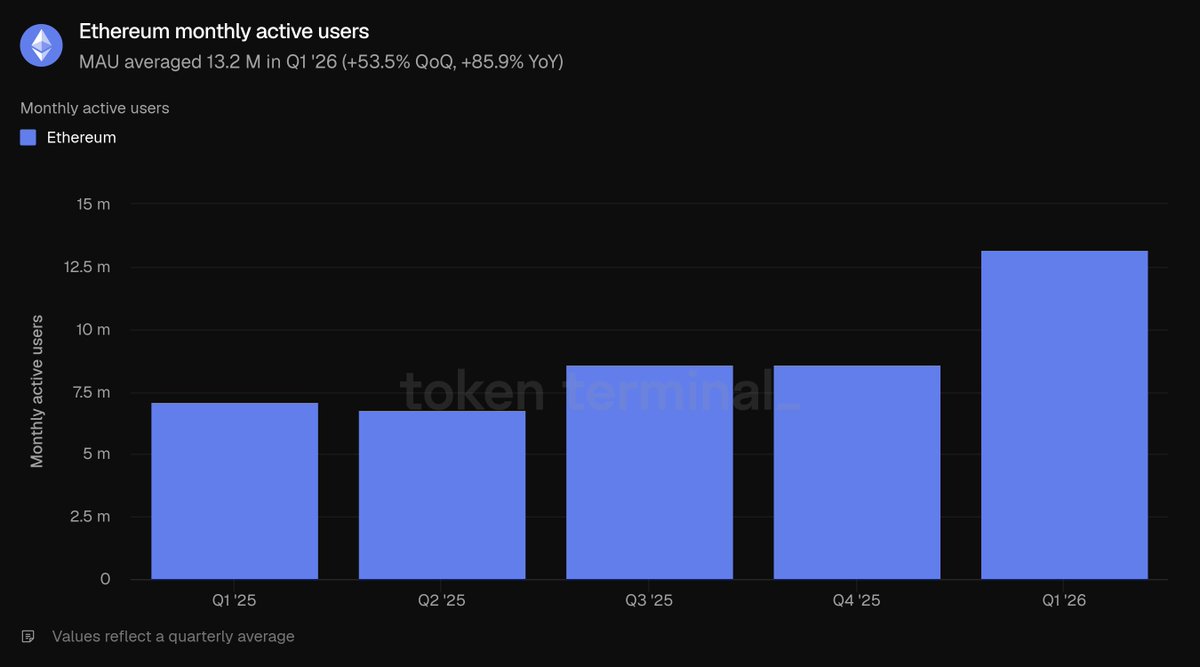
Monthly active users are defined as unique addresses that generate revenue-producing on-chain transactions each month, and this metric only counts interaction addresses on Ethereum's layer one mainnet. The average monthly active users for Q1 was 13.2 million, a significant increase of 53.5% quarter-over-quarter and a remarkable 85.9% year-over-year, setting an all-time high and ending a series of previous quarters of slow growth, indicating a substantial acceleration in user growth.
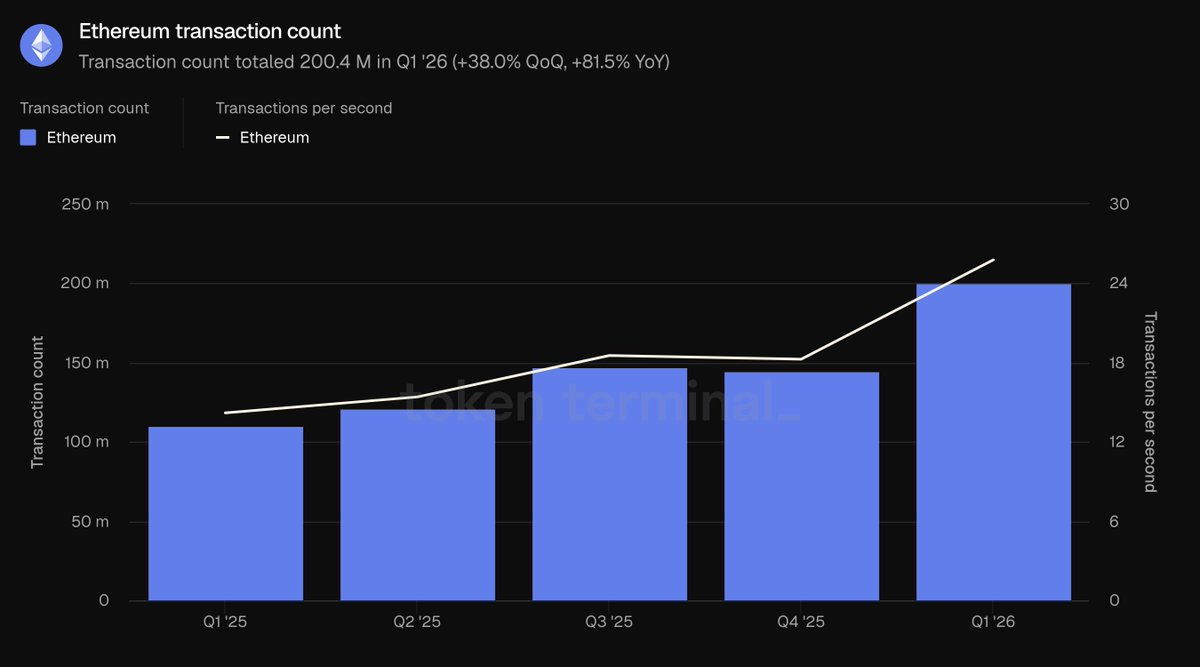
Total transactions refer to the number of transactions written to and confirmed on the blockchain, reflecting user engagement with on-chain interactions; transactions per second (TPS) represent the average confirmation rate during the period, measuring the network's real-time capacity. Both metrics only count Ethereum's layer one mainnet. In Q1, total transactions on layer one reached 200.4 million, up 38% quarter-over-quarter and up 81.5% year-over-year; the average TPS rose to 25.78, up 41.2% quarter-over-quarter. Both metrics set new historical highs, demonstrating that the growth in user scale has effectively translated into an actual increase in on-chain business activity.
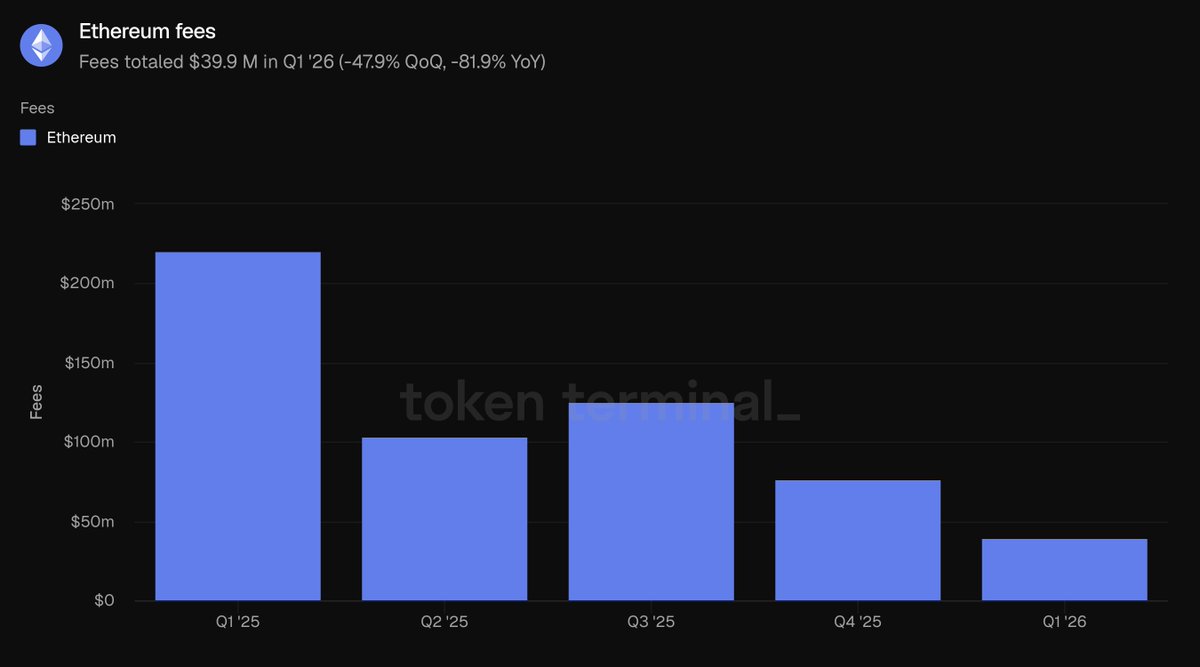
This section's fees specifically refer to the basic network costs users pay when initiating transactions on Ethereum's layer one, distinguishing it from the total ecosystem application fees reported in the second part. In Q1, total transaction fees on layer one amounted to $39.9 million, down 47.9% quarter-over-quarter and down 81.9% year-over-year. The increasing activity and the significant drop in fees are the most critical data contrasts of this quarter: total transaction volume increased by 38%, while total fees shrank by almost 50%, chiefly because the Blob expansion greatly enhanced block storage capacity, providing ample block space and significantly lowering the cost per transaction.
The core conclusion of this section is the realization of expansion benefits: user activity and transaction volume reached new highs simultaneously, while overall network usage costs declined. When the speed of network throughput expansion exceeds the growth rate of market transaction demand, it presents the characteristics of ‘increased activity and decreased fees’.
Fundamentals of the Native Token ETH
The calculation logic for fully diluted total market capitalization: ETH token price × total supply under the current token economics model (including circulating, locked, unlocked, and pending issued tokens). In Q1, the average fully diluted market capitalization of ETH was $290 billion, down 30.3% quarter-over-quarter and down 9.9% year-over-year, making it the metric with the largest quarter-over-quarter drop among all valuation indicators in the report, and is a core factor driving the decline in the total dollar-denominated asset scale of the entire ecosystem.
Staking ratio: the total value of staked ETH used to secure the proof-of-stake network, compared with the overall market cap of ETH; a ratio of 0.31 indicates that approximately 31% of ETH's market value is staked. The average staking ratio in Q1 was 0.31, higher than the previous quarter and the same quarter last year at 0.28. Even though ETH's overall market cap underwent a significant correction, the proportion of tokens participating in network security staking still increased, indicating that during the price decline cycle, users' long-term staking willingness remained stable.
Token holder metric: total number of unique wallet addresses holding ETH. The average number of ETH holding addresses in Q1 was 292.8 million, up 8.1% quarter-over-quarter and up 24.9% year-over-year, showing steady growth over five consecutive quarters. Amid the continuous decline in fully diluted market cap, the number of holding addresses continued to expand, representing a further dispersion of the ETH holder community, as ordinary users’ willingness to invest has not cooled despite short-term market conditions.
Etherealize Team's Interpretation and Comments
The most core contradictory phenomenon this quarter: while Ethereum's layer one mainnet on-chain usage scale reached an all-time high, network transaction fees declined. Ethereum proactively promoted network expansion at the expense of short-term fee income, with the long-term logic being that cheaper block space will unleash massive latent market demand, ultimately driving long-term revenue growth for the entire network.
Data from Token Terminal's "Q1 2026 Ethereum Report" confirms that this long-term logic is unfolding: year-over-year growth in monthly active users by 85.9%, transaction volume increasing by 81.5%, and network throughput improving by 81.7%. This is a classic example of Jevons's Paradox. The team anticipates that the long-term increase in network transaction demand will completely cover the short-term revenue losses due to declining individual transaction fees. Drawing a parallel with the semiconductor industry: in 1975, Gordon Moore proposed Moore's Law when the industry's revenue scale was limited; today, the industry revenue scale has increased by several orders of magnitude. The benefits of expansion have yet to be fully realized: the Q3 Glamsterdam upgrade plan will increase the gas limit by more than three times; Ethereum's long-term roadmap is planned to achieve tens of thousands of TPS by 2029, creating a high-speed layer one public chain for near-instant transaction confirmations.
The team agrees with BlackRock CEO Larry Fink's view from December last year: the current stage of the tokenization industry is comparable to the internet in 1996—at that time, Amazon's online book sales amounted to only $16 million. The market generally believed that Amazon survived solely on the internet bubble and remained a perpetually losing online bookstore; however, Bezos predicted that the internet would radically reshape the retail industry, sacrificing short-term profits to fully develop network effects and scale advantages. Ethereum is making similar sacrifices today, solidifying its position as the foundational settlement layer for global finance.
The development of the internet brings another important insight: open, permissionless networks will ultimately triumph over closed private networks. In 1995, Bill Gates predicted in "The Road Ahead" that digital commerce would rely on proprietary private networks, or "information superhighways," rather than the open internet. At the time, Microsoft built MSN, AOL, CompuServe, and Prodigy, all operated as closed walled gardens, boasting millions of paying users; France's Minitel terminal system had a user base exceeding the global internet until the end of 1996. However, all these closed systems ultimately failed. No large legitimate enterprise is willing to build businesses on networks controlled by competitors; more critically, any enterprise cannot keep pace with the innovation speed of a permissionless open ecosystem. History continually verifies this rule: Linux surpassed proprietary Unix systems, open web pages replaced corporate intranets, and Wikipedia eclipsed the Encyclopaedia Britannica. Each time at the beginning of a transformation, proprietary products seize the first mover advantage through their more precise features, ample marketing, and business resources; but when an open ecosystem accumulates sufficient development tools, developers, and neutral credibility, that first mover advantage rapidly dissipates.
Now, this industry rule is being reiterated in the financial infrastructure sector, with all data in this report demonstrating that Ethereum has crossed an ecological inflection point: it commands absolute market shares in all core sectors. Institutional choices to engage in tokenized finance are not based on ideological preferences, but rather, ecosystem liquidity, composability, and mature case studies of institutional deployment are already concentrated here. Report data shows that Ethereum occupies 79.2% of active DeFi lending, 61.8% of stablecoins, 73% of token funds, and 84% of the tokenized commodities market shares among the five major public chains. Each new type of tokenized asset will further thicken the ecosystem's liquidity, continuously attracting more institutional entry; the neutral and unbiased base is the only stable and balanced solution for the industry—large financial institutions will never uniformly choose competing private chains for asset settlement. Moreover, institutions are gradually realizing that privacy interactions, access restrictions, KYC compliance, and asset transfer controls can all be achieved through privacy computing environments and permissioned token standards on Ethereum's upper layer while fully accessing public liquidity across the network; conversely, closed private chains cannot integrate the vast liquidity and diversified applications of the open ecosystem.
After the quarter ended, institutional deployment speed further accelerated, with multiple significant moves in May: In asset management, BlackRock applied for two new tokenized funds; JPMorgan issued its second Ethereum-based money market fund JLTXX; Fidelity International launched a Moody's AAA-rated dollar liquidity fund FILQ in ERC-20 token format. In the stablecoin sector, the Japanese Blockchain Association’s yen stablecoin EJPY is set to deploy on Ethereum; a coalition of 12 major European banks (including BNP Paribas, ING, UBS, and Banco Santander) is preparing a compliant euro stablecoin.
The internet in 1990 seemed far off, but by 2005, it had become a necessity for society. If Fink’s assessment of the tokenization industry's developmental stage is accurate, the next few years may prove to be the most opportunistic phase in Ethereum's history. The team's earlier report, "Efficient Currency," proposed a core viewpoint: network fees form the intrinsic value baseline for ETH; the long-term optimistic logic is that based on improving monetary properties, ETH is expected to absorb over $30 trillion in currency storage value premium from gold and Bitcoin. Ethereum does not need to rely on high fees to establish its leading position in the industry.
免责声明:本文章仅代表作者个人观点,不代表本平台的立场和观点。本文章仅供信息分享,不构成对任何人的任何投资建议。用户与作者之间的任何争议,与本平台无关。如网页中刊载的文章或图片涉及侵权,请提供相关的权利证明和身份证明发送邮件到support@aicoin.com,本平台相关工作人员将会进行核查。


