Author: David, Trend Research
Four months ago, those rushing to buy gold probably didn't expect they were buying at a peak that even a war couldn't rescue.
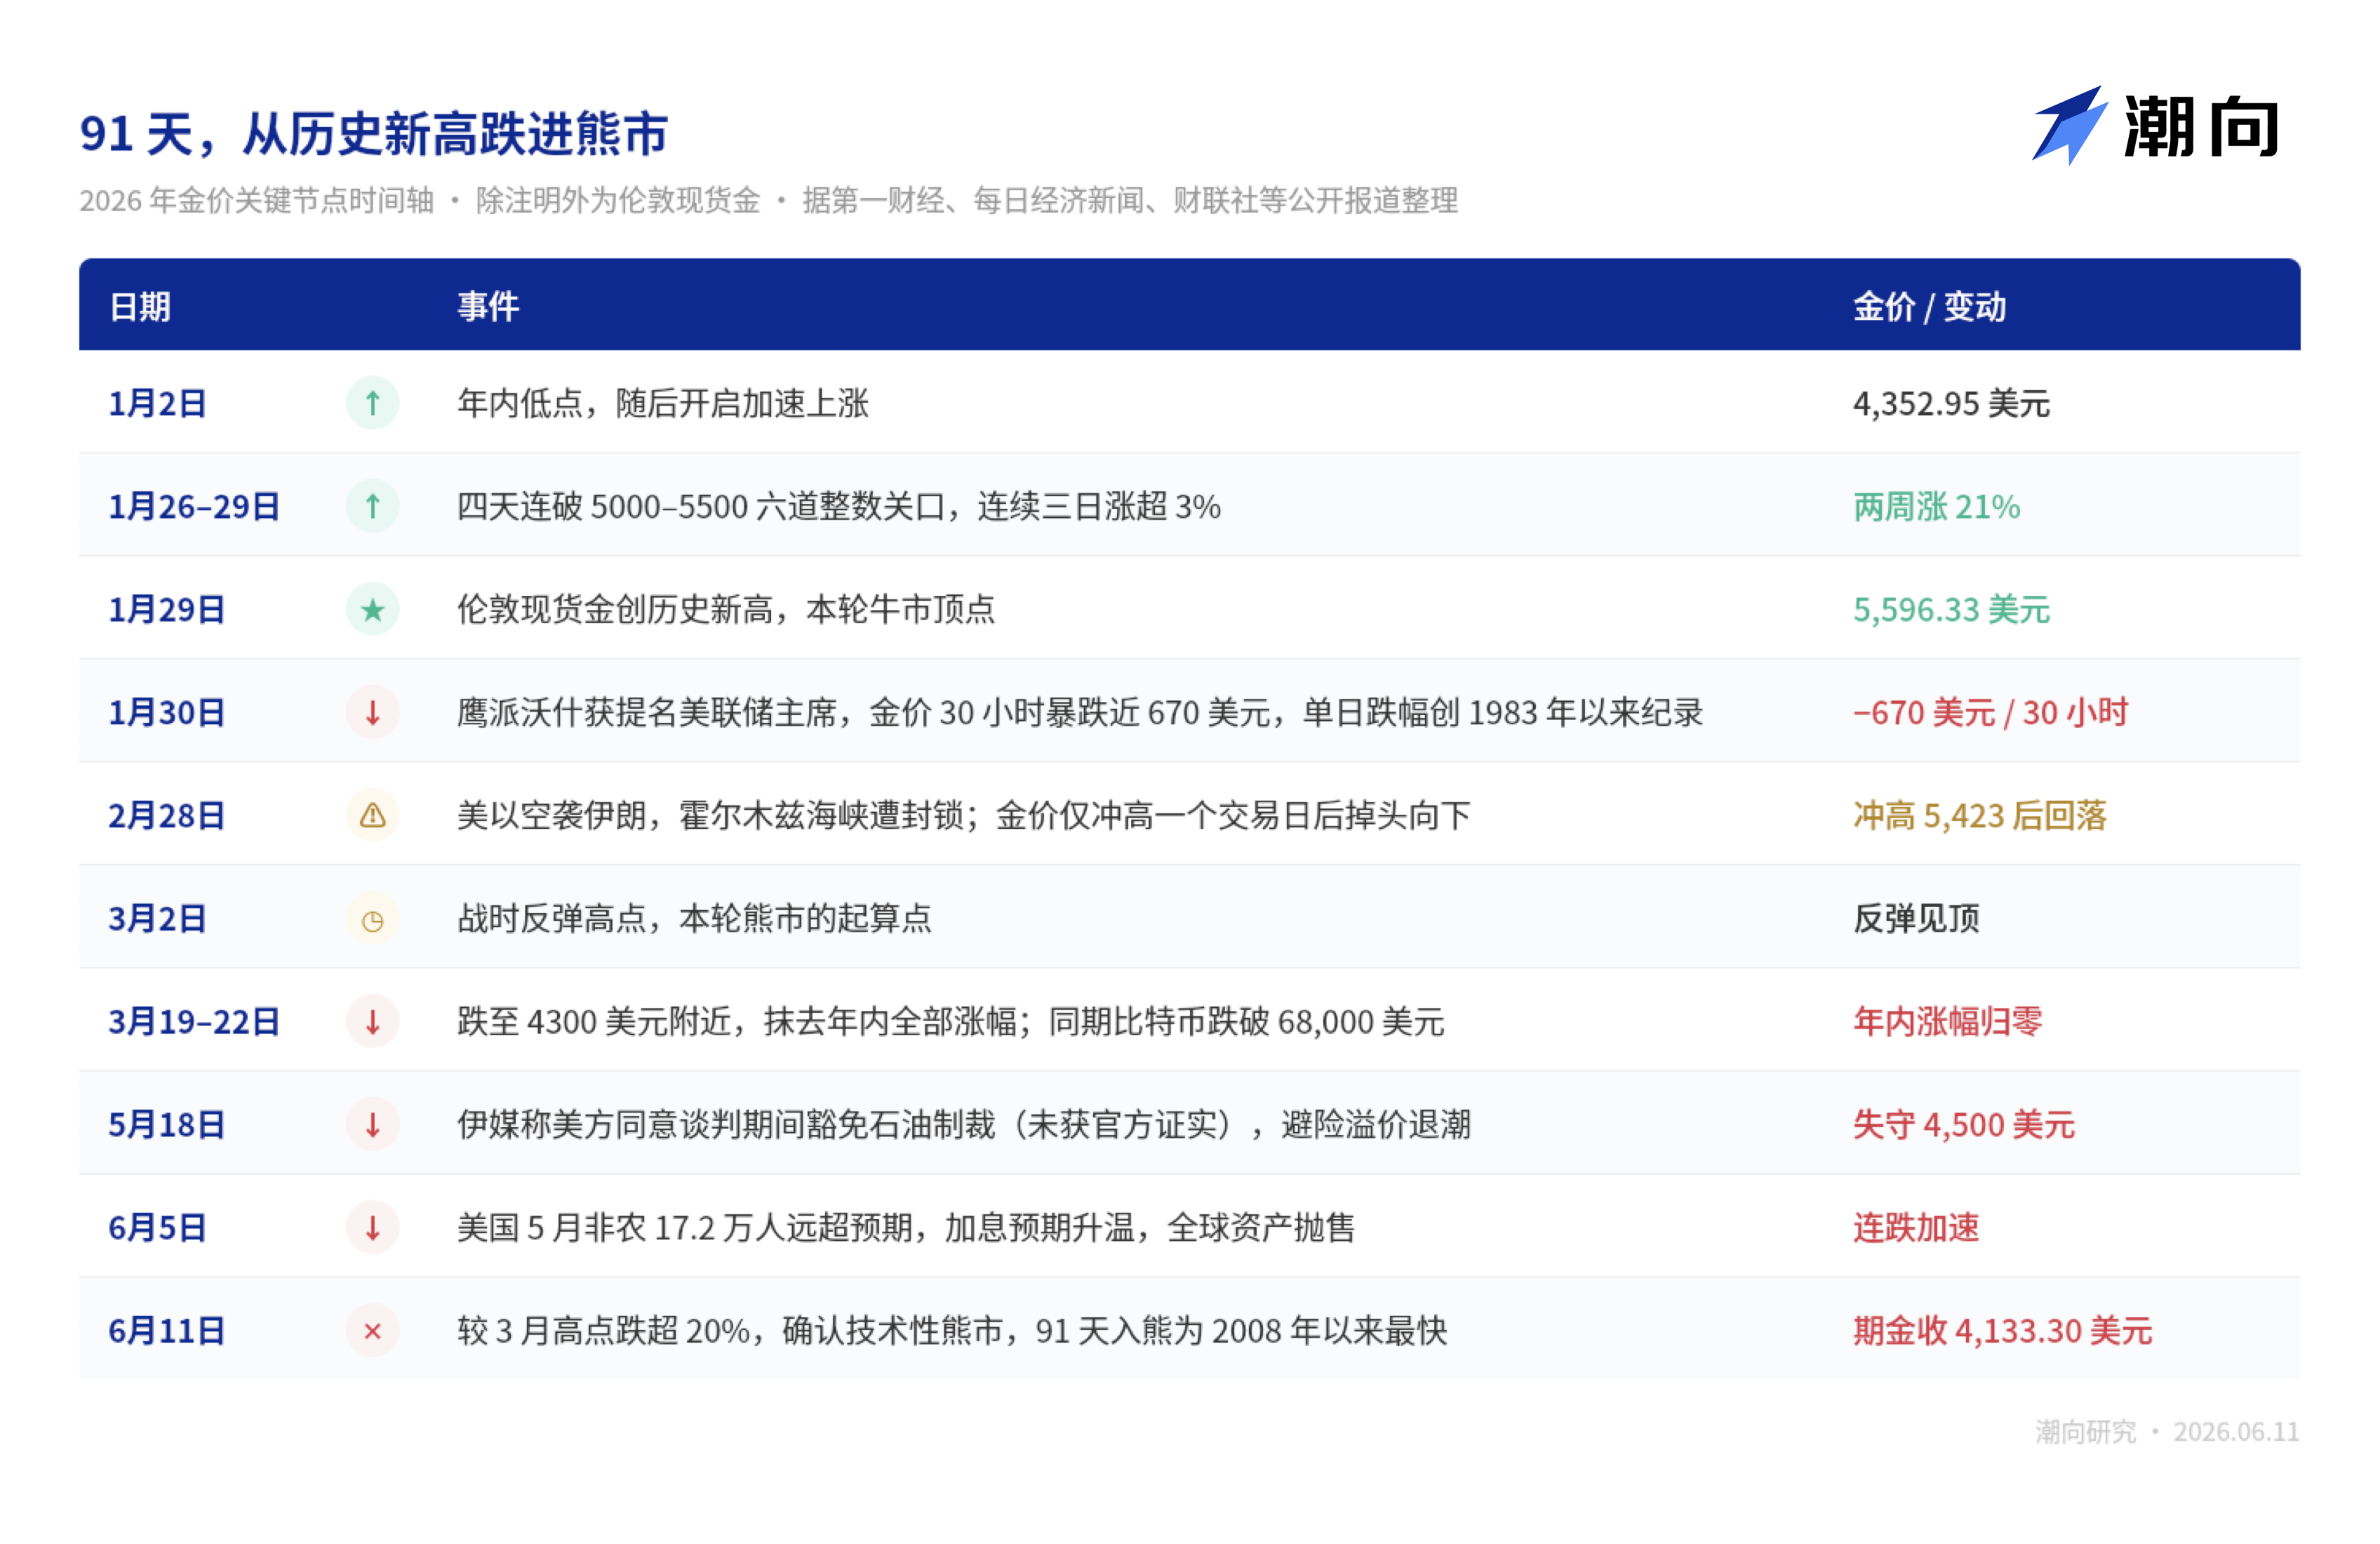
In the last week of January this year, gold was at the craziest phase of this bull market. From January 26 to 29, spot gold broke through the integer barriers from 5000 to 5500 for four consecutive days, with gains exceeding 3% for three trading days in a row, which is extremely rare in the history of gold trading.
On January 29, London spot gold touched $5596.33, a historical high.
The peak appeared the next day. On January 30, Trump nominated hawkish Kevin Walsh to be the next Fed chair, and gold prices plummeted nearly $670 within 30 hours, marking the largest single-day drop since 1983, while silver at one point dropped 36% intraday.
Note the timing, as there was still a full month before the US-Iran War broke out.
The first hand that pushed gold down from its peak was monetary policy, a fact that would be repeatedly confirmed over the next four months. The subsequent storyline is familiar: war, lockdown, rebound, gradual decline... By June 11, New York August futures gold closed at $4133.30, falling more than 20% from the March high, officially confirming a technical bear market, just 91 days after the peak, the fastest entry into a bear market since 2008.
These days, opening trading communities, the retail investors’ question has almost been the same: “With the war so fierce, why is gold not rising but falling?”
The author believes this question is reversed. The pertinent question should be, why on the first day of the outbreak of war did the market still rush to buy gold according to the old script; and why, a hundred days later, did the same war become a reason to sell gold?
In the feud of gold and interest rates, war is just a messenger
In chaotic times, buying gold is an act the market initially did follow through.
On February 28, the day the US-Israel conducted airstrikes in Iran, spot gold surged from $5296 to $5423. However, this increase only lasted for one trading day. The war did not end swiftly; the conflict fell into a stalemate, and thus the pricing chain of gold changed.
The new chain, I believe, goes like this:
The blockade of the Strait of Hormuz sent oil and gas prices soaring, rising energy prices pushed inflation expectations higher, inflation pressured central banks to tighten again, and gold, which yields no interest, sees greater opportunity costs the higher interest rates go.
Naeem Aslam, Chief Investment Officer at Zaye Capital Markets, an independent financial research and investment consulting firm in London, believes that geopolitical tensions support oil prices, which means high inflation will last longer, making it difficult for the Federal Reserve to cut rates, and funds will continue to favor U.S. Treasuries.
Is there any truth to this analysis? We can look at the following figures.
First, the CME FedWatch tool shows a 98.2% probability that the FOMC will hold steady next week, with traders betting that the next action will be a rate hike in December;
Second, before the war broke out, the market had originally expected the Fed to turn dovish later this year. The European Central Bank acted faster; according to Refinitiv data, a 25-basis-point hike on Thursday has nearly become market consensus.
Before the war, everyone was waiting for rate cuts; after the war, they were waiting for rate hikes. Thus, the foundation for gold bulls was completely pulled out over these four months.
The best proof of this is the counterexample in May. On May 18, Iranian media reported that the US agreed to waive oil sanctions during negotiations, and oil prices fell in response. According to risk-averse logic, expectations for peace warmed up, so gold should have only fallen slightly.
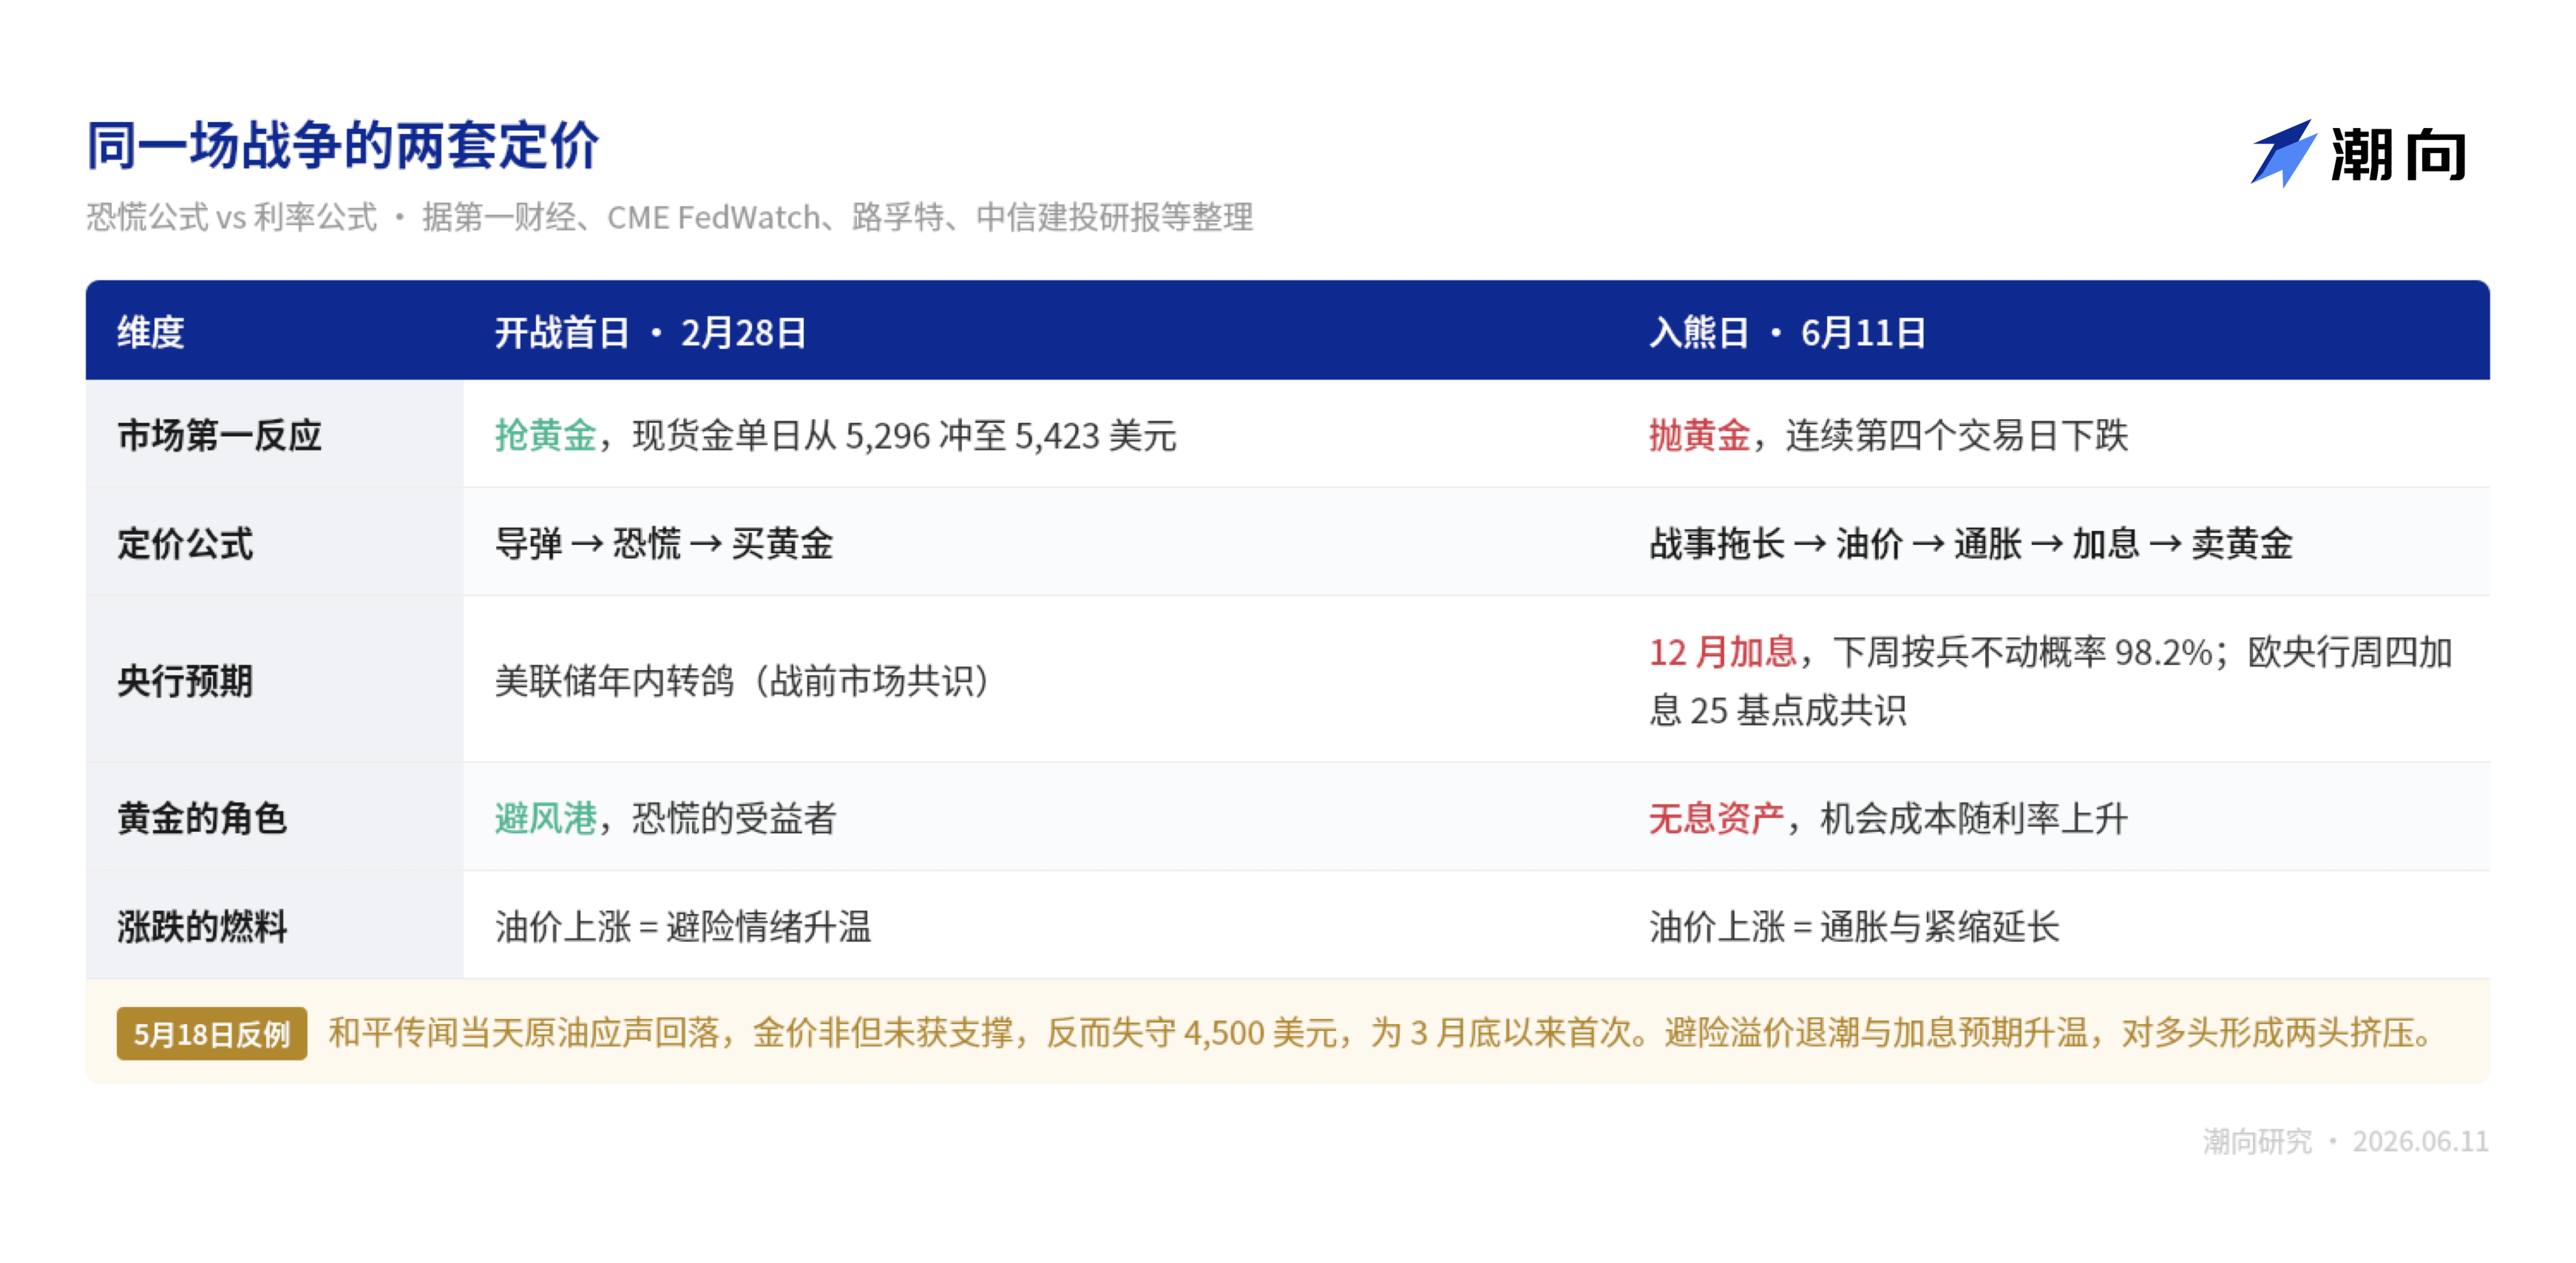
However, in reality, gold prices fell below $4500 that day for the first time since the end of March.
Peace caused a drop because the risk premium retreated; the war caused a drop because rate hike expectations warmed. Bulls were pinched from both ends; this is the true nature of this round of gold bear market.
China International Capital Corporation gave a harsher judgment in a research report:
The essence of the upcoming surge in gold prices in 2025 is liquidity pricing. Once the US-Iran game triggers inflation expectations, liquidity pricing will subsequently retract, and gold will have to return to its fundamentals.
In other words, those who bought gold last year earned on easy money; this year they are losing on the tightening of money, with missiles in the war merely serving as messengers throughout.
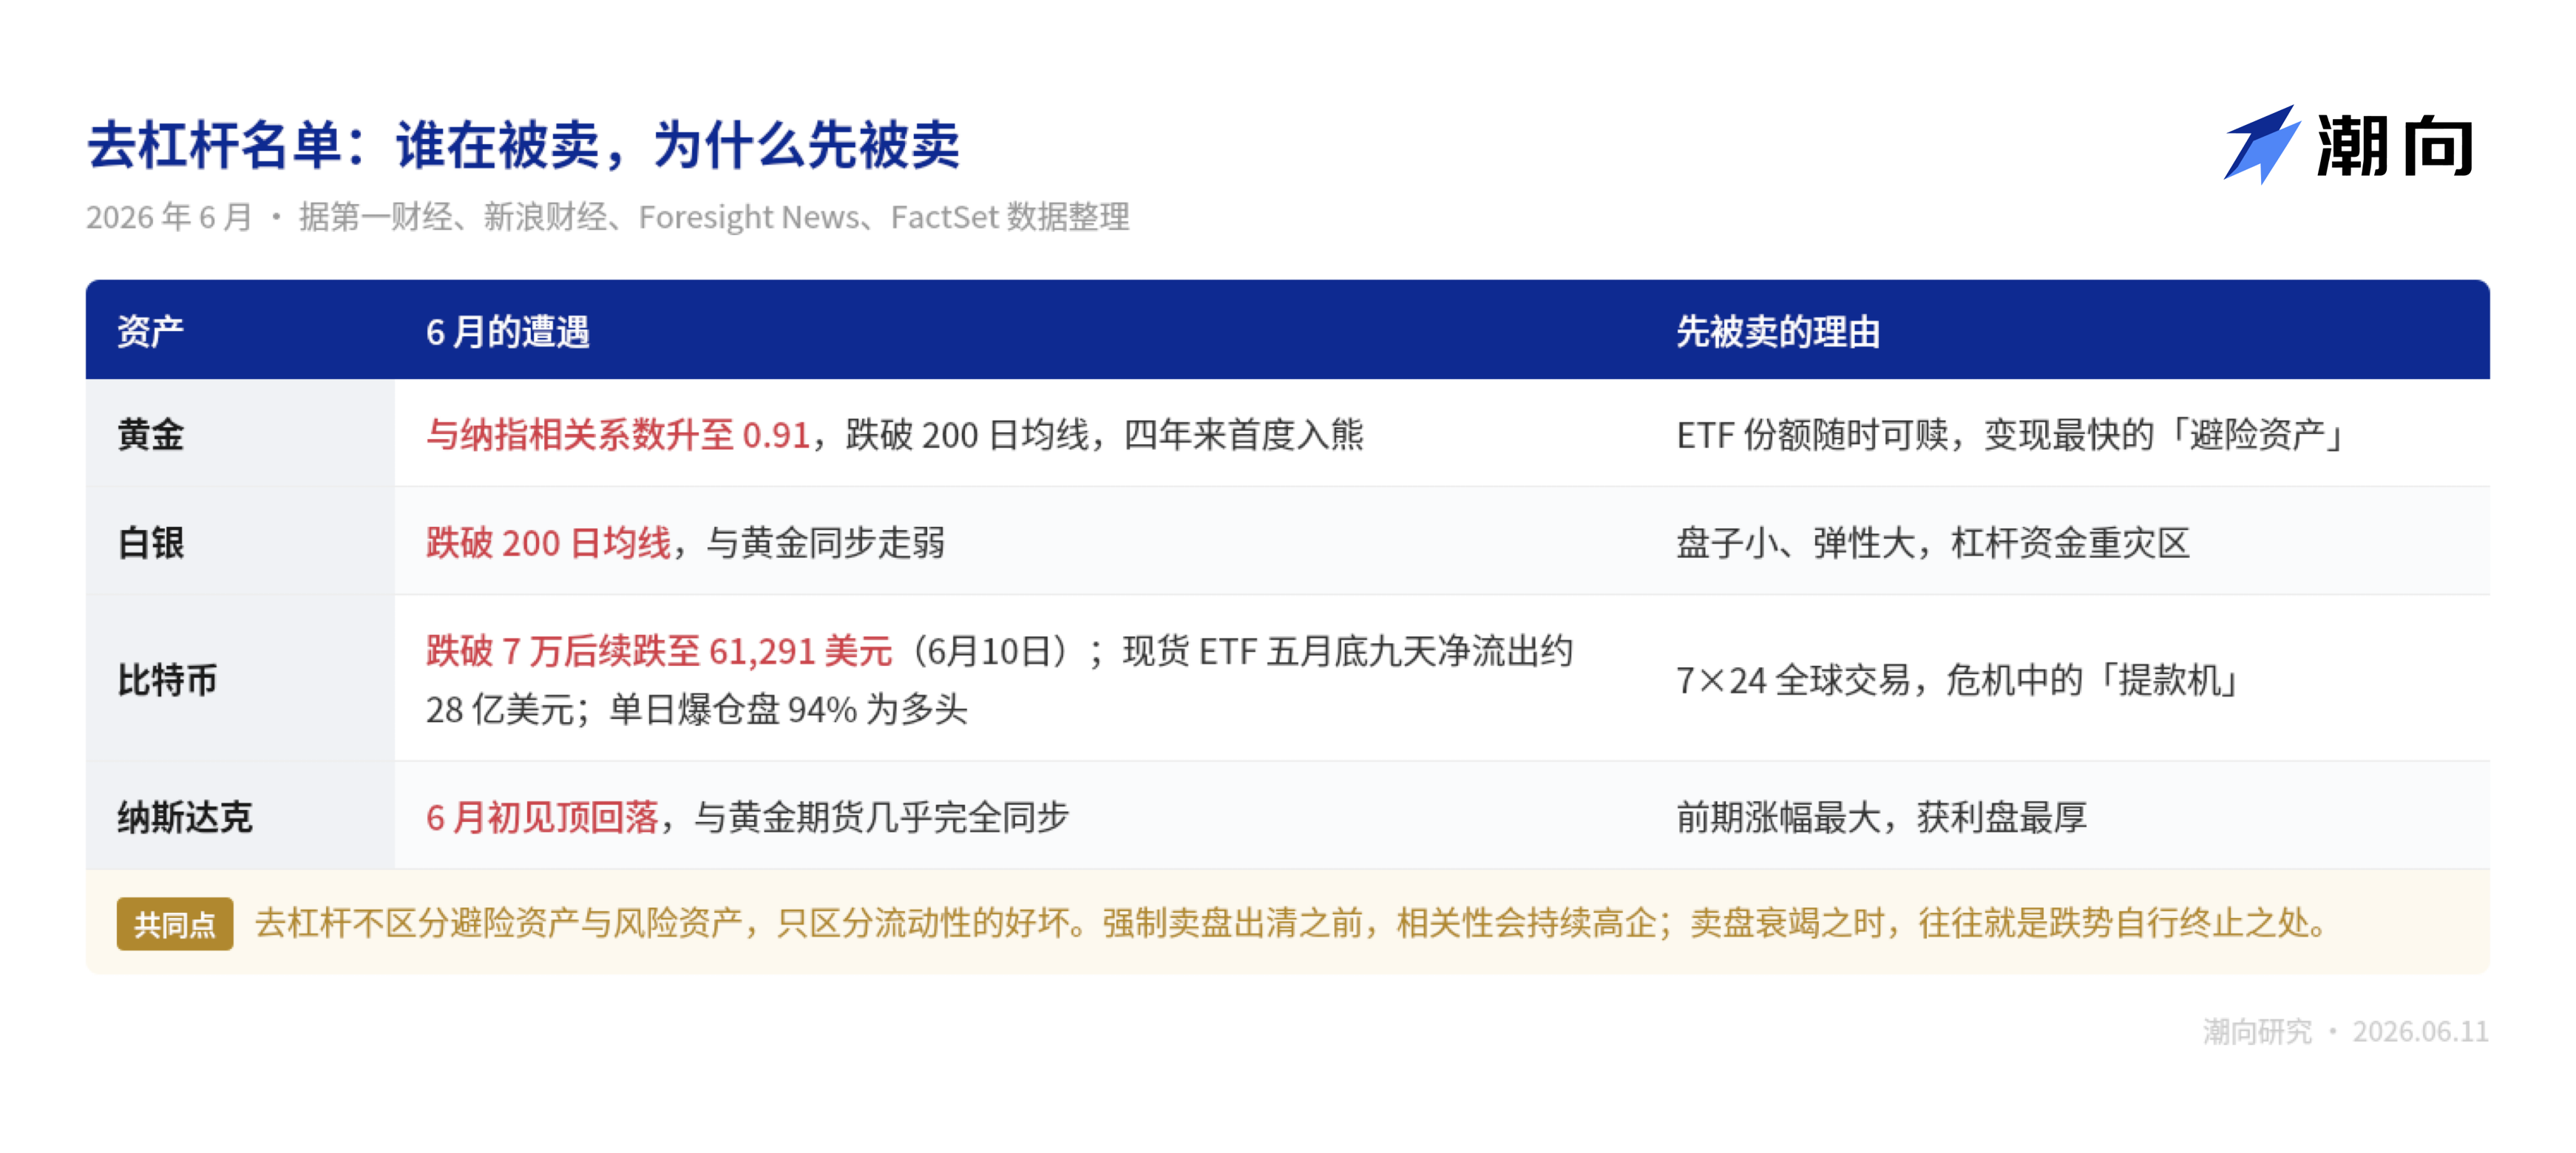
However, if this were just a feud between gold and interest rates, the list of declines in June shouldn’t be so long. Silver, Bitcoin, along with the Nasdaq... all faced similar downturns, and the declines looked more and more like the same trade.
0.9 correlation with Nasdaq: no one is spared in the de-leveraging market
First, let’s look at a strange phenomenon.
In the three months since gold fell from its peak, the Nasdaq 100 index has been rising, peaking only in early June. One is halfway in a bear market, while the other is at the peak of a bull market; they were originally on two different paths.
However, according to Yicai Global reports, based on FactSet data, the management partner of the futures brokerage Altavest calculated that since the Nasdaq peaked in early June, the correlation coefficient between gold futures and the Nasdaq index reached 0.91, almost entirely synchronized. He explains that when investors seek liquidity, gold will oscillate in sync with other risk assets in the short term.
What does this indicate?
This is a typical case of market-wide de-leveraging. Previously excessive positions and high leverage forced investors to sell quality assets to cover margin calls on losing positions. In layman's terms, when money runs low, you don’t sell what you want the most; you sell what is easiest to sell.
The same story also applies to “digital gold,” Bitcoin, without exception.
In early June, Bitcoin fell below $70,000, dropping 12% in a single week, while spot ETFs had a net outflow of about $2.8 billion over nine consecutive days at the end of May, with 94% of the liquidated positions being longs.
Bitcoin’s 12% weekly drop and gold ETFs’ continuous net outflow share a common reason for being hit: not due to poor liquidity, but exactly the opposite—because they are too easy to liquidate. When leveraged positions are called in for margin, the first to sell are the things that can be quickest turned into cash.
One more interesting detail. According to the Daily Economic News, the three major buyers pushing gold prices to their peak in January were the Polish central bank, Tether, and the world’s largest gold ETF SPDR, who together hoarded nearly 1780 tons over the past year.
The stablecoin issuing companies exchanged profits for gold bars, and four months later stood guard alongside retail investors who chased highs at the end of January. The crypto world and the traditional world borrowed from each other’s homework, and this time both were called out by the teacher together.
De-leveraging has a characteristic: it does not differentiate between the quality of assets, only the quality of liquidity. Therefore, its way of ending is also unrelated to fundamentals. Forced selling clears out positions, and the downward trend will stop on its own.
The question is, how to judge when all positions have been sold cleanly? Historically, there are actually two nearly identical scripts that can be borrowed.
The script of 2022, this time just finishing the fourth month
Gold bear markets are not frequent, but each opening is quite similar.
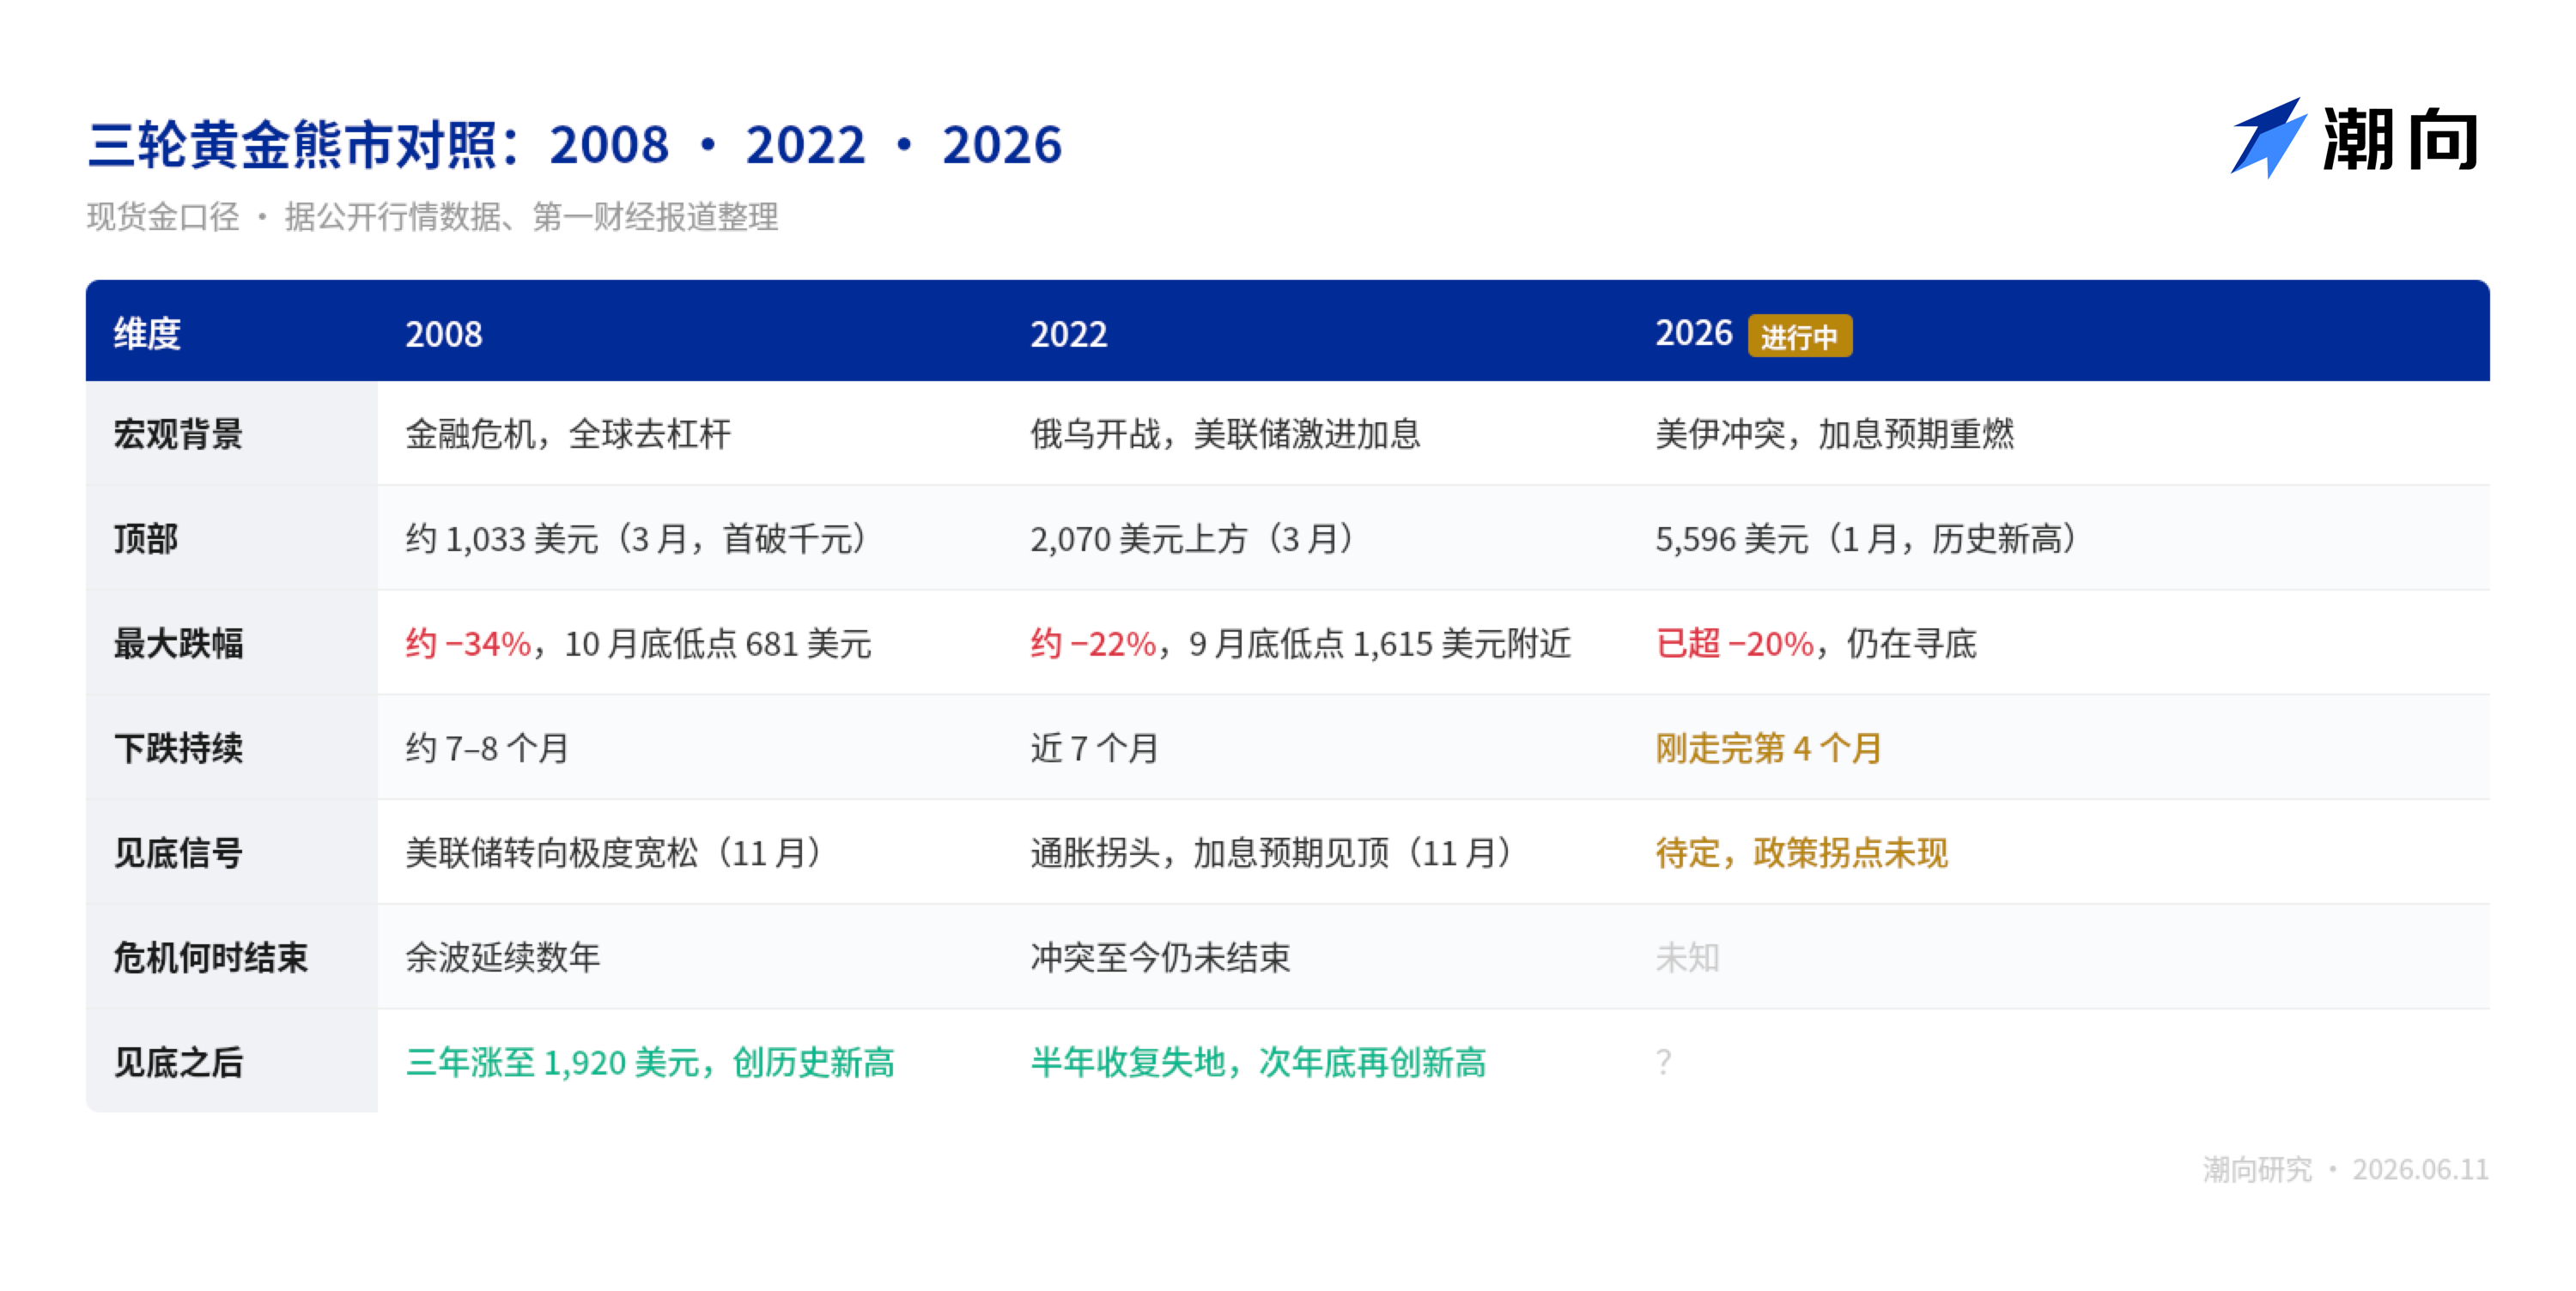
The first script is from 2022. According to public market data, spot gold started around $1800 before the Russia-Ukraine war and surged above $2070 after the war began. Then in March of that year, the Federal Reserve began aggressive rate hikes, and gold prices turned around, falling for nearly seven months, hitting a low near $1615 by the end of September, completely giving back all gains made before the war.
In early November, gold prices found their bottom, recovering all lost ground six months later, and thereafter surged into a bull market that reached January of this year.
War, along with tightening. The current structure is almost identical.
The second script is from 2008. According to public market data, during the Lehman crisis, gold was also initially sold off along with the stock market, breaking the $1000 high for the first time in March, falling to $681 by the end of October, and declining by more than 30%. Subsequently, the Federal Reserve turned to extreme easing, gold prices bottomed in November, and soared to a historic high of $1920 three years later.
There is one common point in these two scripts: the signals for gold prices hitting the bottom have never been related to ceasefires; they are recognized at policy inflection points.
The bottom in 2008 appeared when the Federal Reserve turned to massive liquidity; the bottom in 2022 appeared when inflation data turned and rate hike expectations peaked. The most convincing counterexample is that the Russia-Ukraine conflict has not yet ended, but gold had already reached a historical high by the end of 2023.
Those waiting for a ceasefire to buy the dip may face missing the opportunity.
Looking to time this perfectly, from the peak at the end of January, gold has gone through just the fourth month of decline this time. In that round in 2022, it fell for nearly seven months.
However, it is important to note that this round has a variable that was not present in 2022: central bank gold reserves.
The structural adjustment of foreign exchange reserves among various central banks is key; the gold market’s size is much smaller than that of U.S. Treasury bonds, and any slight repositioning by major U.S. Treasury holders can relatively have a large impact on gold prices. Central bank buying should provide a thicker floor than in the last cycle.
Buying the dip requires waiting for several signals
With gold prices having fallen this much, voices advocating for buying the dip have already begun to emerge. However, I think we should first clarify two things:
First, how much deeper can it still fall; second, what should the inflection point look like.
First, about the depth. According to Yicai Global, Citigroup this week lowered its three-month gold target price from $4300 to $4000, and additionally warned that if the Hormuz blockade extends to the end of summer, gold prices could fall to $3500. This is already Citigroup’s second revision in a month.
Investment bank target prices are not necessarily accurate, but they mark the lower limit of this round of declines in the eyes of institutions. From the current position downward, the pessimistic scenario still retains about 15% of room for decline.
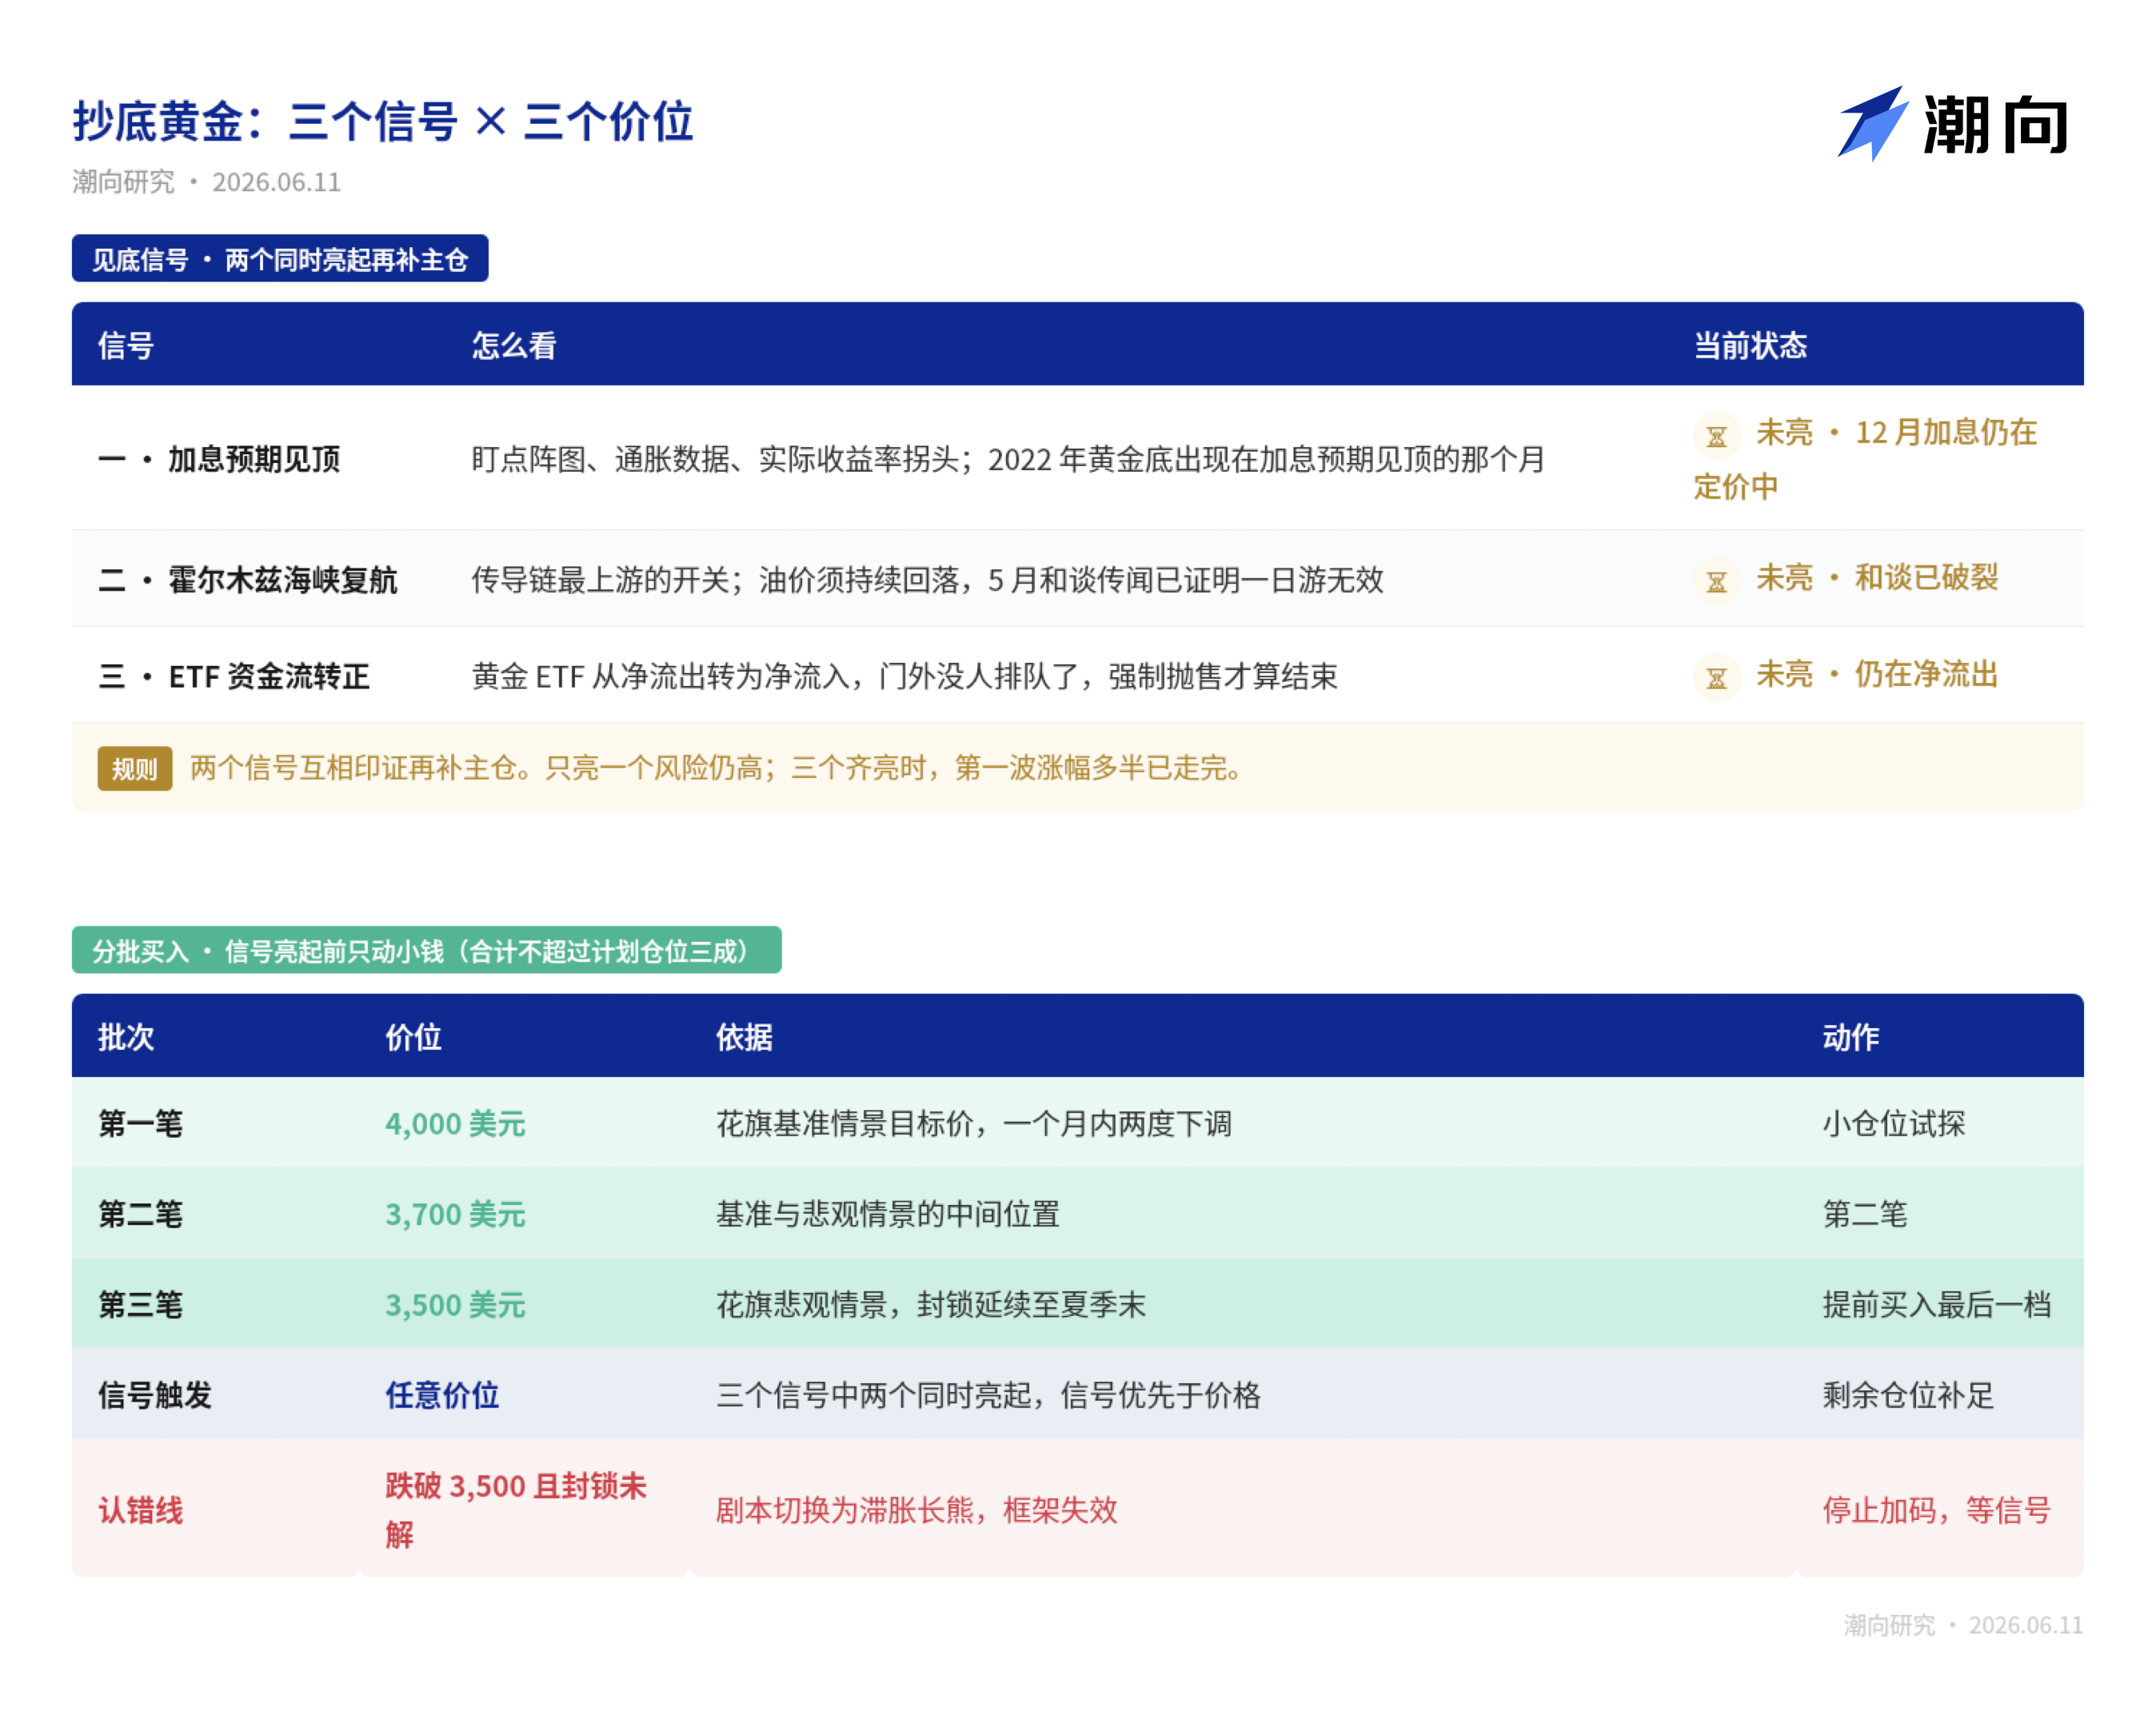
Next, regarding the inflection point. I believe that three signals are worth monitoring:
- Signal 1: Peak of rate hike expectations.
As mentioned earlier, the engine of this bear market is interest rates. The bottom for gold in 2022 was exactly in the month when rate hike expectations peaked. If that year-end rate hike indeed materializes, the drop will itself likely serve as a reversal point.
Next week the Federal Reserve will deliberate; there is virtually no suspense in their decision to hold rates steady. What is truly worth watching are the dot plots and the tone of the press conference which will determine whether the year-end rate hike is an endpoint or a starting point.
- Signal 2: Resumption of navigation in the Strait of Hormuz.
It is the upstream switch of the entire transmission chain. If the strait opens up, oil prices can drop, and if oil prices fall, inflation can ease, then only then will rate hike expectations retreat. But note that the previous peace rumors in May have already proven that just having ceasefire news is not enough; oil prices must continuously drop, otherwise, the transmission chain won't reach the bottom.
- Signal 3: Transition of ETF funds from net outflow to net inflow.
As mentioned earlier, the direct executors of this round of decline are leveraged positions and ETF redemptions. Gold ETFs are the quickest escape routes for liquidation. When there is no longer a line outside the door, that is when forced selling will end.
That's the analysis of the signals, and here are my personal thoughts that may not necessarily be correct, just for reference.
No one can predict the bottom accurately. The logic here is that the engine of this bear market is rate hike expectations, and the market is currently pricing in a one-time 25 basis point hike at the end of the year.
From $5596 to the current $4130, gold prices have already dropped nearly 26%, digesting most of the "from no hikes to one hike" narrative. If rate hike expectations do not worsen further, the downward space continues to narrow.
A few public reference points can help anchor the range:
Citigroup's baseline and pessimistic scenarios point to $4000 and $3500 respectively; during the 2008 bear market, gold dropped by 34%, which would translate to around $3700 now; that round in 2022 fell by 22%, corresponding to $4365.
My approach would be to divide purchases into three parts within this range: the first at $4000, the second at $3700, and the third at $3500, not exceeding 30% of my planned allocation, and preparing for being stuck (this is not investment advice, only my personal opinion).
Dividing the purchases is not because I’ve pinpointed the bottom, but precisely because I haven’t, using dispersion to hedge against the cost of misjudgment.
Whenever two of the three signals light up simultaneously, the remaining position should be fulfilled; by that time, the price will likely be far from its lowest point, but exchanging a small increase for certainty is the most cost-effective part of the whole approach. However, if $3500 is breached and the strait's blockade remains unresolved, it would be better to stop adding positions and wait for signals more patiently.
In conclusion, buying gold during chaotic times is not necessarily wrong; however, keeping an eye on interest rates is more useful than focusing on war.
Conflict of interest: the author holds gold

The views expressed in this article are solely those of the author and do not constitute any investment advice. The price levels, signal frameworks, and position thoughts mentioned in the article are personal analysis records and should not be used as a basis for buying or selling.
The market carries risks; decisions should be made independently.
Data sources: Yicai Global · Daily Economic News · Blue Whale Finance · Financial Alliance News · Sina Finance · CME FedWatch · Refinitiv (LSEG) · FactSet · Citigroup research reports · CICC research reports · Yahoo Finance market data
Trend Research · June 2026
免责声明:本文章仅代表作者个人观点,不代表本平台的立场和观点。本文章仅供信息分享,不构成对任何人的任何投资建议。用户与作者之间的任何争议,与本平台无关。如网页中刊载的文章或图片涉及侵权,请提供相关的权利证明和身份证明发送邮件到support@aicoin.com,本平台相关工作人员将会进行核查。


