Today! I will teach you an exclusive theory worth millions of dollars that I have been using for trend analysis over the years!
As long as you master this simple method, you can profit steadily in a bull market and exit in time in a bear market!
Compared to the complicated and difficult to understand Gann, Dow Theory, and Elliott Wave Theory, my “One Yang Finger” strategy is straightforward and easy to understand, focusing solely on one line: the MA377 daily moving average.
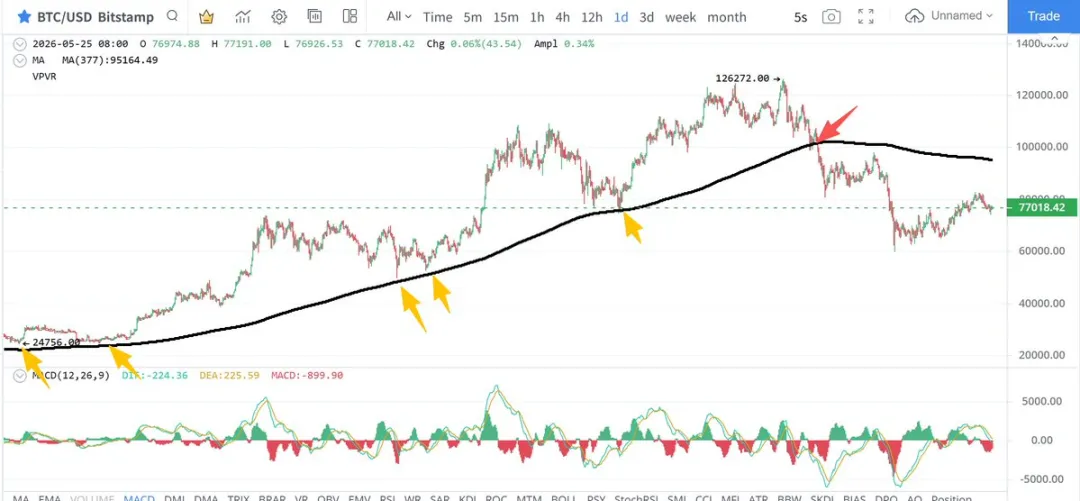
Please look at the Bitcoin candlestick chart I screenshot for everyone!
In a bull market phase, as long as Bitcoin tests the MA377 daily moving average without breaking down, the upward trend will continue;
In a bear market phase, as long as Bitcoin bounces but cannot break through the MA377 daily moving average, the downtrend will not end.
It can be verified from the chart: at the yellow arrow positions in the image, every time it tests the MA377 moving average, the market continues to rise; while at the red arrow positions, once it breaks down the MA377 moving average effectively, the market directly enters a bear market.
Be sure to save this! This strategy will only be shared this once.
For more valuable content, follow the public account: Big Bull Says Market
免责声明:本文章仅代表作者个人观点,不代表本平台的立场和观点。本文章仅供信息分享,不构成对任何人的任何投资建议。用户与作者之间的任何争议,与本平台无关。如网页中刊载的文章或图片涉及侵权,请提供相关的权利证明和身份证明发送邮件到support@aicoin.com,本平台相关工作人员将会进行核查。


