Among all top K-line patterns,the arc top is the most concealed and the easiest to trap people.
It lacks the sudden panic of a long spike drop, nor does it have the decisive selling pressure of a large bearish candle; the entire topping process is extremely slow: slowly rising, slowly stagnating, slowly retreating, gradually wearing down the patience of the bulls. Also, because the trend seems bland, many traders mistakenly interpret high-level sideways movements as accumulation and consolidation by major players, hesitating to take profits and ultimately getting trapped. This article will help everyone thoroughly understand the arc top, grasp its formation logic, recognition techniques, and practical usage to avoid this "boiling frog" type of topping trap.
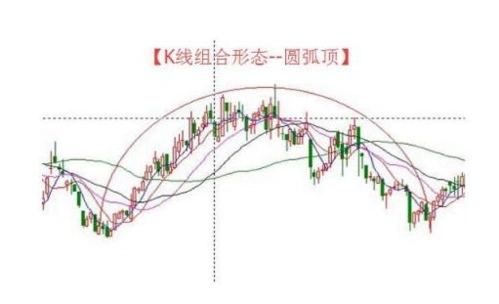
1. What is the Arc Top? (Simple Definition)
The arc top, also known as the round top or the pot lid top, is aslow-paced bearishreversal pattern, which almost always appears at the end of a continuous uptrend, serving as a typical signal of a market top at the end of a rally.
Its visual characteristics are easily identifiable:
The speed of price increase gradually slows down, no longer making new highs, then the price center slowly shifts downward, and the overall K-line trend forms a rounded arc that rises upward, resembling an inverted pot lid, with smooth movement and no abrupt highs or lows.
Comparing it with the well-known V-shaped top, the differences are clear:
V-shaped top: rapid rise and drop, the top comes quickly, and the selling pressure is fierce, with signals being straightforward and hard to get trapped
Arc top: the rise and fall rhythm is dragged and smooth, the transition between long and short is gradual, without violent fluctuations, highly deceptive
2. Formation Logic of the Arc Top (Truth of Capital and Emotion)
All K-line patterns essentially reflect the real behavior of market capital and the emotions of retail investors. The formation of the arc top is the complete process in which bullish strength gradually weakens, and bearish strength gradually takes over, divided into three stages:
1. End of Rise: Bulls Exhausted, Pure Inertial Surge
After a continuous upward trend, the buying funds in the market are almost exhausted, and new capital is unwilling to enter the market. However, the bullish sentiment still exists, and there is no concentrated selling pressure, leading to a slight upward price movement driven by inertia, the increase becomes smaller, and the K-line's body narrows, visibly decreasing the bullish momentum.
2. Arc Top: Bulls and Bears Stalemated, High-Level Grinding
The bulls completely lose the ability to make new highs, and traders holding profitable positions begin to take profits step by step, but the bears have not yet launched a concentrated selling attack. At this point, the strength of bulls and bears is temporarily balanced, and the price oscillates repeatedly at a high level, moving up and down with a very small amplitude. This stage is most likely to mislead people; many will wrongly believe it's a period of accumulation and consolidation, when in fact it's a sign that the major players are quietly distributing and the market is about to change.
3. Breaking Down: Bears Take Control, Trend Reversal
The longer the sideways movement at a high level lasts, the weaker the confidence in positions becomes. As profits continue to exit and trapped bulls start to cut losses, the bears gain an overwhelming advantage, and the price center continues to shift downward, completing the full arc top formation; the original upward trend officially ends and transitions into a downward trend.
3. Core Identification Features of the Arc Top (Preventing Misidentification)
Many novices often mistake ordinary high-level fluctuations for arc tops, missing opportunities or getting trapped. Remember these three exclusive features to accurately distinguish between true and false patterns:
1. Smooth Trend Rhythm, Natural Transition
There are no violent fluctuations throughout, no long upper shadows enticing buyers, and no sudden large bearish candles. The overall trend is gradual, first a slow rise, then a horizontal top, followed by a slow drop, with smooth connections between highs and lows, without any abrupt rises or falls.
2. Volume Peaks on Both Ends, Contracting in the Middle
The volume rules of the arc top are very fixed: during the early rising stage, the trading volume gradually expands; during the top grinding phase, the volume continues to contract to a very low level; when the formation is nearing its end and the price breaks down, the volume will increase again, which is also the core signal of the formal establishment of the pattern and the concentration of capital exit.
3. The Larger the Cycle, the Higher the Reliability of the Signal
Arc tops in small cycles like 15 minutes or 1 hour have short durations and high randomness, offering very little reference value. However, arc tops at the 4-hour and daily levels are real traces of large funds gradually exiting, with a very high rate of reversal success, and the subsequent downward space and cycle will also be larger.
4. Practical Trading Signals for the Arc Top
When trading arc tops, the biggest taboo is guessing tops to short. A prudent approach is to wait for the pattern to confirm, with two core signals:
1. Warning Signal: Continuous Downward Shift in High-Level Price Centers
When the market completely stops making new highs and continually shows a "lower high and lower low" pattern, along withdeclining volume at high levels, it indicates that bulls have completely exited. Holders can reduce long positions in advance to avoid falling risks, while those without positions should observe temporarily and not blindly accumulate positions.
2. Core Signal: Volume Breaks Neckline (Ultimate Sell Signal)
Draw a horizontal neckline by connecting the low points on both sides of the arc pattern; this is the core support level of the arc top. Once the price falls below the neckline with increased volume, it signifies that the arc top pattern is officially established, and the trend has fundamentally reversed, serving as the most reliable signal to exit long positions and enter short positions.
In most cases, after the breakdown, the market will slightly pull back to test the effectiveness of the support turning into resistance. If it cannot hold above the neckline during the pullback, it represents a second-best shorting opportunity, which is also the main entry point for prudent traders.
5. Calculating Downward Space after the Arc Top
The subsequent decline amplitude of the arc top has a simple and practical calculation formula with strong practical applicability:
Downward Target Space = Price at the Highest Point of Arc Top - Price at the Neckline
In simple terms, the vertical drop from the top to the neckline is the probable decline amplitude after the breakdown. The larger the pattern's cycle and the longer the time spent in a high-level grind, the stronger the subsequent downward momentum and continuity.
6. Common Pitfalls for Novices
1. Mistaking High-Level Grinding for Accumulation
The high-level declining volume at the arc top is the most misleading trend for novices. Many people observe that prices are neither falling nor rising and subjectively believe it's a major player accumulating positions, leading them to increase their long positions, only for the market to break down and trap them deeply. In reality, prolonged stagnation at high levels with exhausted volume signifies the bulls' inability to counterattack and the subtle exit of capital.
2. Guessing Tops in Advance and Shorting Against the Trend
The formation speed of the arc top is extremely slow, and small rebounds that entice buyers will frequently occur during the formation process. Many people attempt to short too early, only to be repeatedly stopped out. Remember: arc top trading should only involve confirmation trades and not speculative trades; wait for the neckline to break before trading in the direction of the trend.
3. Ignoring the Risks of Larger Cycle Patterns
Small cycle arc tops can be overlooked, but daily and 4-hour large cycle arc tops belong to the high-level reversal signal. Once confirmed, they often correspond to a medium to long-term downward trend; never hold out hope and stubbornly cling to positions, or losses will continue to amplify.
7. Core Summary
The essence of the arc top is the process in which market sentiment transitions from excited frenzy to numb observation, and finally to complete panic.
It lacks a fierce falling trend and is highly deceptive, but once formed, the continuity and destructive power of the decline are very strong.
Remember this practical guideline: When the arc is formed, the bulls are exhausted; when the neckline breaks, the decline follows; do not cling to long positions at high volume; failing to hold the pullback is a short opportunity.
For more useful content, follow: Great Bull Talks about the Market
免责声明:本文章仅代表作者个人观点,不代表本平台的立场和观点。本文章仅供信息分享,不构成对任何人的任何投资建议。用户与作者之间的任何争议,与本平台无关。如网页中刊载的文章或图片涉及侵权,请提供相关的权利证明和身份证明发送邮件到support@aicoin.com,本平台相关工作人员将会进行核查。