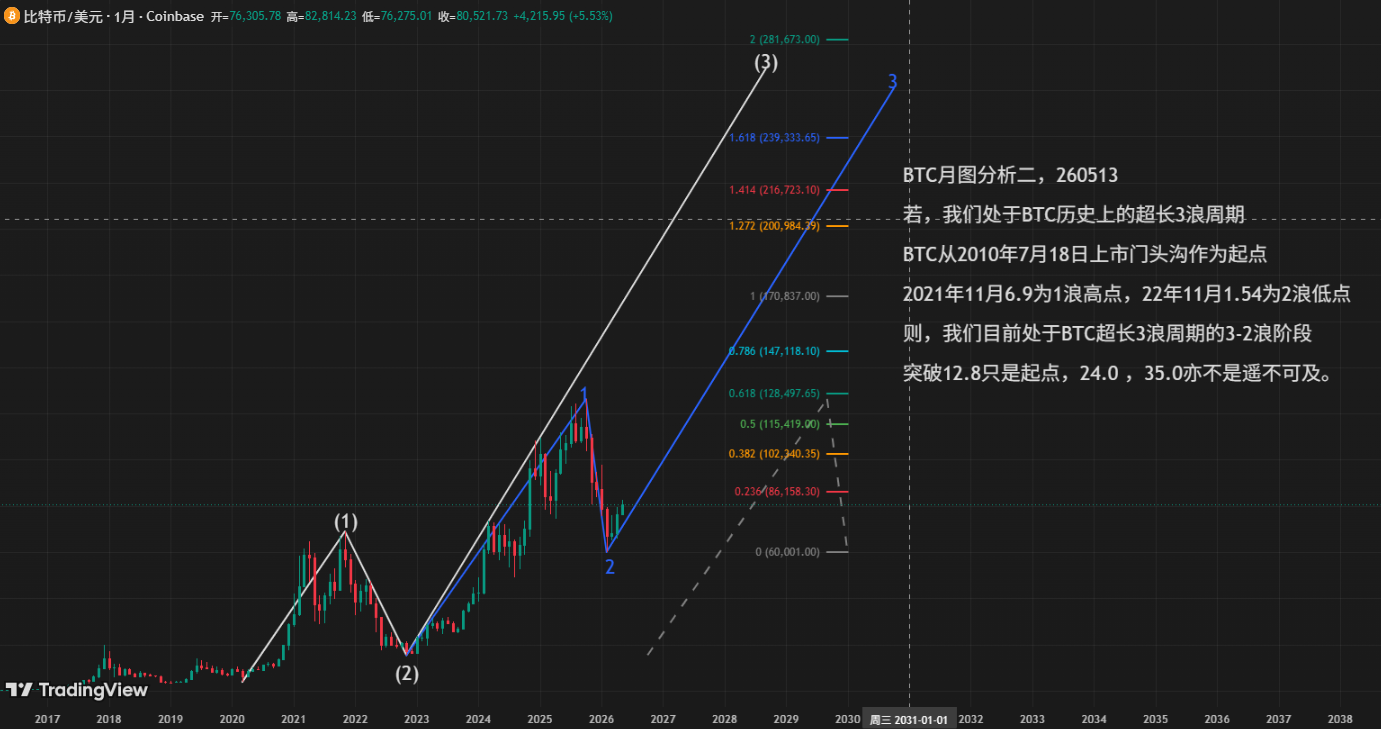
As shown; Bitcoin's trend from its launch in 2010 to now is defined as a "super wave 3" driving cycle within the framework of Elliott wave theory. Let's first clarify the timeline:
Starting point: July 2010, Bitcoin was officially listed on the Mentougou Exchange, initiating the entire super wave 1.
Wave 1 peak: $69,000 in November 2021, which marks the end of wave 1.
Wave 2 low: $15,400 in November 2022, which completed the correction wave of the entire major cycle and also laid the groundwork for the subsequent wave 3.
Now: We are currently at the end of the correction of wave 3-2 in the major wave 3 that began from the low in 2022; what comes next will be the most powerful main rising wave 3-3 in the entire cycle.
What stage are we actually in now?
Many people panic when they see a correction, but in wave theory, wave 3-2 is the most tedious stage before the main rising wave.
From the $15,400 in November 2022 to the peak in 2025, this is the rising segment of wave 3-1; the current decline from the peak is the correction of wave 3-2.
The characteristic of this stage is a fluctuating base, with prices fluctuating back and forth near Fibonacci support levels, washing out uncertain hands. As long as the monthly chart does not fall below key support, the correction is merely a buildup of energy, not a trend reversal.
The blue trend line in the chart is the lifeline of the entire rising channel. Currently, the price is still steadily operating within the channel, and the correction has not broken the lower boundary, indicating that the upward trend has not been damaged at all; the current adjustment is simply setting the stage for the subsequent main rising wave.
Which positions must be closely monitored?
This chart uses Fibonacci extension lines to clearly mark the key nodes of wave 3, with each price level having its special significance:
$86,000 (0.236 extension level): extreme strong support
This is the bottom line for the correction of wave 3-2. As long as the monthly chart does not effectively break below here, the entire wave structure still holds, and the logic of the main rising wave remains intact.
$102,000 (0.382 extension level): short-term consolidation range
The current price is oscillating near this support level, with intense bullish and bearish competition, which is the core range of the base building stage.
$128,000 (0.618 extension level): confirmation of main rising wave
The chart clearly states: “Breaking $128,000 is just the starting point.” This level is not only a key Fibonacci extension level but also a strong resistance near previous historical highs. Once effectively broken, the upward trend at the monthly level will completely open up, and the subsequent target positions will have the foundation for realization.
$240,000, $350,000 (1.618/2.0 extension levels): medium-term target positions
These are reasonable projections based on wave theory. Major wave 3 is the strongest segment of the impulsive wave, with an increase typically 1.618 times or more than wave 1, so these numbers are not random guesses, but references from historical cycles and technical patterns.
How to respond at different stages?
Short-term: oscillating base, do not panic or be greedy
Now in the late stage of wave 3-2, the market sentiment can easily be destabilized by fluctuations.
Don't panic: If the support level is not broken, the trend is not broken; a slow decline and bottoming is normal, not a signal of collapse.
Don't be greedy: Don’t rush in at small rebounds; most of the current rebounds are traps to lure in buyers, not reversals.
The most stable approach at this stage is to wait and watch for a confirmed bullish candlestick on the monthly chart before considering action.
Mid-term: closely monitor for the breakthrough signal at $128,000
The $128,000 position is the "watershed" of the entire market.
Volume breakout: Once the price stabilizes above $128,000 accompanied by increased trading volume, it will be a signal for the start of wave 3-3, and the subsequent upward space will be thoroughly opened up.
False breakout with retracement: If it spikes up and then falls back, that is a second washout, indicating that wave 3-2 has not completed and still needs to continue bottoming.
Before the breakout, all rebounds are just rebounds; only after the breakout does the trend begin.
Long-term: trend remains intact, corrections are all opportunities
Looking at the historical cycles of Bitcoin, major bull markets are never achieved overnight; the main rising wave often explodes in the latter half of the market.
The current correction of wave 3-2 is like a warm-up before a long race, wearing off unsettled hands and allowing true trend traders to stay. As long as the upward channel remains intact, the long-term view is still upward; corrections are just low entry opportunities for trend traders.
Risks
No matter how favorable the market looks, risks cannot be ignored.
The biggest risk is an effective monthly level drop below the strong support at $86,000, or even a drop below the lower boundary of the upward channel. If this situation occurs, the current wave structure will need to be re-corrected, and entry into a larger adjustment cycle cannot be ruled out.
Wave theory is only a probabilistic technical analysis, not a universal truth; external news, regulatory policies, and changes in the macro economy can all alter the rhythm of the market.
In trading, the most feared situation is panicking during the correction phase and missing out on the market in the main rising wave.
The core message from this chart is not to urge you to go all in immediately but to inform you: the current adjustment is likely a buildup before the main rising wave, not the end of the trend.
Control your hands, keep a close eye on key support and breakthrough signals, and patiently wait for the trend to confirm; this is much more reliable than chasing highs and cutting losses.
Trading is not divine; do not blame profits and losses. The above analysis is for reference only and does not constitute investment advice.
Public account: Big Bull Says Market
免责声明:本文章仅代表作者个人观点,不代表本平台的立场和观点。本文章仅供信息分享,不构成对任何人的任何投资建议。用户与作者之间的任何争议,与本平台无关。如网页中刊载的文章或图片涉及侵权,请提供相关的权利证明和身份证明发送邮件到support@aicoin.com,本平台相关工作人员将会进行核查。