Cryptocurrency Expert: The volatility and repair momentum of Bitcoin on April 8, 2026, is highlighted, with solid support from moving averages, and a new round of rebound market is about to start! Latest market analysis
The current price of Bitcoin is 68,600. The recent price trend of Bitcoin really leaves people puzzled. After a sharp drop from the high point, it started to rebound around the 60,000 mark, and the current price is fluctuating around 68,600. Both bulls and bears are pulling at this critical position, neither side is willing to easily concede, and countless people are chasing highs and cutting losses, getting hit on both sides. In fact, this is a time that tests one's mentality the most; instead of frequent trading, it is better to watch more and act less, waiting for clear signals from the market before taking action. After all, in a volatile market, waiting is also a strategy. Preserving principal enables one to seize future opportunities.
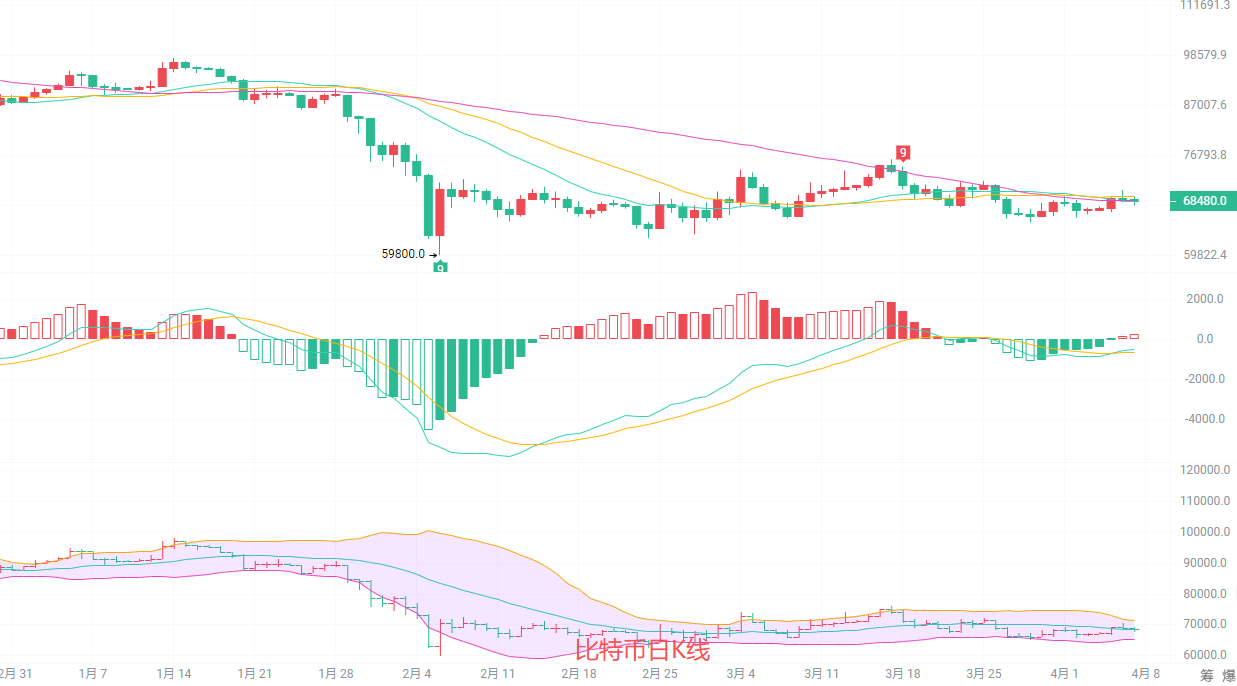
Although the daily candlestick chart retraced slightly by 0.30%, it successfully stood firm above the MA60 support. The MA20 and MA30 are gradually flattening, completely ending the downward trend. The MACD green bars are continuously narrowing, with the DIF quickly crossing above the DEA, and a golden cross is about to form, with ascending momentum consistently surging. The middle track of the Bollinger Band at 68,390 serves as a strong support, with the upper track at 71,541 being the medium-term target. The lower support at 59,800 is solid, overall presenting a bottom-building and rebound trend, entering a rebound cycle of oscillation upward, with the subsequent possibility of challenging the 72,000 mark.
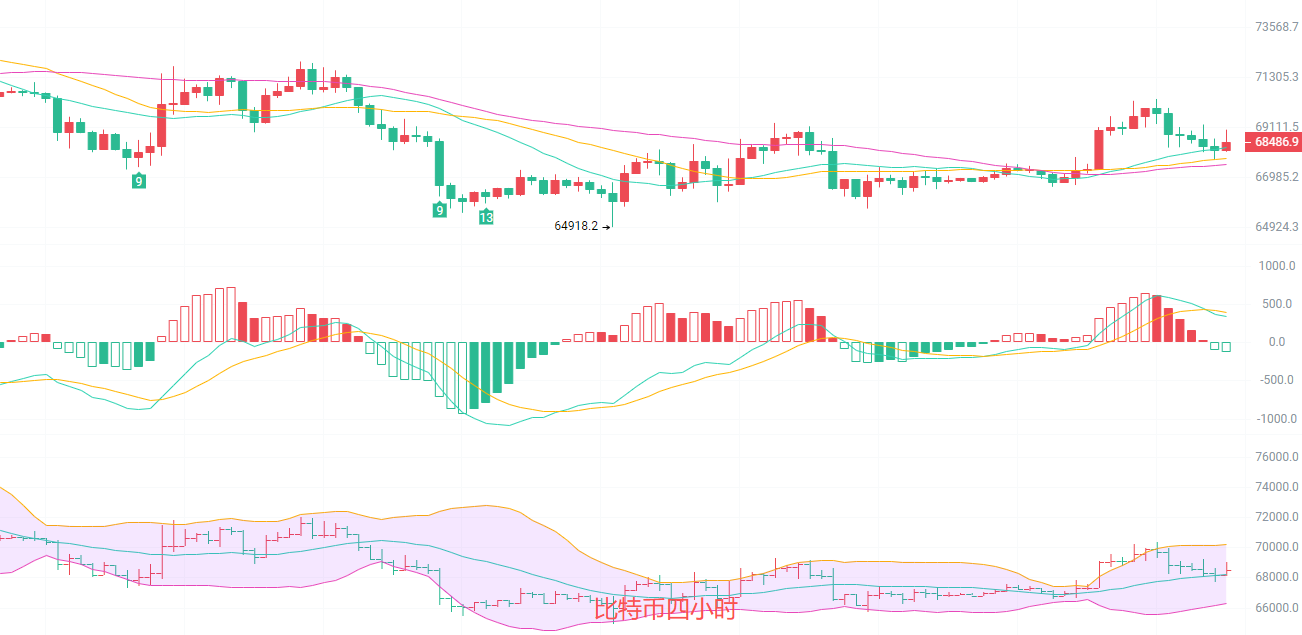
The four-hour candlestick chart has broken through the upper track of the Bollinger Band; in the short term, the moving averages are arranged upward, with MACD golden cross red bars increasing in volume, providing ample upward momentum. However, prices are in the overbought range, indicating a need for correction. The key support at the MA60 line is 67,500. If it bounces back without breaking, the rebound can continue; if it breaks, it will return to oscillation. The middle track of the Bollinger Band at 68,248 serves as strong support, with the upper track at 70,202 facing pressure. The short-term trend is biased towards bullish, with prices situated between the middle track and the upper track, clearly indicating a bullish trend in the short term. The rebound continues, and every pullback is an opportunity to ascend.
Short-term strategy reference: Follow the big cycle trend, small stop-loss, quick entry and exit.
For upward movement from 67,600 to 67,800, set stop-loss at 67,000, target looking at 68,500 to 69,500, breaking point at 70,500.
For downward movement from 70,000 to 70,500, set stop-loss at 70,800, target looking at 69,000 to 68,500, breaking point at 68,000.
Given the current high market uncertainty, it is recommended to primarily observe or test with less than 10% of capital, with strict stop-loss, avoid heavy positions, and refrain from emotional trading.
In the cryptocurrency world, those who are perceptive reap rewards, while those who are late learn only to drink soup, and the oblivious end up taking the loss.
Specific operations should be based on real-time market data. For more detailed information, feel free to consult the author. There may be delays in the publication of articles, and suggestions are for reference only; risks are to be borne personally.

Warm reminder: The above content is solely created by the author of the official account. The advertisements at the end of the article and in the comment section have no relation to the author. Please distinguish carefully, thank you for reading.
免责声明:本文章仅代表作者个人观点,不代表本平台的立场和观点。本文章仅供信息分享,不构成对任何人的任何投资建议。用户与作者之间的任何争议,与本平台无关。如网页中刊载的文章或图片涉及侵权,请提供相关的权利证明和身份证明发送邮件到support@aicoin.com,本平台相关工作人员将会进行核查。