In January of this year, gold reached an all-time high of $5,589. Less than two months later, the gold price dropped to around $4,100, with a peak pullback of 26.6%, marking the worst monthly decline in 43 years.
The direct transmission chain of this round of plummet is not complicated. The U.S.-Iran conflict entered its third week, the Strait of Hormuz was obstructed, and oil prices have risen more than 40% since the conflict broke out. According to data from the U.S. Bureau of Labor Statistics, the February CPI hit a new high since last year, combined with the lagging effects of high tariffs, leading to a sharp increase in market concerns about inflation. The Federal Reserve narrowed its expectation of a rate cut to only once in 2026 in the latest Summary of Economic Projections (SEP), effectively declaring the end of the recent easing cycle. The U.S. dollar index broke above the 100 level, exerting comprehensive pressure on prices of precious and non-ferrous metals.
However, the macro narrative is only half the story. According to analysis from Finance Magnates, the technical break of the 50-day moving average (approximately $4,978) triggered a concentrated liquidation of “crowded long positions,” activating stop-loss and margin call orders one after another. Gold rose from $2,600 to over $5,000 within 12 months, with a large amount of leveraged funds piled up in long positions. When the escalation of conflict pushed oil prices higher instead of gold prices, these crowded positions became the first to be sold off.
The decline in price itself is not the story. The story is: this “geopolitical shock raises inflation, concentrated liquidation of leveraged trades” script has played out at least three times over the past 46 years.
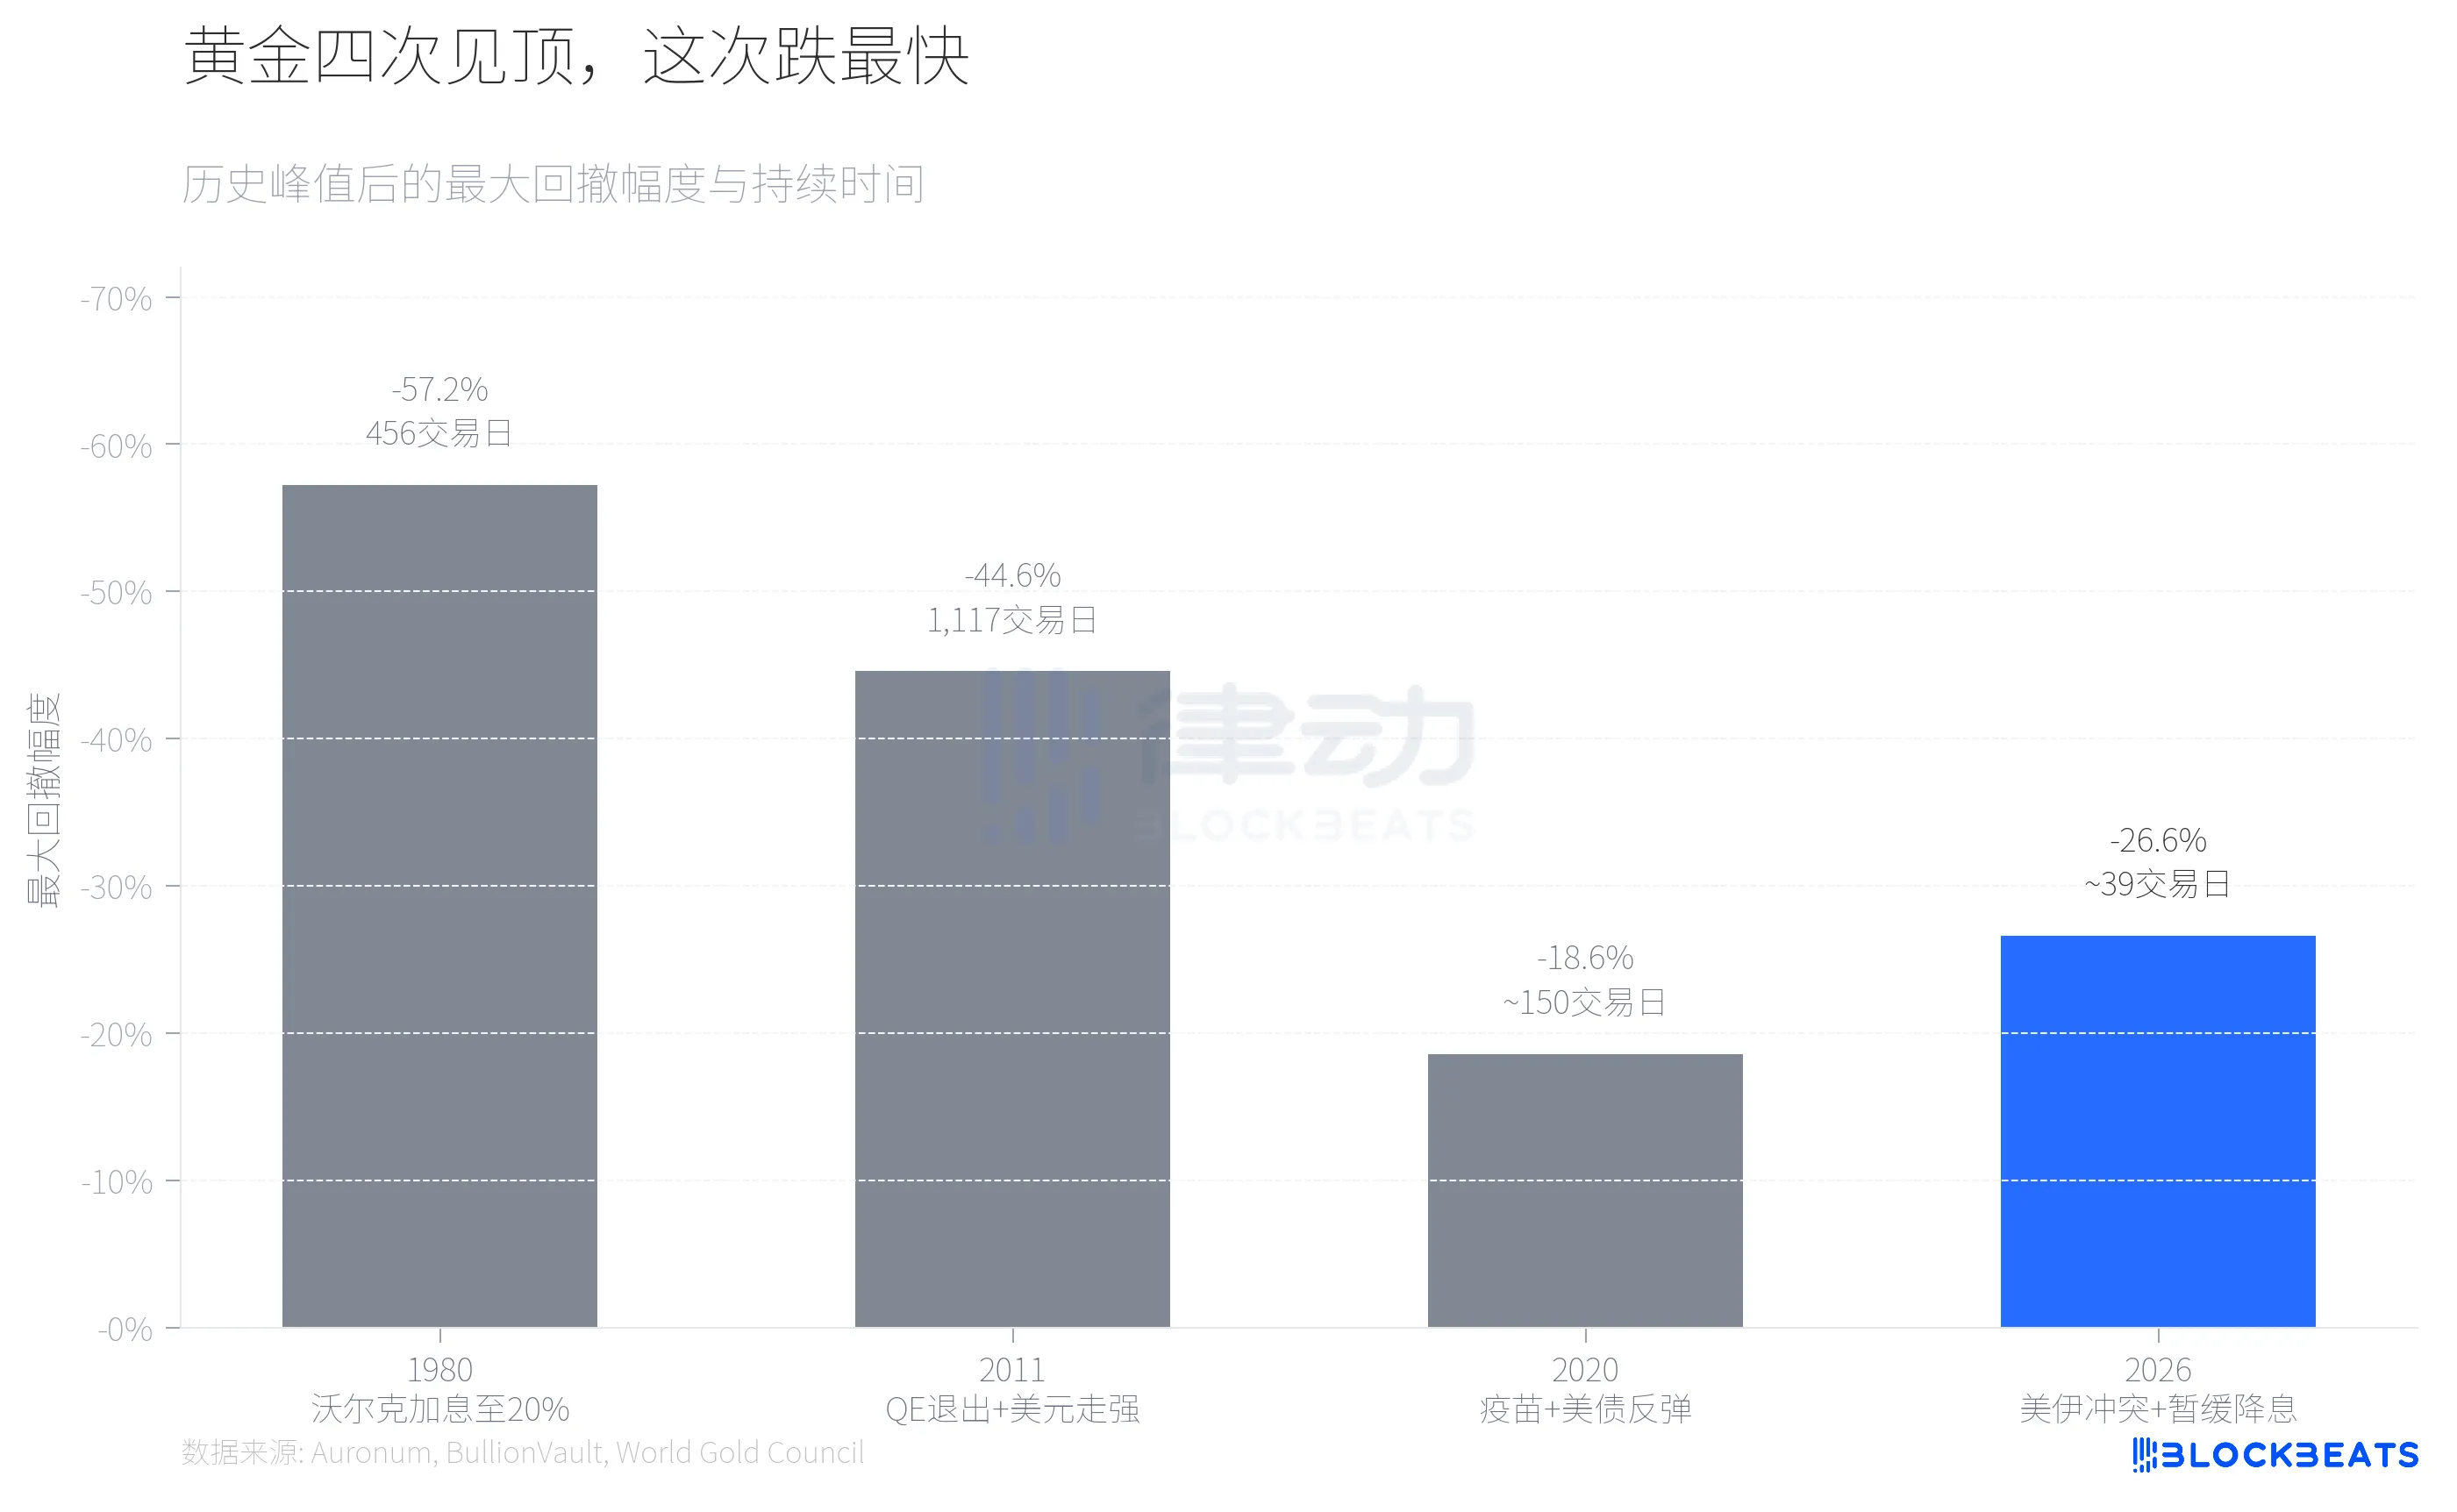
According to historical data compiled by precious metals analysis firm Auronum, in 1980, Volcker raised the federal funds rate to 20%, causing gold to drop from a peak of $711 to $304, a decline of 57.2%, taking 456 trading days. In 2011, compounded by the expectation of QE withdrawal and a strong dollar, gold fell from $1,999 to $1,049, a decline of 44.6%, taking over 4 years. The pullback in 2020 was milder, as the advancement of vaccination and the rebound in U.S. Treasury yields led gold prices to fall 18.6% from a peak of $2,067, but it resumed its upward trend after 7 months.
The current pullback in 2026 is around 27%, already surpassing that of 2020 and approaching that of 2011. But in terms of speed, it is the fastest among the four times.
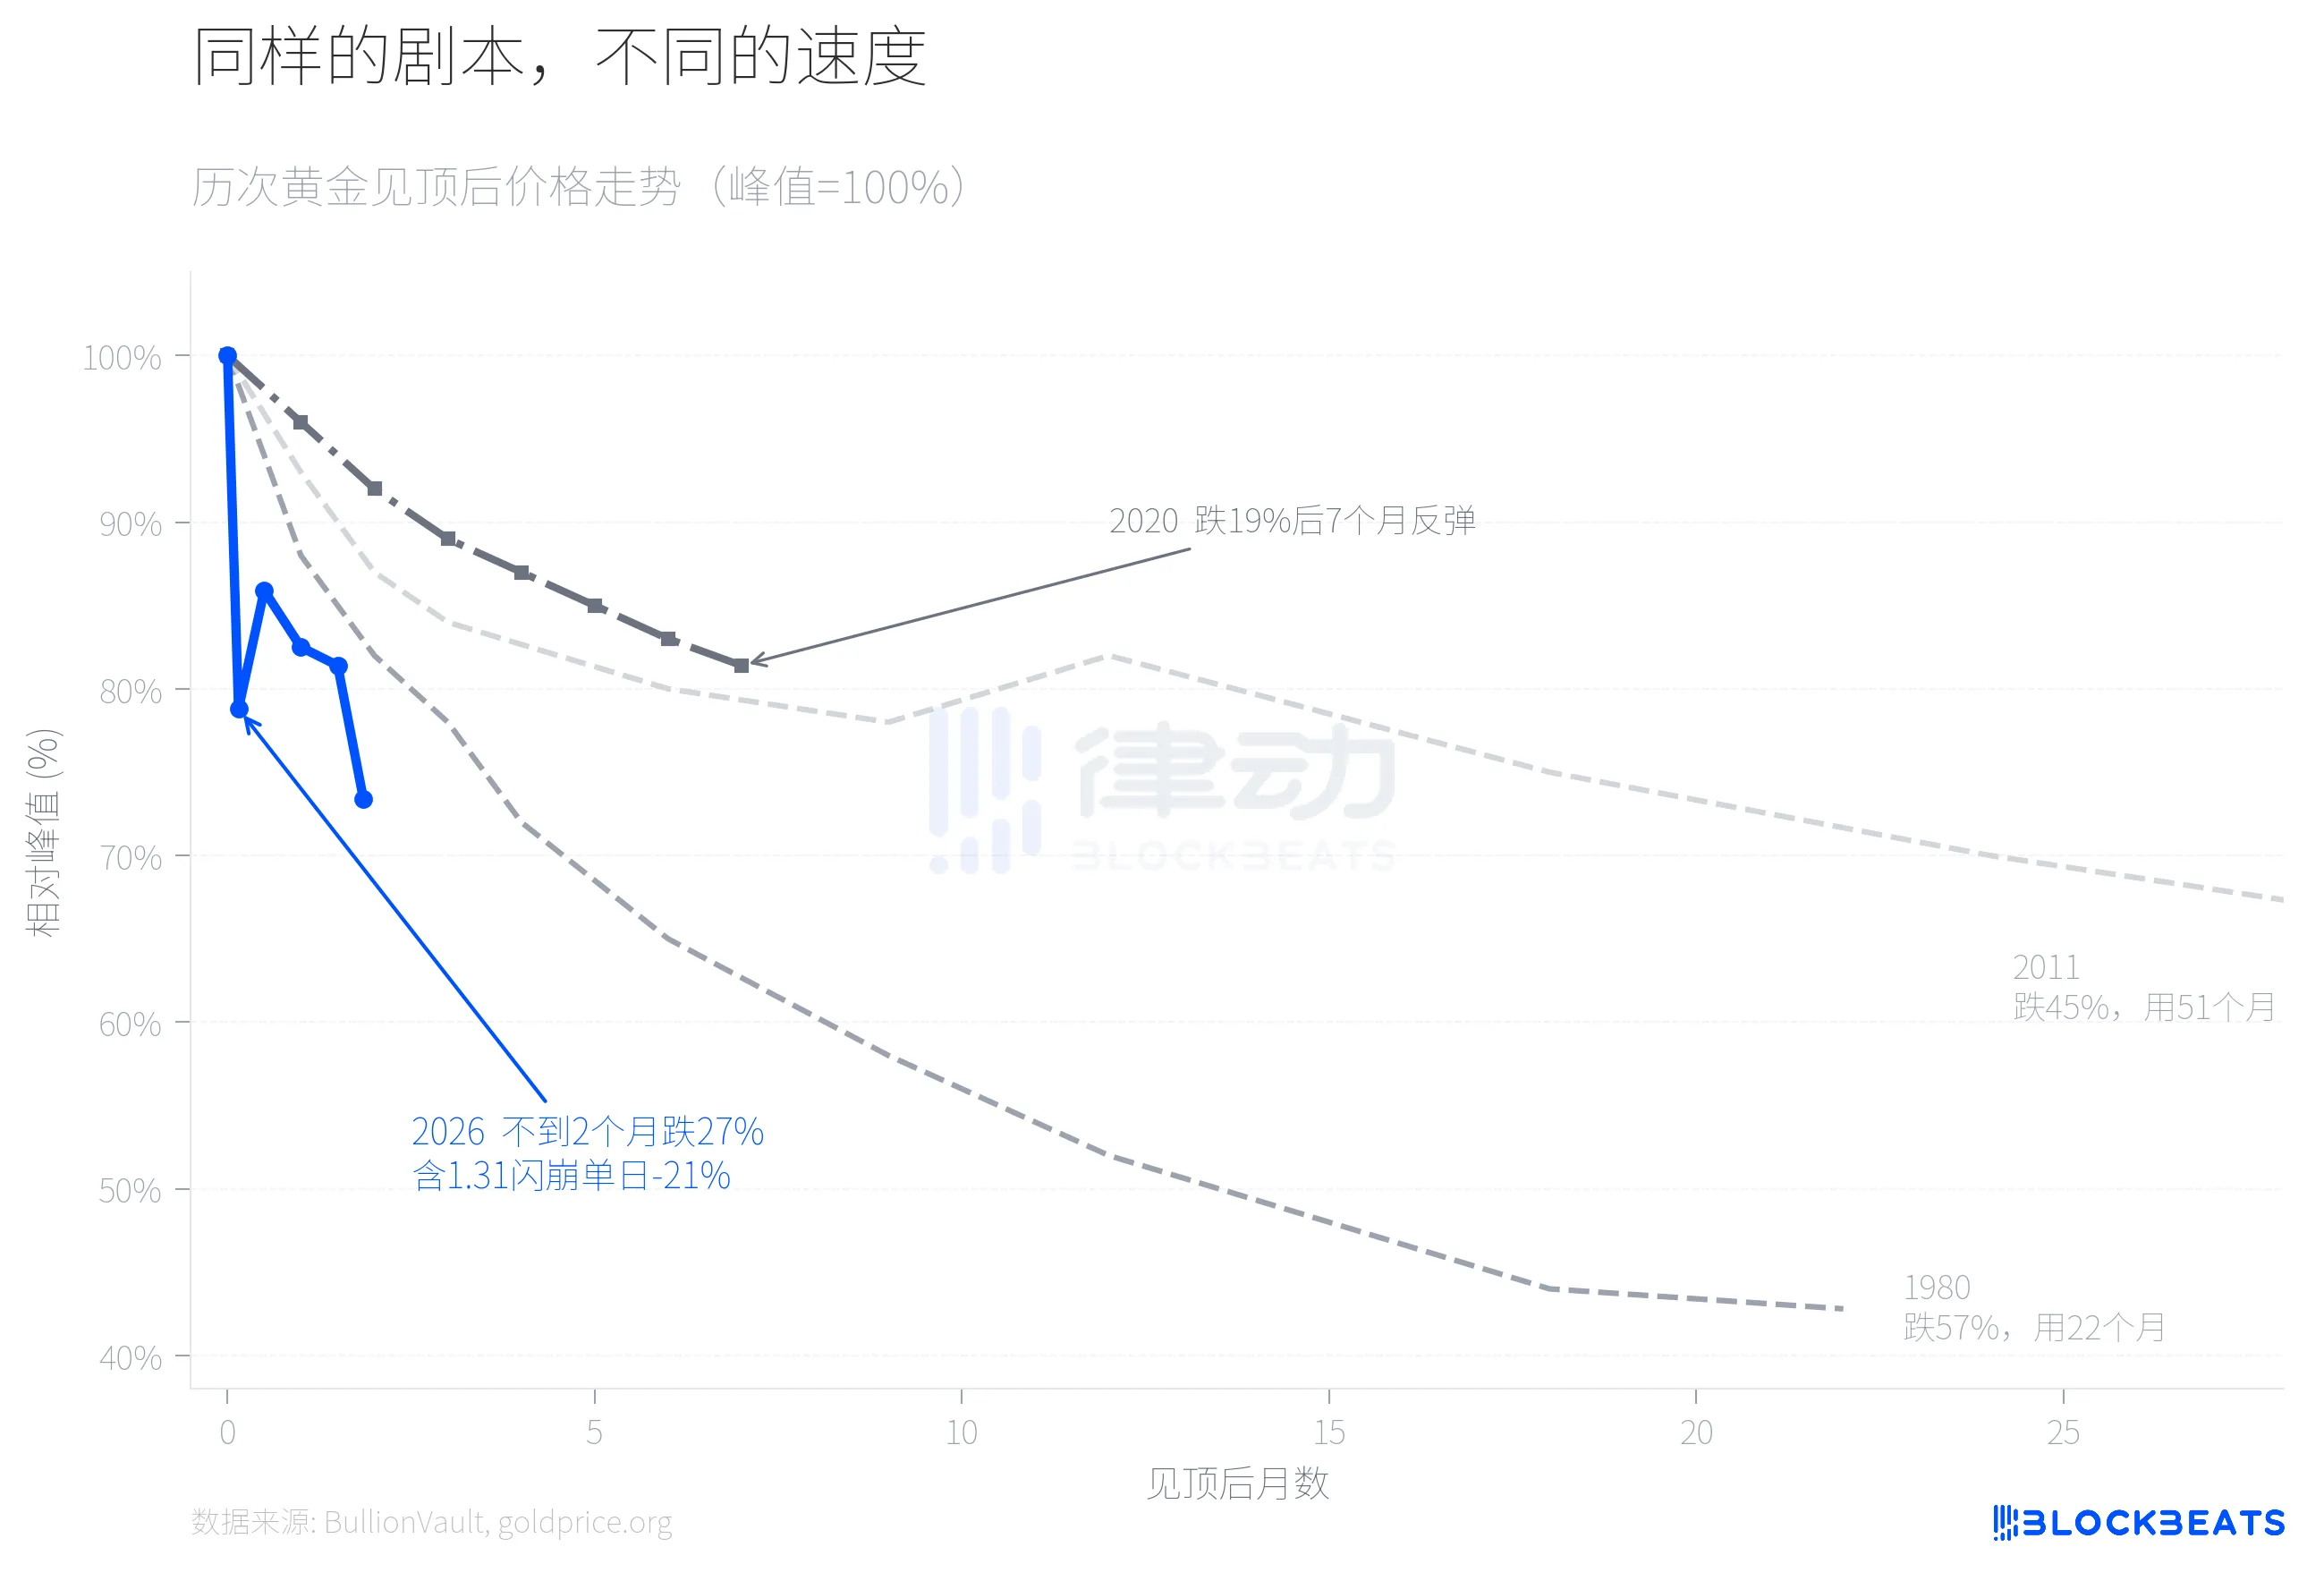
Looking at the price trends of the four pullbacks overlapped, the differences are obvious. The primary decline in 1980 took nearly two years, while in 2011 it took over four years. The gold price in 2026 completed a 21% pullback on the 5th trading day after reaching its peak, followed by a brief rebound, but in the third week of March, it accelerated again to around $4,100, with the total decline expanding to 27%. The flash crash on January 31 was a turning point. According to data from the world’s largest precious metals trading platform BullionVault, gold fell more than 10% that day, and silver plummeted by 13.7%, with iShares Silver ETF (SLV) trading volume exceeding $40 billion in a single day, making it one of the largest single-day trading volumes in U.S. securities history. Bruce Ikemizu, former head of ICBC Tokyo Precious Metals business, commented that he has observed this market for 40 years and “has never seen this level of volatility.”
Why was this speed unusually fast? A key variable is that on January 13, CME changed the COMEX margin system from a fixed amount to a percentage of contract value. According to CME Group data, the margin for gold futures was raised from 8% to 9%, and for silver it increased from 15% to 18%. In a rapidly rising market, percentage margins mean that the higher the price, the more margin is required, creating a self-reinforcing deleveraging mechanism. According to goldsilver.com, on the day of the flash crash, over 67 million ounces of silver paper contracts were forcibly liquidated within minutes.
The performance of silver is a dimension that has been overlooked in this round of decline.
In April 2025, the gold-silver ratio briefly broke 100:1, with silver severely lagging behind gold. Silver then started a surge, with an annual increase of 147% (compared to 67% for gold), compressing the gold-silver ratio, which fell to about 46:1 when silver reached a peak of $121.67 per ounce, the lowest level since 2013.
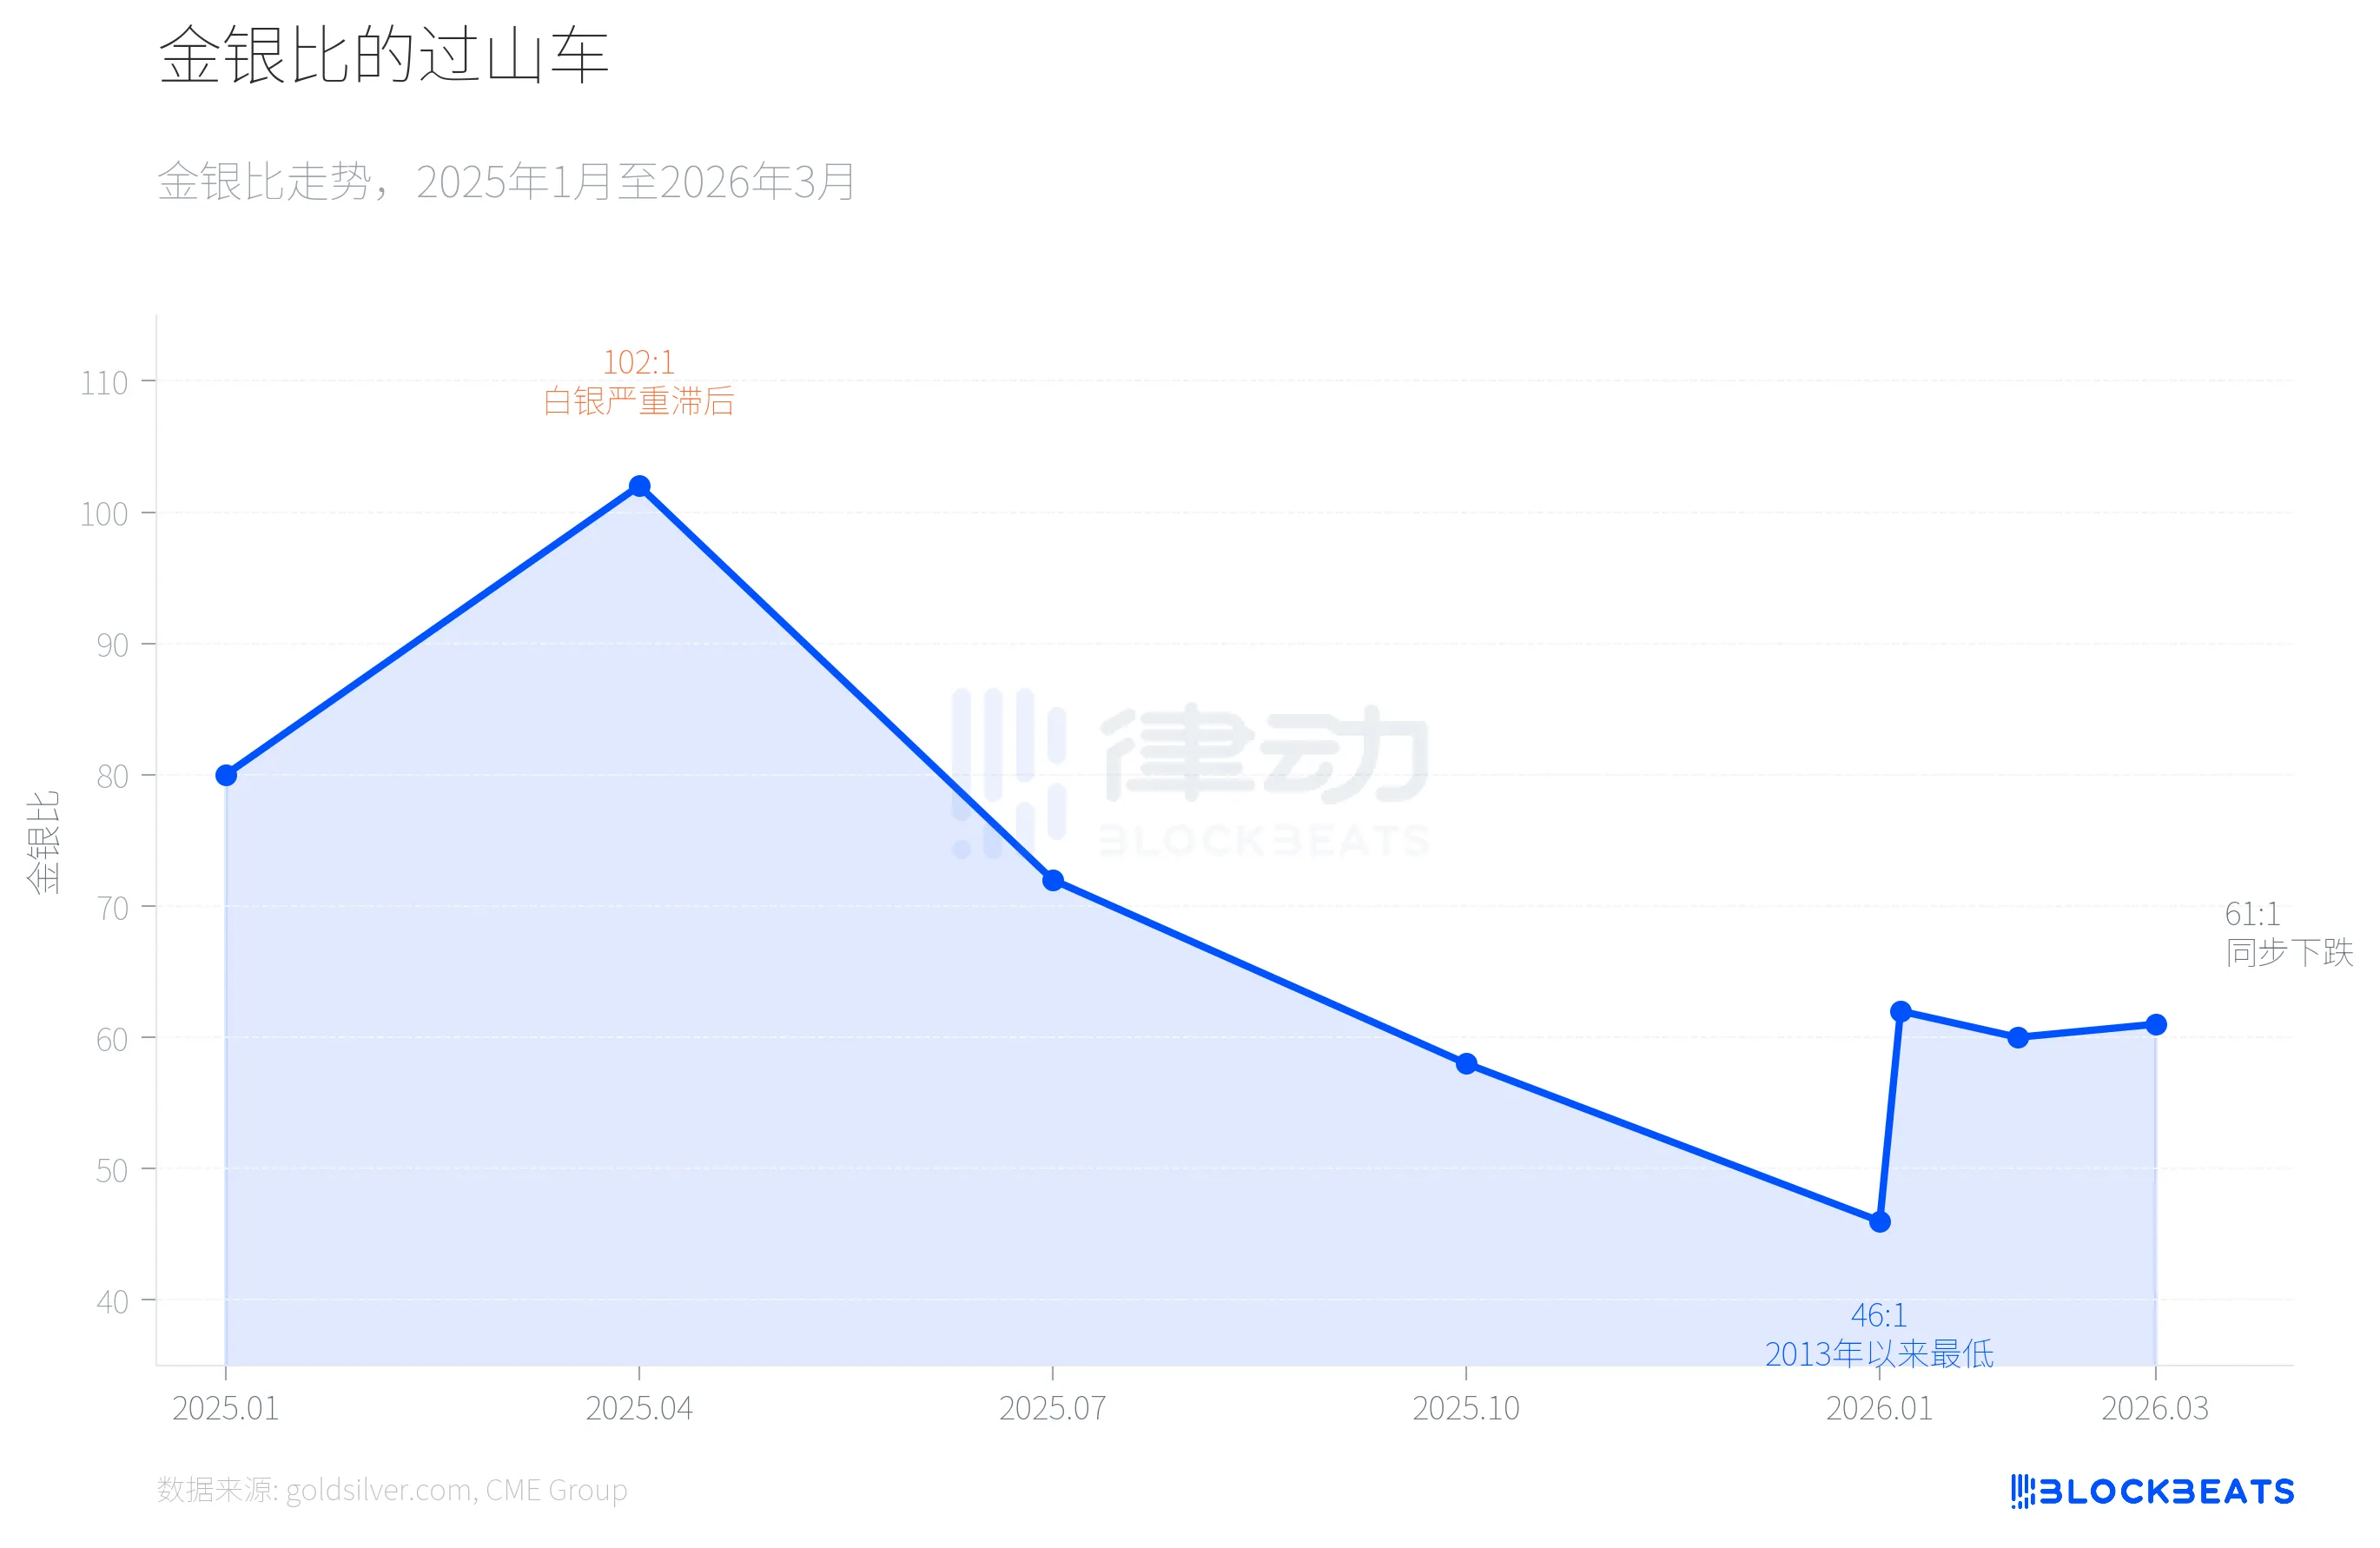
Then everything reversed on January 31. According to the platform's data, silver plummeted 13.7% in a single day, with the cumulative decline from the peak of $121.67 reaching 41.1%, far exceeding the 26.6% decline of gold during the same period. This was a rare single-day volatility in precious metals since the 1980 Hunt Brothers event (“Silver Thursday”). As of March 23, silver was around $67.4, and the gold-silver ratio had rebounded from the low of 46:1 to about 61:1. Silver gave back more than half of the gains accumulated over 9 months in less than 2 months.
The core reason for this asymmetry lies in silver’s dual attributes. On one hand, according to CME Group research, the production capacity of photovoltaic panels has grown by 18% year-on-year, and industrial demand for silver is still structurally expanding. On the other hand, the leverage in the silver market is much higher than in gold, and the increase in margin from 15% to 18% by CME directly triggered a massive forced liquidation. The industrial fundamentals have not changed, but financial leverage collapsed first.
The final noteworthy signal is the differentiation in capital structure.
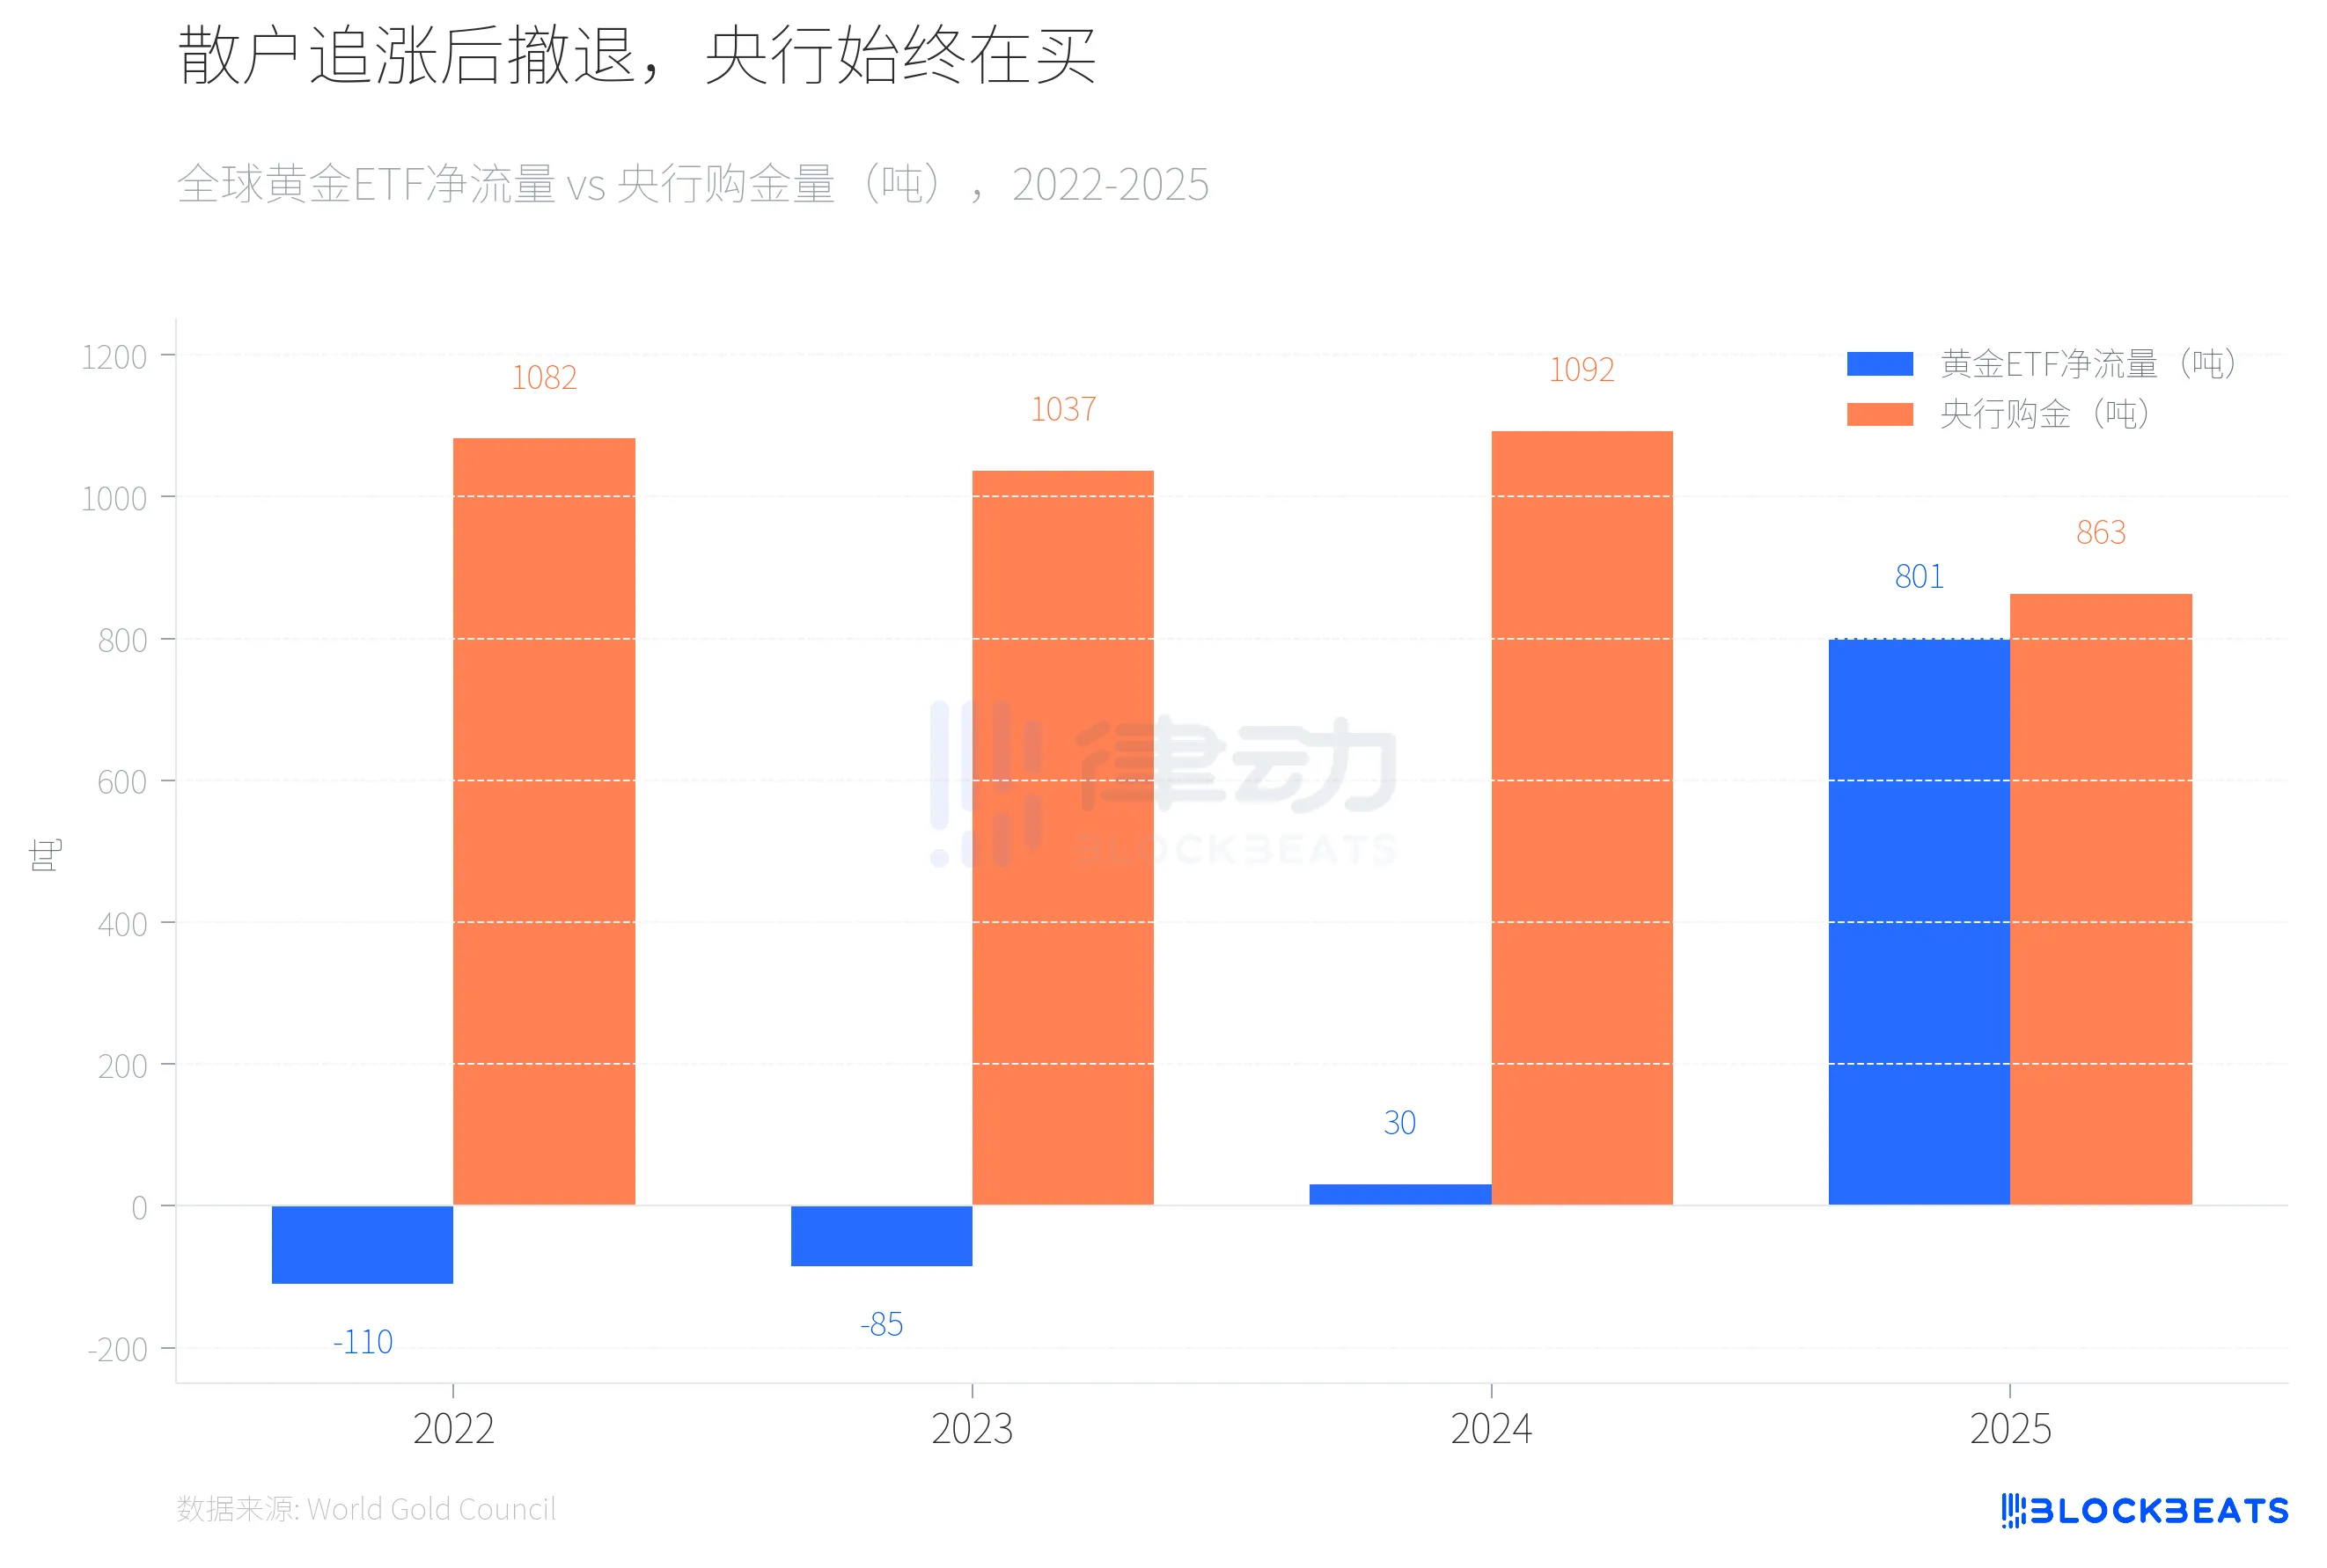
From 2022 to 2023, global gold ETFs saw consecutive net outflows for two years (-110 tons and -85 tons respectively), while central banks purchased over 1,000 tons of gold for two consecutive years. In 2024, ETF funds turned positive but at a small scale (30 tons), while central banks continued to buy at a high level of 1,092 tons. Dramatically, in 2025, according to World Gold Council data, global gold ETFs saw a net inflow of 801 tons throughout the year, setting a historical record, with assets under management doubling to $55.9 billion.
Then retail funds began to flee. According to Canadian business media Chronicle Journal, the SPDR Gold Trust (GLD) saw a single-day net outflow of $2.91 billion on March 4, setting the largest single-day outflow record since 2016, with 25 tons of gold lost within 7 days. Meanwhile, according to its annual report, global central banks are expected to buy 863 tons of gold in 2025, though this is a 21% decrease compared to 2024, it remains well above the average level from 2010-2021 (473 tons). The same report showed that the Polish central bank became the world's largest buyer for the second consecutive year with a purchase volume of 102 tons, followed by Kazakhstan (57 tons) and Brazil (43 tons).
According to Morgan Stanley's March research report, the bank maintains its target price for gold at $6,300 at the end of 2026. However, according to the IEA's March oil market report, the blockade of the Strait of Hormuz has led to a reduction of about 8 million barrels per day in global crude oil supply, equivalent to nearly 8% of global demand. The IEA described this as "the largest supply shock in the history of the global oil market," with member countries initiating the largest strategic reserve release of 400 million barrels in history.
For central banks in oil-importing countries, the priority in responding to oil price shocks may exceed the continued accumulation of gold. In the previous three peaks, global central banks were not net buyers of gold. They bought 863 tons in 2025, but no one knows the numbers for 2026.
免责声明:本文章仅代表作者个人观点,不代表本平台的立场和观点。本文章仅供信息分享,不构成对任何人的任何投资建议。用户与作者之间的任何争议,与本平台无关。如网页中刊载的文章或图片涉及侵权,请提供相关的权利证明和身份证明发送邮件到support@aicoin.com,本平台相关工作人员将会进行核查。