
Daily market key data review and trend analysis, produced by PANews.
Macroeconomic Market
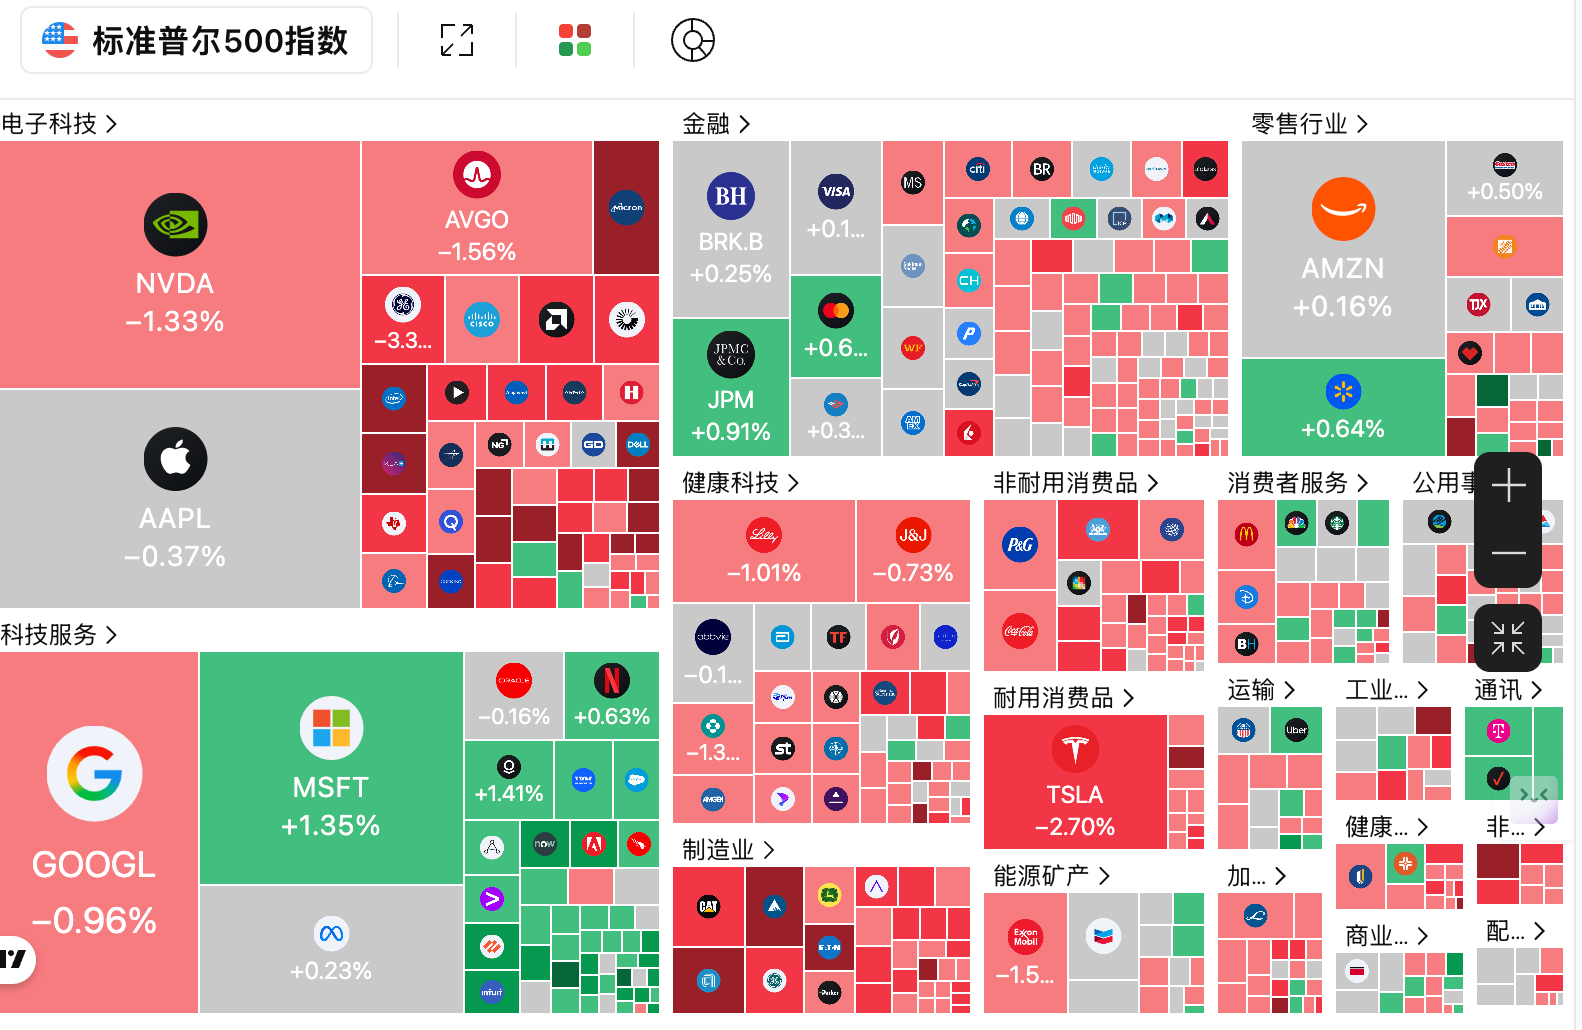
The outbreak of war in the Middle East has completely ignited panic among Wall Street, with the three major U.S. stock indexes experiencing a “bloodbath”. The Dow Jones Industrial Average plummeted 403 points to close at 48,501 points, the Nasdaq fell 1.02% to 22,516 points, and the S&P 500 index dropped 0.94% to 6,816 points, briefly falling below the key support level of 6800 points and breaching the 100-day moving average. Bloomberg macro strategist Michael Ball warned that the negative gamma region below 6800 points is accelerating hedging pressure for market makers, with the fear index VIX soaring to an annual high of 25.16.
Additionally, the U.S. dollar index nearly broke the 100 mark yesterday, setting a new high since late November last year. Ultima Markets analyst Elon Gu pointed out that rising inflation expectations have weakened rate cut expectations, combined with profit taking from safe-haven funds, leading to sustained upward momentum for the dollar due to potential liquidity demand.
The energy market has completely spiraled out of control, with WTI crude oil temporarily skyrocketing 8.2% to 78.05 USD/barrel, and Brent crude oil surging 7.8% to 84 USD/barrel. Oil prices only retreated from the highs after Trump announced the deployment of the U.S. Navy and DFC to provide escort and insurance for tankers in the Strait of Hormuz. Adam Turnquist from LPL Financial believes that this statement has briefly eased concerns regarding global supply shocks. Goldman Sachs' Jessica Rindels emphasized that every $10 increase in oil prices will drag U.S. GDP down by about 10 basis points, making the S&P 500 index, with a price-to-earnings ratio of up to 22 times, extremely vulnerable to such fluctuations.
In extreme liquidity demand, traditional safe-haven assets have been “sacrificed.” Spot gold plummeted over 3.7% yesterday, falling from a high of 5400 USD to around 5,148 USD, while silver dived more than 12%, and platinum and palladium fell 10% and 7%, respectively. Currently, the precious metals sector is showing signs of rebound.
The Asia-Pacific market has become a serious disaster zone, with the South Korean stock market experiencing an epic sell-off. The KOSPI index in South Korea dropped 12.06% to close at 5,093 points, repeatedly triggering circuit breakers during trading, with a two-day cumulative drop of 20%, nearly wiping out all gains from February. The Bank of Korea held an emergency meeting to assess market volatility and stated that it would cooperate with the government for intervention if necessary. Analysts believe that the fragility of the South Korean stock market may stem from its reliance on oil imports, which is as high as 98% (with over 70% from the Middle East), the high proportion of foreign capital dominance, and the significant prior gains in the semiconductor sector. In addition, the Japanese Nikkei 225 index fell 3.61%, the A-share Shanghai Composite Index dropped 1.3%, the Hong Kong Hang Seng Index also fell 3%, and the Thai SET index plunged 8%, triggering suspensions.
AI Sector Developments
The “AI panic” intertwined with geopolitical crises has led to high capital expenditures of tech giants facing the most stringent scrutiny from the market. The semiconductor sector is the most affected, with the U.S. semiconductor ETF dropping 3.8% and Nvidia falling 1.3%.
The arms race in Silicon Valley has also not ceased. OpenAI has shocked the industry by launching GPT-5.3 Instant, and Google quickly retaliated with Gemini 3.1 Flash-Lite, while defense AI unicorn Anduril is raising $4 billion at a $60 billion valuation.
South Korean chip giants suffered a significant bloodbath, with SK Hynix plummeting 12%, and Samsung Electronics also falling sharply, erasing billion-dollar market capitalizations. Analyst QINBAFRANK pointed out that Nvidia's cost pressures are directly aimed at HBM memory, with the demand for AI computing power increasing the need for high-end storage.
Bitcoin Market
Bitcoin briefly surpassed $70,000 before retracing back to around $68,000, with major traders applying pressure above $69,000 while some funds are propping it up below, suggesting the market may maintain a fluctuating trend in the short term. The current macro environment is complex, with geopolitical crises intensifying, oil prices soaring, and the dollar index climbing, but the 30-day correlation between Bitcoin and the Nasdaq has declined from 92% to 69%, indicating an increased perception of Bitcoin's independence, along with recent discussions on whether to carry physical gold or Bitcoin amid political turmoil, further reinforcing Bitcoin’s narrative as “digital gold.”
Despite the spread of panic sentiment, strong demand for buying on dips is pushing overall sentiment towards a bullish rebound, with data showing that the selling volume from long-term holders has plummeted by 87%, now at just 31,000 coins, and miner selling pressure has also decreased from a peak of over 4,700 coins to 837 coins, while super whales holding over 100,000 coins have increased their holdings by 14,000 BTC. According to unbias data, the market remains predominantly bullish.
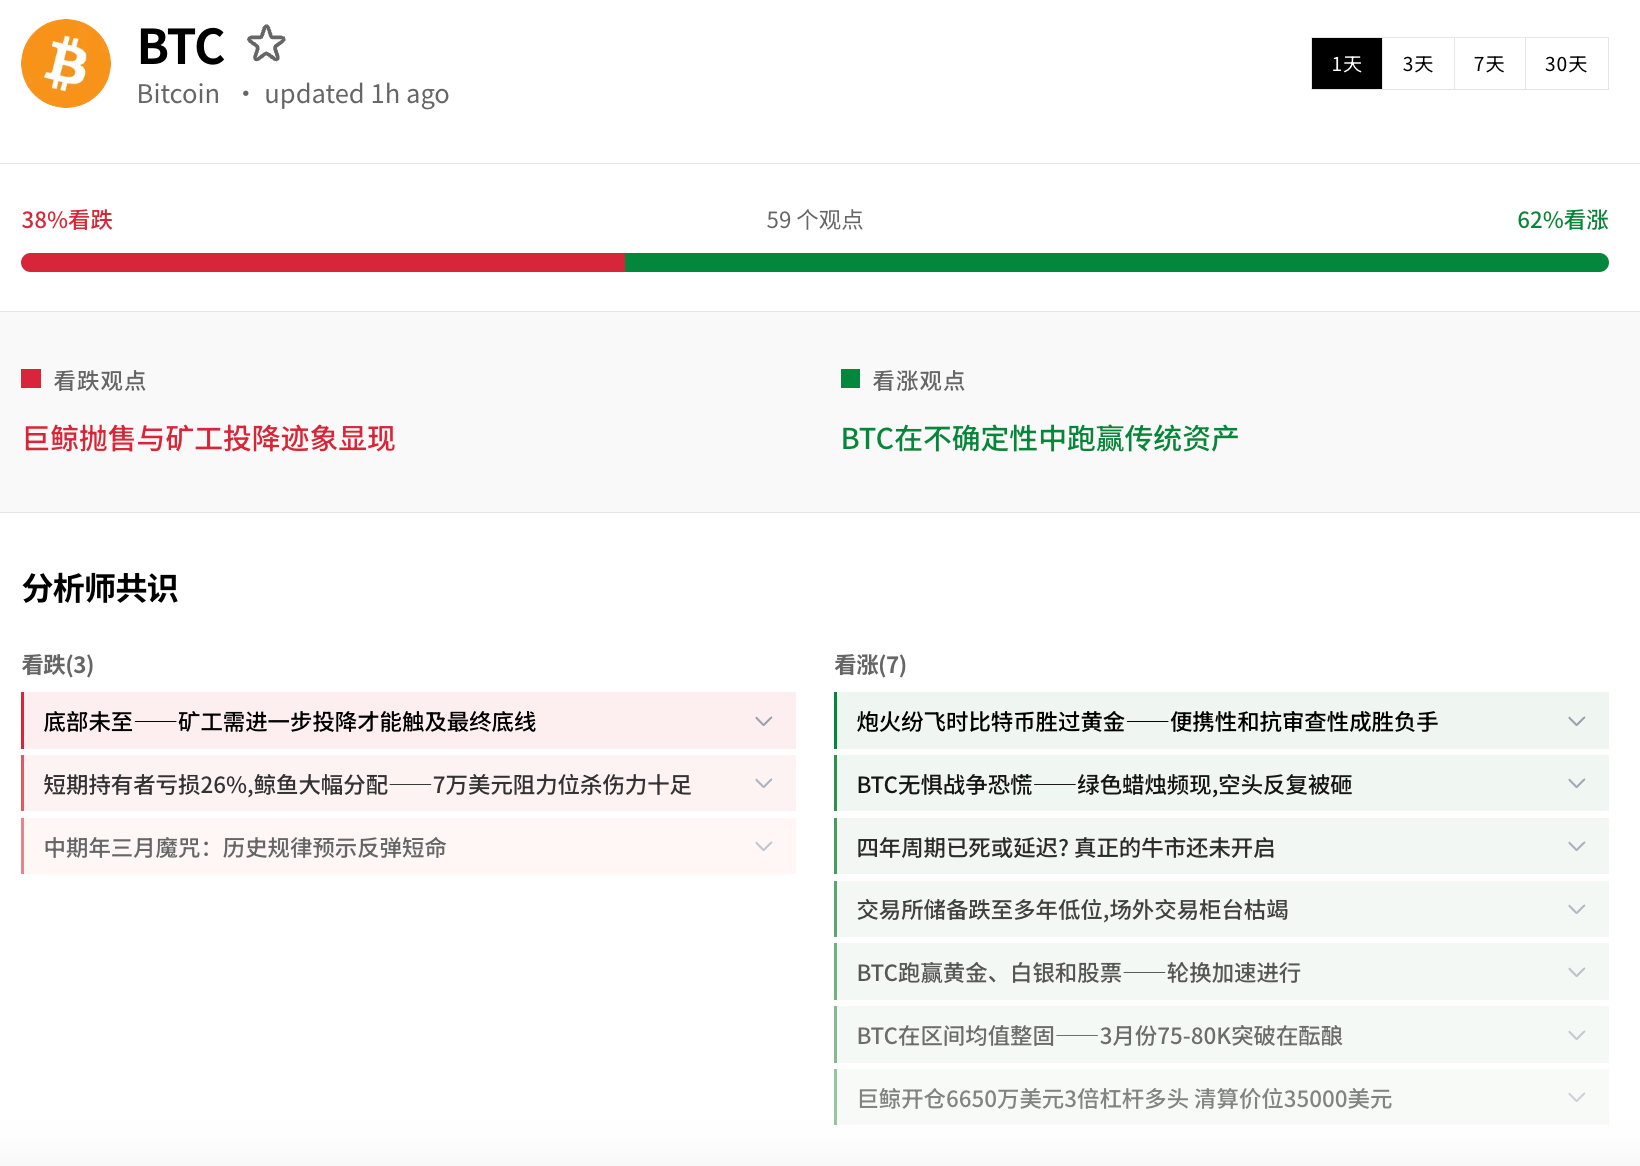
Bearish Outlook
Technical breakdowns and the phase-wise withdrawal of institutional funds form the core logic for the bears' pessimism about the market's future. They believe that before substantial improvements in macro liquidity are observed, Bitcoin still needs to experience a deeper washout.
Keith Alan: The bulls failed to gather momentum, with prices falling again below the 2021 peak and the 21-day moving average; the market may recreate an 8-month long consolidation.
Mister Crypto: The 3-day line of Bitcoin has shown the first “death cross” since June 2022, indicating that the market is entering the most brutal stage of a bear market.
Analyst consensus: The bottom has not yet arrived, and miners need to surrender further to reach the final bottom; short-term holders are currently down 26%, and whales are still distributing chips, with the $70,000 resistance level being highly destructive.
Glassnode: $70,000 remains a ceiling rather than a floor; whenever the 12-hour moving average of net realized profits spikes, prices encounter resistance in the $69.4k range, reflecting the current fragility of demand structure.
Darkfost: Bitcoin's average holding cost of approximately $79,000 forms heavy upward selling pressure.
Bullish Outlook
Bulls firmly believe that selling pressure has been exhausted, and the geopolitical crisis highlights Bitcoin’s censorship-resistant and portable safe-haven attributes. The quiet accumulation by whales and the optimistic expectations from institutions are preparing for the next breakout.
Tom Lee: The worst of the sell-off will end this week, and the March stock market will see a rise led by tech stocks and cryptocurrencies.
10x Research: Bitcoin has not accelerated downward under risk-off sentiment; volatility has compressed and ETF fund flows have warmed, indicating that selling pressure is exhausting, and the market is exhibiting a tactical shift.
Murphy: The BRS wave signal has finally moved from 100 to the 0-axis after a month, with a historical win rate of 81.8%, indicating that a successful rebound is imminent.
CryptoPainter: Based on the total amount of stablecoins and Bitcoin's market share, the current fair value of BTC is approximately $61,470, indicating that the market is not severely overvalued.
Ali Charts: Over the past decade, Bitcoin has consistently bottomed within the MVRV pricing range of 1.0 to 0.8, and the current position has extremely strong historical support.
Ethereum Market
Ethereum recently faced extremely stubborn resistance at the $2,000 mark, with prices struggling to maintain around $1,950 amid macro panic. Market data shows approximately 1.23 million ETH exchanged hands around $1,890, forming a solid cost support. Despite a surge in network activity and the reserves of ETH on exchanges dropping to their lowest levels in years, there is a clear divergence in funds in the market: retail investors are consistently buying, while large whales are selling on the highs, resulting in a stalemate between bulls and bears in the $1,800 to $2,000 range, with market sentiment leaning towards seeking a breakout direction through oscillations. The wide straddle structure in the options market also indicates that market makers remain on high alert for severe washouts.
Bearish Outlook
The distribution behavior of large holders and the technical breakdown risk on charts form the primary concerns for the bearish camp. They believe that if critical support is breached, Ethereum will face a deep valuation reassessment.
Hyblock Data Analysis: Market trading is diverging, with the CVD for trades between $10,000 and $100,000 at -$162 million, and CVD for large trades over $100,000 at -$357 million, indicating that whales and institutions are net selling.
Technical analyst consensus: The lower boundary of the symmetrical triangle on the daily chart (between $1,800-$1,900) is precarious; if it falls below $1,850, the price may plummet to a target level of $1,400.
Glassnode (MVRV Model): The MVRV extreme deviation pricing zone indicates that Ethereum prices still have room to decline, with the bottom potentially under $1,650 before unrealized profits reach extreme levels.
Bullish Outlook
The sharp decline in exchange supply and the continuous accumulation by retail investors are seen by bulls as the core driving force for Ethereum to face a supply shock soon.
CryptoQuant / Arab Chain: In February, over 31.6 million ETH left major exchanges, marking the highest monthly outflow since last November; Binance's Ethereum reserves have dropped to a multi-year low of 3.46 million ETH, exacerbating supply tightening.
Hyblock Data Analysis: CVD for retail trades between $0 and $10,000 is close to $95 million, demonstrating consistent and strong retail buying support.
Maartunn: There are 67,000 ETH (about $13 million) at dense buy orders below the spot price (around $1,800), forming an exceptionally strong liquidity support wall.
Key Data (as of March 4, 13:00 HKT)
(Data sources: CoinAnk, Upbit, SoSoValue, CryptoBubbles)
Bitcoin ETF: +$225 million
Ethereum ETF: -$10.7529 million
SOL ETF: +$1.0304 million
XRP ETF: +$7.5255 million
Fear and Greed Index: 10 (Extreme Fear)
Upbit 24-hour trading volume ranking: EDGE, BTC, XRP, ETH, SAHARA
Sector performance: RWA and SocialFi sectors up 2%, AI and GameFi sectors down 3%
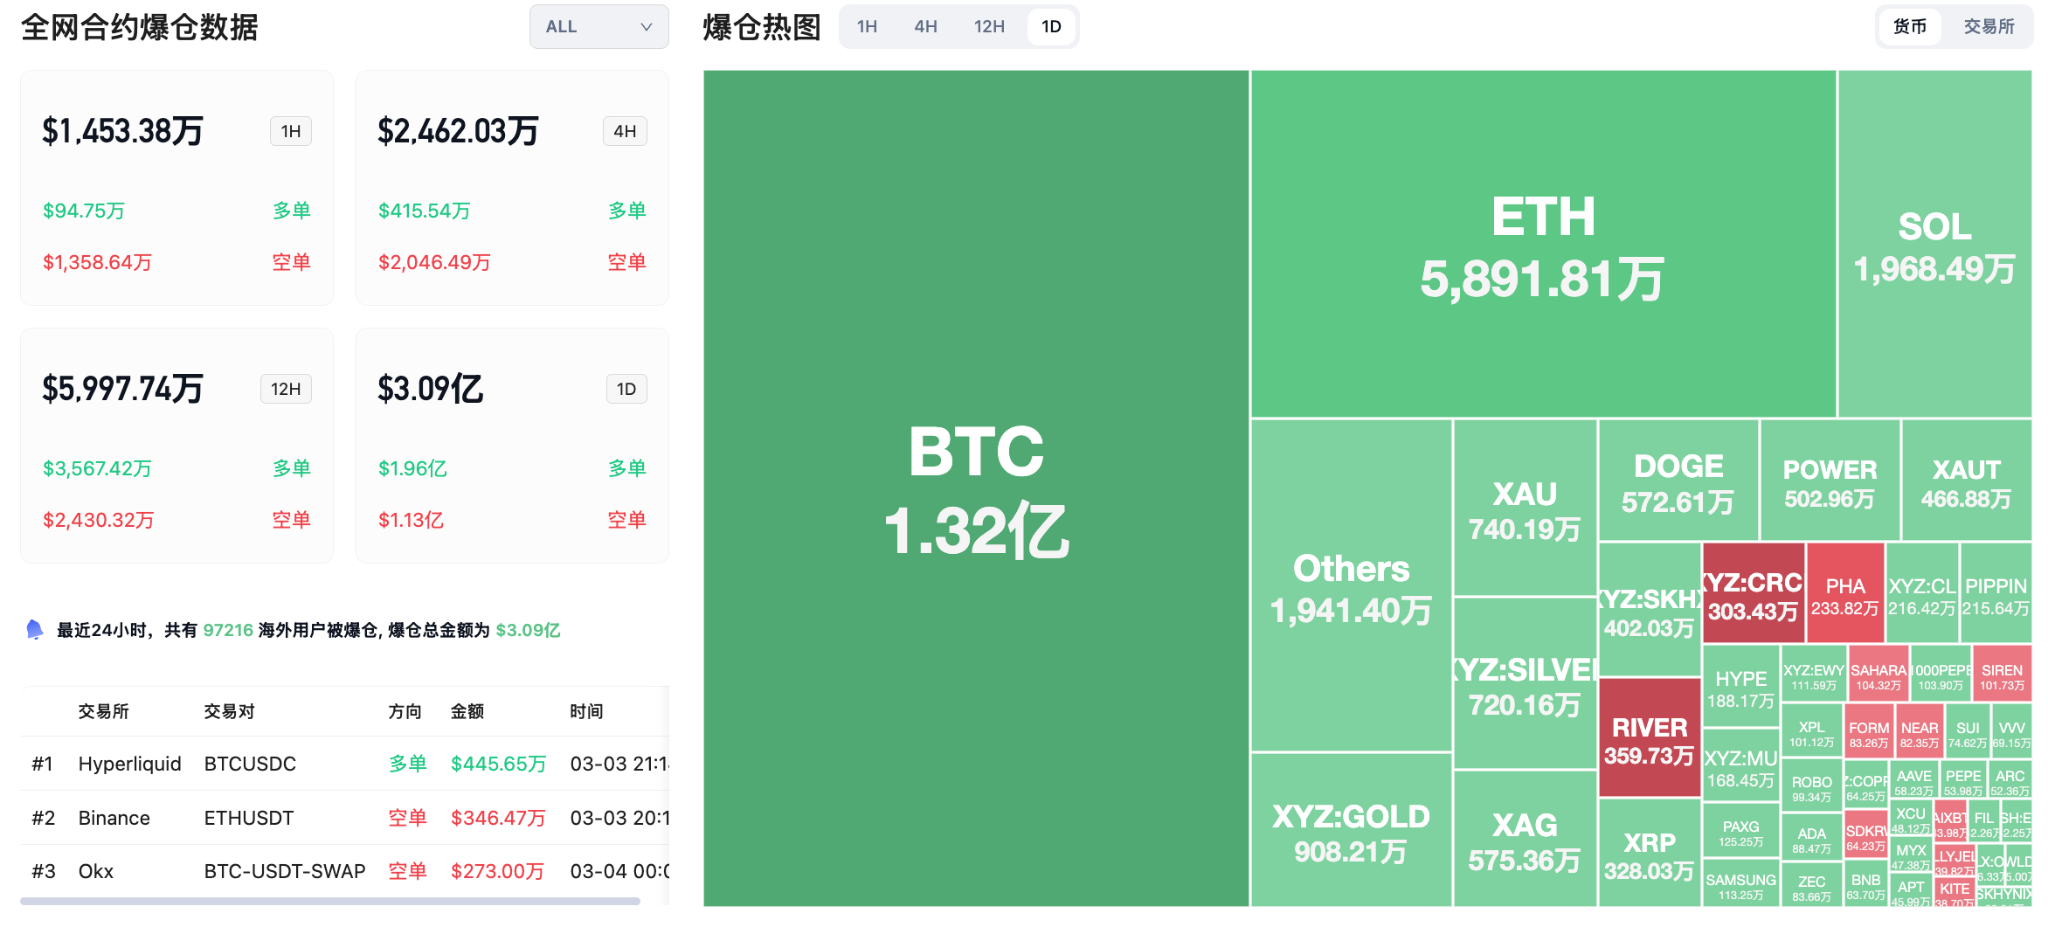
24-hour liquidation data: A total of 97,216 people were liquidated globally, with a total liquidation amount of $309 million, including $132 million for BTC, $58.9181 million for ETH, and $19.6849 million for SOL.
Today's Outlook
The Fourth Session of the 14th National People's Congress is held in Beijing, closing on the afternoon of March 12, lasting 8 days (March 4)
The Federal Reserve will release the Beige Book on economic conditions (March 5, 3:00)
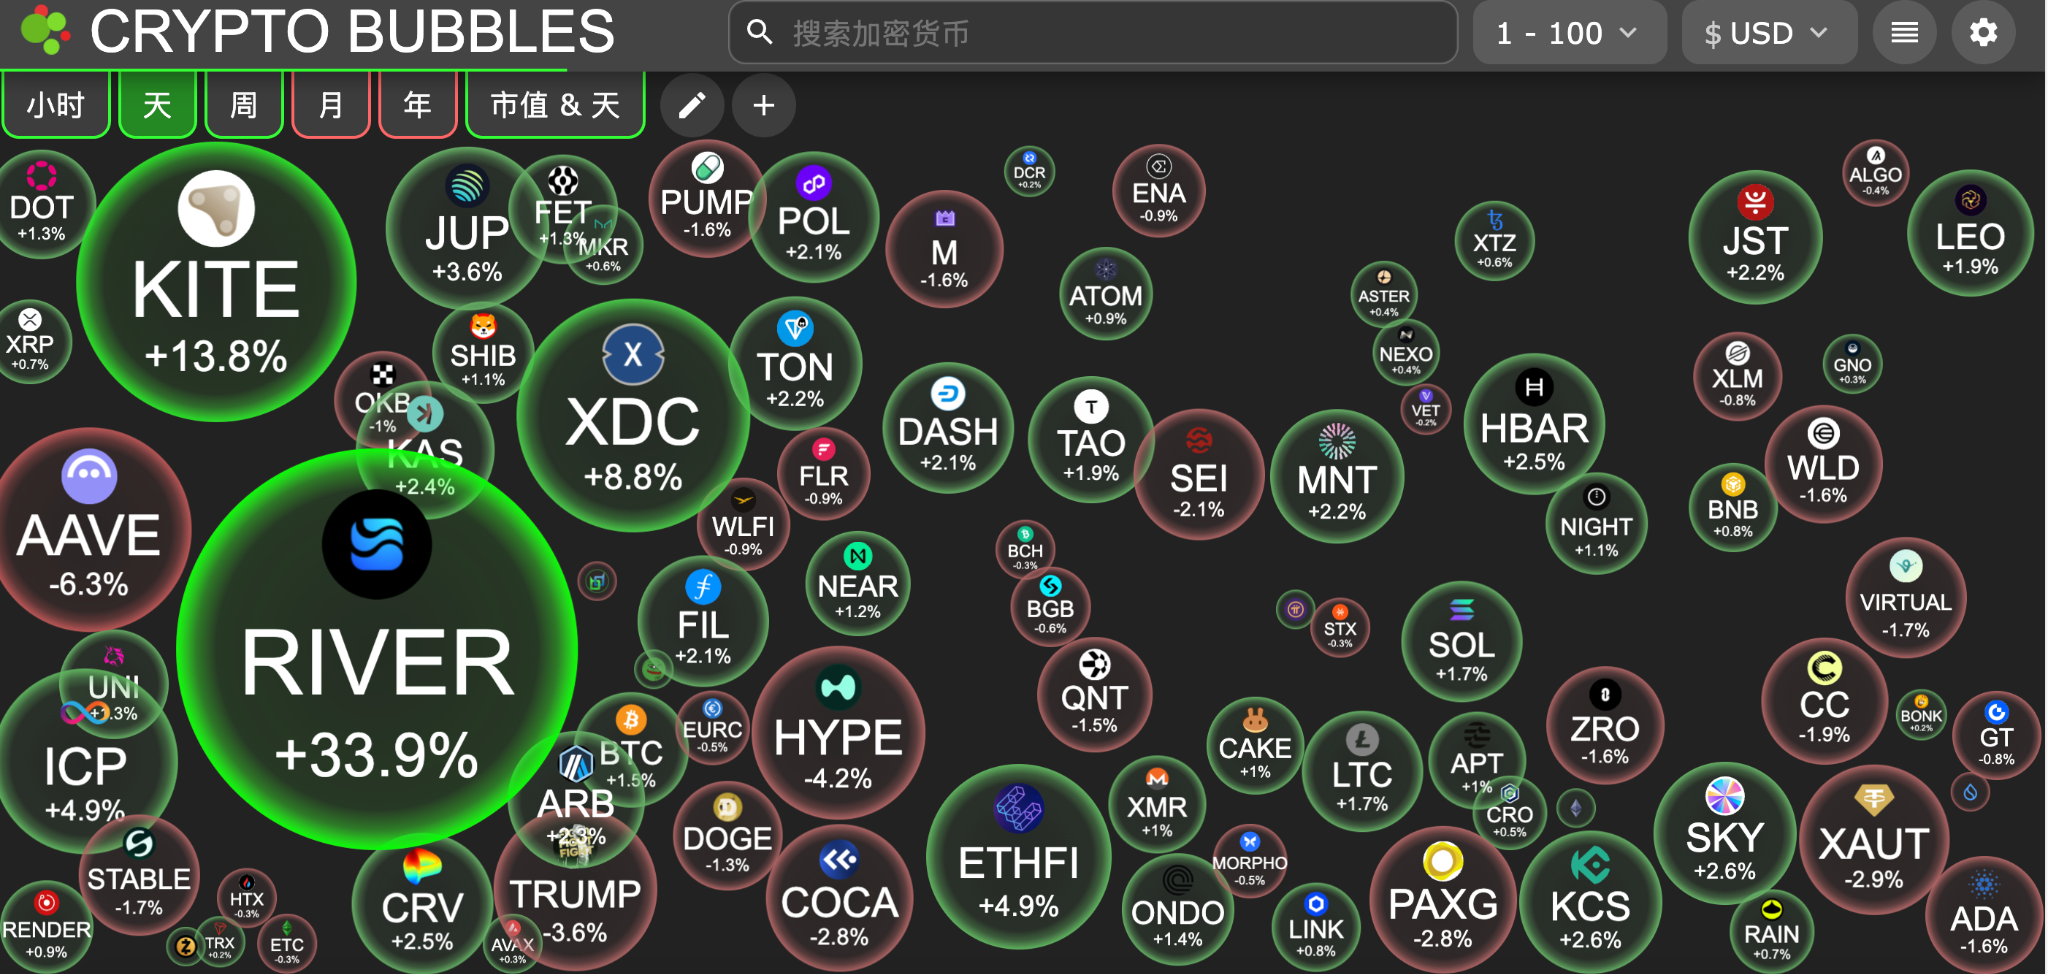
Today’s biggest gainers among the top 100 cryptocurrencies by market cap: River up 33.9%, Kite up 13.8%, XDC Network up 8.8%, Internet Computer up 4.9%, Ether.fi up 4.9%.
Hot News
Upbit will list EDGE tokens in the KRW, BTC, and USDT markets
Reports suggest the Supreme Leader election in Iran may be postponed until next week
The South Korean KOSPI index plummeted 12% during the day, as panic sentiment continues to intensify
Binance Alpha launches stock tokens for companies like Robinhood and Alibaba
A U.S. government address transferred out 0.0378 BTC, valued at approximately $2,520
Data: 38% of altcoins are nearing historical lows, above the market levels after the FTX collapse
Core Scientific plans to sell approximately 2,500 Bitcoins in Q1 2026 to support AI transformation
免责声明:本文章仅代表作者个人观点,不代表本平台的立场和观点。本文章仅供信息分享,不构成对任何人的任何投资建议。用户与作者之间的任何争议,与本平台无关。如网页中刊载的文章或图片涉及侵权,请提供相关的权利证明和身份证明发送邮件到support@aicoin.com,本平台相关工作人员将会进行核查。


