Original Title: Reading Perps Beyond Volume
Original Author: Prathik Desai, Token Dispatch
Original Translation: Bitpush News
Just when you think finance has become dull and boring, it always surprises you. Recently, it seems everyone is reconstructing the financial system in ways few anticipated, including those from the entertainment and media industries.
Take Jimmy Donaldson (also known as "MrBeast" on YouTube) as an example. He not only owns a snack empire but has recently acquired a banking app aimed at promoting financial literacy and money management among teenagers and young adults. Why? Perhaps there’s nothing more direct than monetizing a subscriber base of 466 million using financial products.
This summer, the world’s largest derivatives trading market, CME Group, will launch single-stock futures, allowing users to trade futures on over 50 top U.S. stocks, including Alphabet, NVIDIA, Tesla, and Meta.
These reconstructions show us how people's participation in finance is changing. And in the past few years, nothing illustrates this better than the surge of perpetual contracts (Perpetual Markets).
Perpetual futures (or Perps) are a type of financial derivative contract that allows market participants to speculate on asset prices without an expiration date. Perps also enable people to express their views on assets quickly and cheaply. They are more enticing than traditional markets because they offer instant access and leverage. Unlike traditional markets, they do not require a broker onboarding process, jurisdiction paperwork, nor do they follow "traditional" market operating hours.
Moreover, on-chain perpetual markets allow any asset (whether traditional or crypto) to be traded in a permissionless, high-leverage manner. This makes speculation interesting, especially when humans cannot resist wagering on the trajectories of volatile assets outside traditional trading hours. This allows risk to be priced in real-time.
Think back to what happened two weeks ago. When traditional markets and crypto markets crashed simultaneously, traders flocked to Hyperliquid, propelling perpetual gold and silver trading into a frenzy. On January 31, Hyperliquid alone captured 2% of global silver daily trading volume on its silver perpetual contract market, which had been live for less than a month.
This explains why the perpetual contract trading volume dashboard is increasingly dominating crypto communities and forums. Trading volume is an absolute value. It looks large, refreshes every few minutes, and is great for leaderboard rankings. But it misses a critical nuance: trading volume may reflect a meaningless activity. A high trading volume in a market may be due to adequate depth, but it could also be due to rewards and incentives encouraging higher frequency activity. Such activity is often recursive and holds little significance.
This week, I delved into other metrics of the perpetual trading market. When these metrics are used in conjunction with trading volume, they add more dimensions and tell a story entirely different from simple trading volume.
Let’s get started.
Several Data Points
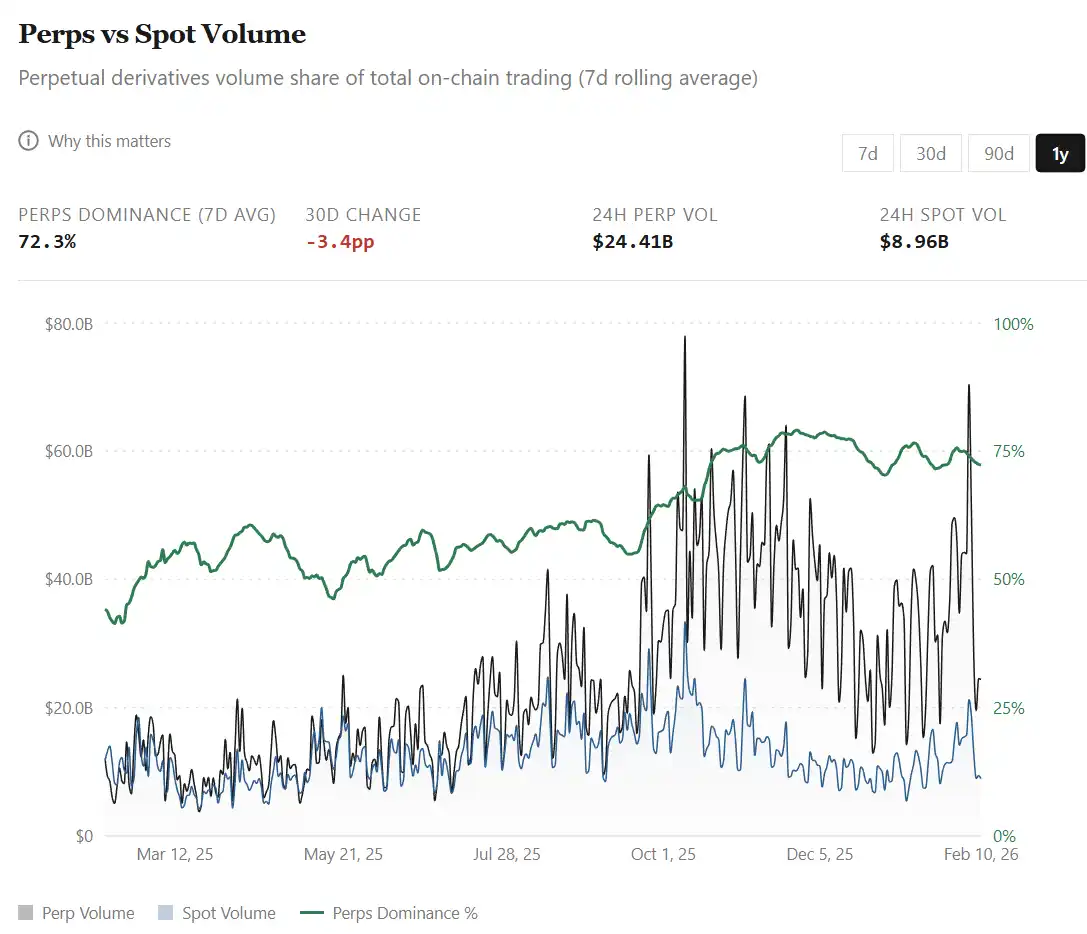
The user-friendly interface of perpetual markets makes it a low-barrier, default interface for expressing viewpoints across various markets and global assets. The broad choice of high-leverage derivatives trading on a single platform for both traditional and crypto assets has resulted in perpetual contract trading volumes surpassing spot trading volumes on decentralized exchanges. From 44% in February 2025, the share of perpetual contract trading volume has soared to around 75% today (relative to spot trading volume).
This growth has been particularly pronounced in recent months:
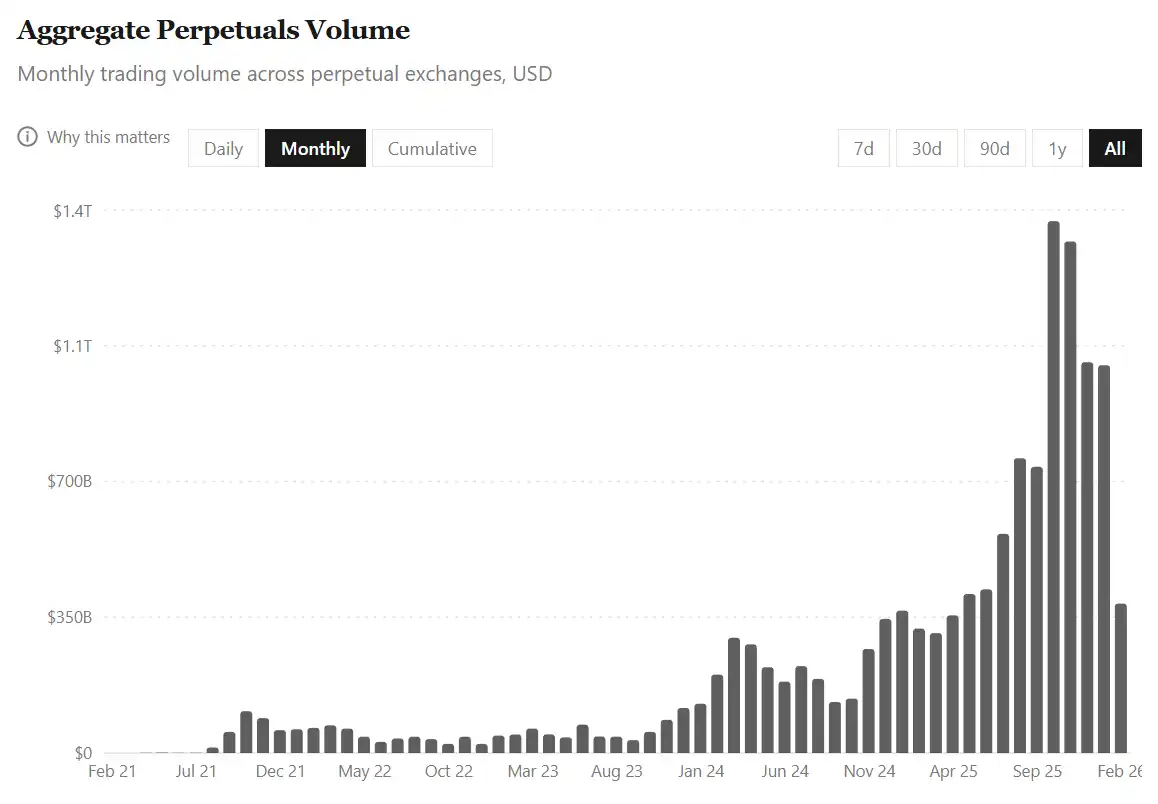
· Over the four-year period until July 31, 2025, the cumulative total volume of perpetual trades across all platforms reached $6.91 trillion.
· In just the past six months, this trading volume doubled to $14 trillion.
All this growth occurred against the backdrop of the total cryptocurrency market capitalization shrinking by nearly 40% between August 1, 2025, and February 9, 2026. This level of activity indicates that traders are increasingly leaning towards derivatives trading, hedging, and short-term positioning, especially when the spot market becomes highly volatile and bearish.
But here’s the catch. In such a significant activity, it’s easy to misinterpret trading volume metrics. Especially since perpetual trading is not merely about buying assets and holding them long-term; it also involves rapidly adjusting bet sizes within shorter time frames using leverage.
Thus, when the market turnover rate rises rapidly, an inevitable question arises in my mind: Does record trading volume reflect more capital inflows, or is the same capital circulating at a faster rate?
This is where monitoring open interest (OI) becomes relevant. If trading volume reflects capital flow, then OI measures the risk exposure of open positions. In perpetual trading platforms, OI refers to the total dollar value of active and unsettled long and short contracts held by traders.
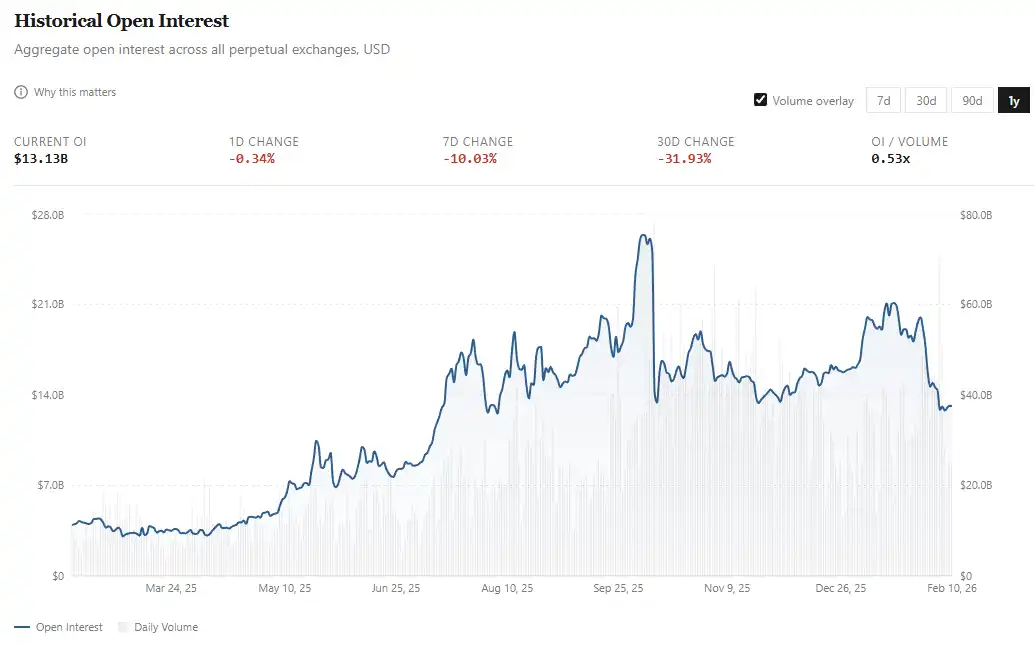
If perpetual trading gains acceptance in the mainstream market, we not only wish to see larger capital flows but also proportionately growing open interest.
· Last February, the average OI was around $4 billion;
· This figure has more than tripled to about $13 billion. In fact, the average for the entire month of January reached approximately $18 billion before declining about 30% in the first week of February.
While perpetual trading volume doubled in the past five months, OI grew by about 50% (from $13 billion to approximately $18 billion, then back down to $13 billion). To better understand this, I observed the capital efficiency (i.e., the percentage of OI relative to daily trading volume) over the past year.
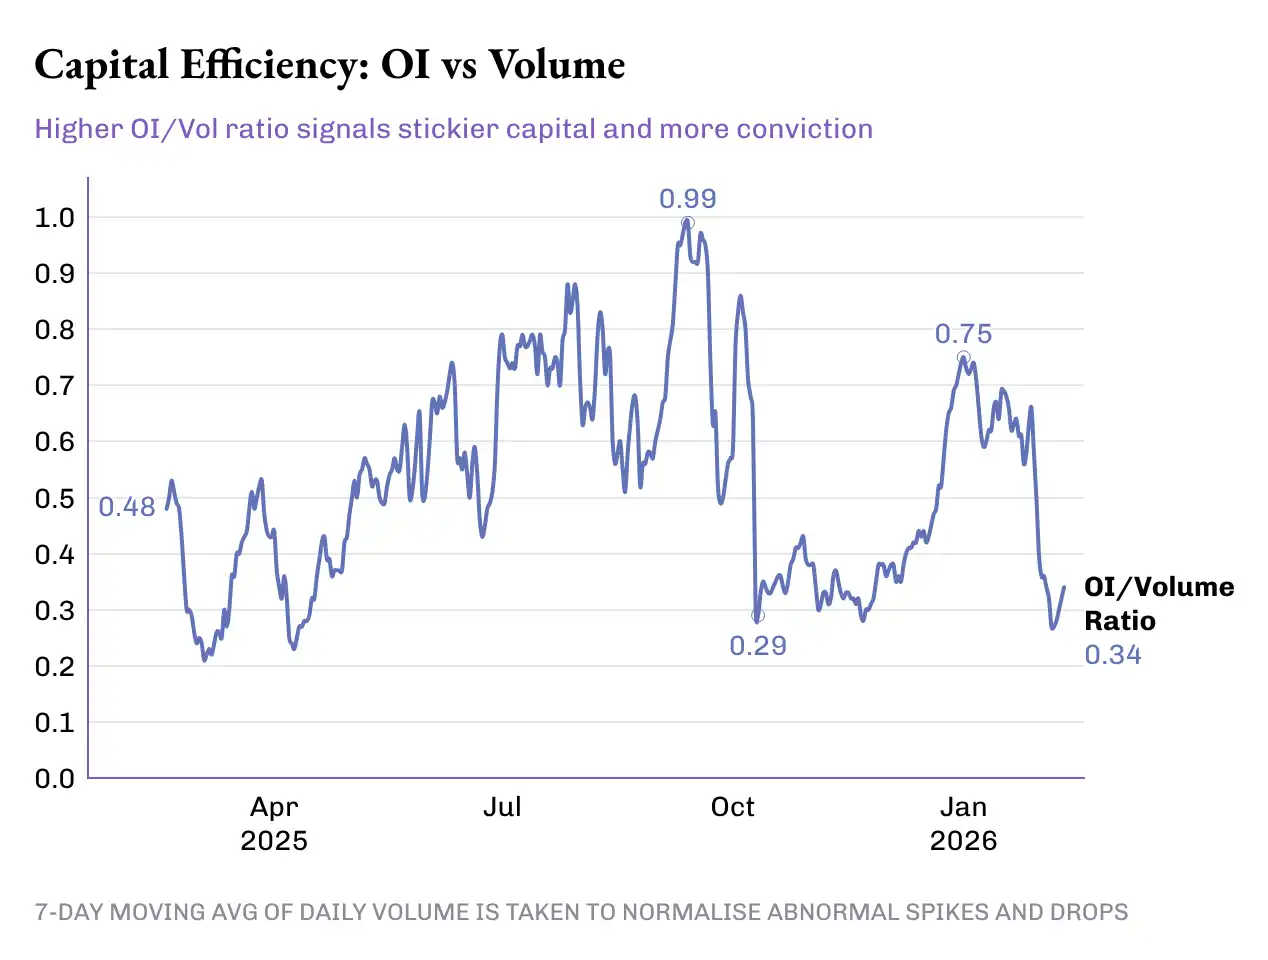
The OI/volume ratio jumped 50% from last year’s 0.33x to today’s 0.49x. But this progress was not smooth; during this increase of 50 basis points, several peaks and troughs were experienced:
· Phase One (February-May 2025): Dormancy period. The OI/volume ratio averaged about 0.46x, with an average OI of about $4.8 billion and an average daily trading volume of about $11.5 billion.
· Phase Two (June-Mid October): Leap period. The ratio averaged around 0.72x. During this phase, the average OI rose to $14.8 billion, with average daily trading volume of $23 billion. This not only marked a historical peak in trading volume but also indicated an increase in risk exposure and greater capital inflow into these derivatives.
· Phase Three: Market reversal. The beginning of this phase coincided with the massive liquidation on October 10, erasing over $19 billion in leveraged positions within 24 hours. From mid-October to late December, the OI/volume ratio fell to ~0.38x, primarily driven by increased trading volume, while open interest remained largely stagnant. October, November, and December saw the highest three-month trading volumes of 2025, averaging over $1.2 trillion per month. During the same period, the average OI was approximately $15 billion, slightly lower than the average of the previous three months.
Protocol Level
Here, I hope to add more dimensions at the protocol level to the perpetual market. This helps us understand how efficiently perpetual trading platforms convert trading activities into "sticky capital" and revenue.
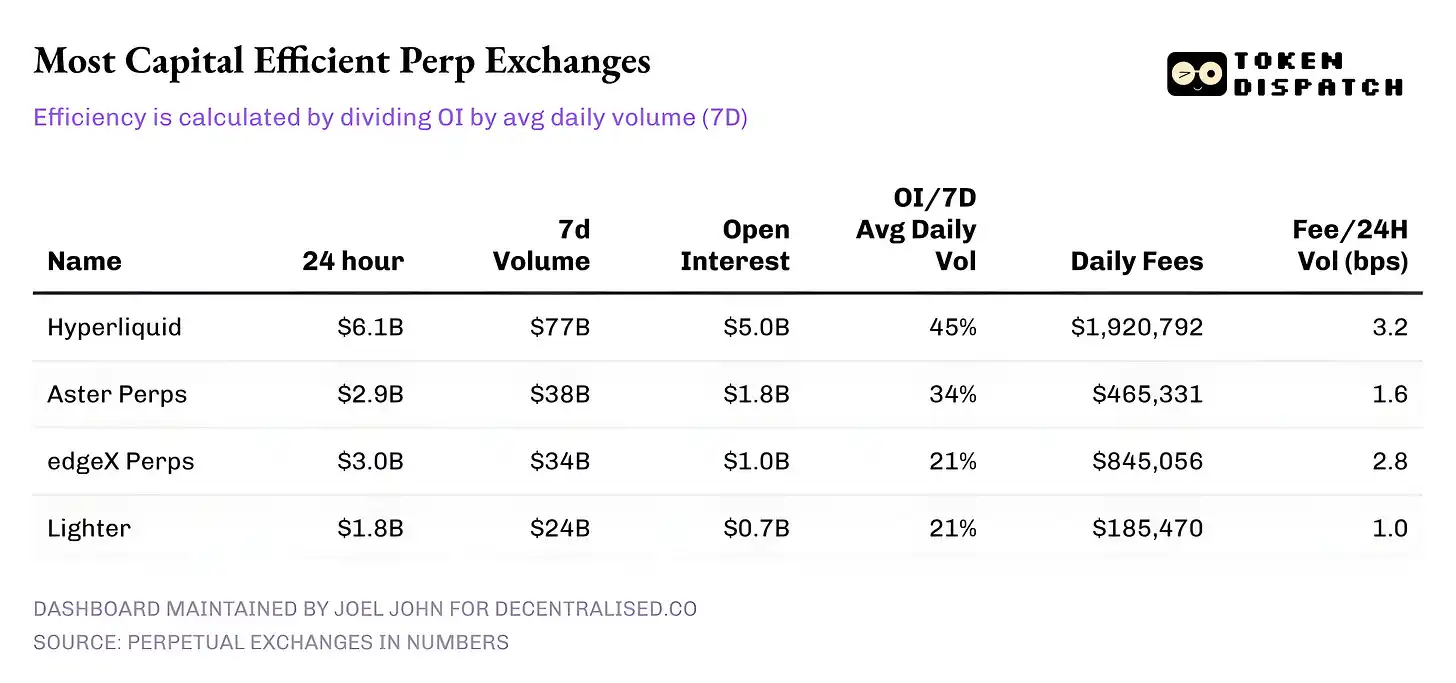
As of February 10, here are the performances of the top five perpetual trading platforms ranked by 24-hour trading volume:
· Hyperliquid: Its OI to 7-day average daily trading volume ratio exceeds 45%, capable of converting a large share of trading volume into persistent positions. This indicates that for every $10 traded on the platform, $4.5 is invested in active positions. This is important because high OI rates lead to narrower spreads, deeper liquidity, and confidence in scaling trades without slippage.
· Hyperliquid’s fee income reinforces this narrative. Its take rate is approximately 3.2 basis points, effectively converting the largest share of 24-hour trading volume into fee income.
· Aster: Currently ranked second, although its trading volume is less than half of Hyperliquid's, it boasts a decent capital efficiency of 34% (OI/Vol). However, its monetization capability is noteworthy — due to a lower take rate (around 1.6 bps), Aster clearly prioritizes capital retention on its platform over maximizing fees.
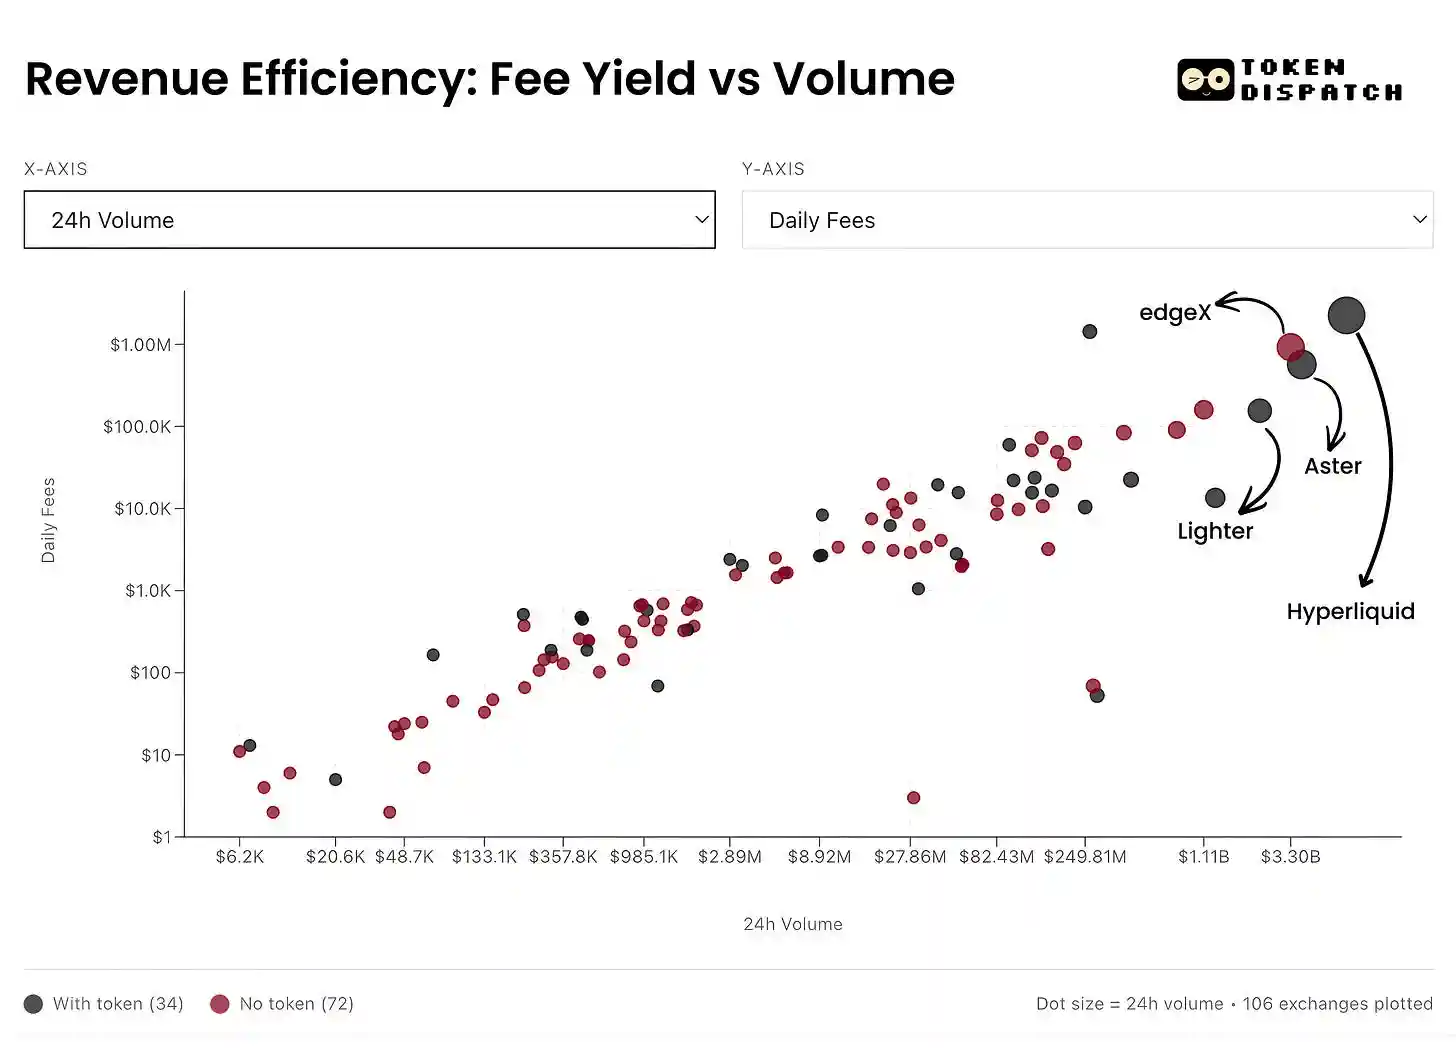
· edgeX and Lighter: Both perform similarly on the capital efficiency ladder, each with an OI/Vol of 21%. However, edgeX's monetization in terms of fees is comparable to Hyperliquid at 2.8 bps.
Conclusion
Remarkably, today’s perpetual contract market is no longer a simple growth story; it requires a nuanced interpretation of multiple metrics. On a macro level, trading volume has exploded: the cumulative perpetual trading volume increase within six months surpassed the total of the previous four years. But the picture only becomes clear when OI and trading volume are read together.
A clearer victory lies in the growth of the OI/volume ratio. This is a direct signal that there is "patient capital" willing to trust and bet on the various products and markets emerging on perpetual trading platforms.
What is more intriguing for the future is how individual players will evolve from here and what they choose to optimize. Over time, those trading platforms that can optimize "trading conviction" and achieve sustainable monetization will be far more significant than those that simply rely on rewards and incentives to top trading volume leaderboards.
免责声明:本文章仅代表作者个人观点,不代表本平台的立场和观点。本文章仅供信息分享,不构成对任何人的任何投资建议。用户与作者之间的任何争议,与本平台无关。如网页中刊载的文章或图片涉及侵权,请提供相关的权利证明和身份证明发送邮件到support@aicoin.com,本平台相关工作人员将会进行核查。


