Author: FLAME LABS

Abstract
This research report aims to comprehensively analyze the core proposition of the Bitcoin market in the first quarter of 2026: after experiencing a severe rollback from the historical high of October 2025 (approximately $126,000) to the current range of about $60,000-$70,000, where exactly is the absolute bottom of this cycle? The current market is at a paradoxical crossroads: on one hand, the traditional "four-year halving cycle" theory suggests the market is still in a bear continuation, potentially needing a long year of cooling; on the other hand, the passage of spot ETFs, the Federal Reserve's shift in monetary policy (and the subsequent uncertainties due to personnel changes), and the iteration of miner hardware are restructuring the underlying logic of the market.
This report abandons simple linear extrapolation and instead constructs a five-dimensional valuation model incorporating macro liquidity, miner survival costs (shutdown price), on-chain chip distribution (STH vs. LTH dynamics), technical structure (VPVR and 200WMA), and market sentiment (fear and greed). Analysis shows that while the market may not have fully met the time requirement for the "despair phase" from a historical perspective, the price structure and chip cost indicate that the range of $52,000 to $58,000 gathers the miner shutdown prices, the 200-week moving average, and the dense peak of super chips from 2024-2025, constituting a highly credible structural bottom for this cycle.
The report not only validates users' assumptions about the "$72,000-$52,000 super turnover zone" but further refines the characteristics of capital behavior within this range and proposes a probability-based pyramid building strategy in response to the current complex macro environment (the "Warsh shock" brought about by Kevin Warsh's nomination as Fed Chair).
1. Macro Narrative Reconstruction: Ineffectiveness and Doubts of the Four-Year Cycle
1.1 The Dilemma of "Carving a Boat to Seek the Sword": Linear Extrapolation of Historic Cycles and Real-World Deviations
In the analytical framework of cryptocurrency assets, the "four-year cycle" theory based on the Bitcoin halving mechanism has long occupied a dominant position. This theory is based on marginal changes in supply and demand, suggesting that the price behavior of Bitcoin exhibits a high degree of cyclical rhythm: a violent bull market follows a halving, followed by a year-long bear market correction, and finally two years of consolidation and recovery. If strictly following this historical script—i.e., an analysis akin to "carving a boat to seek the sword"—the current market stage indeed feels unsettling.
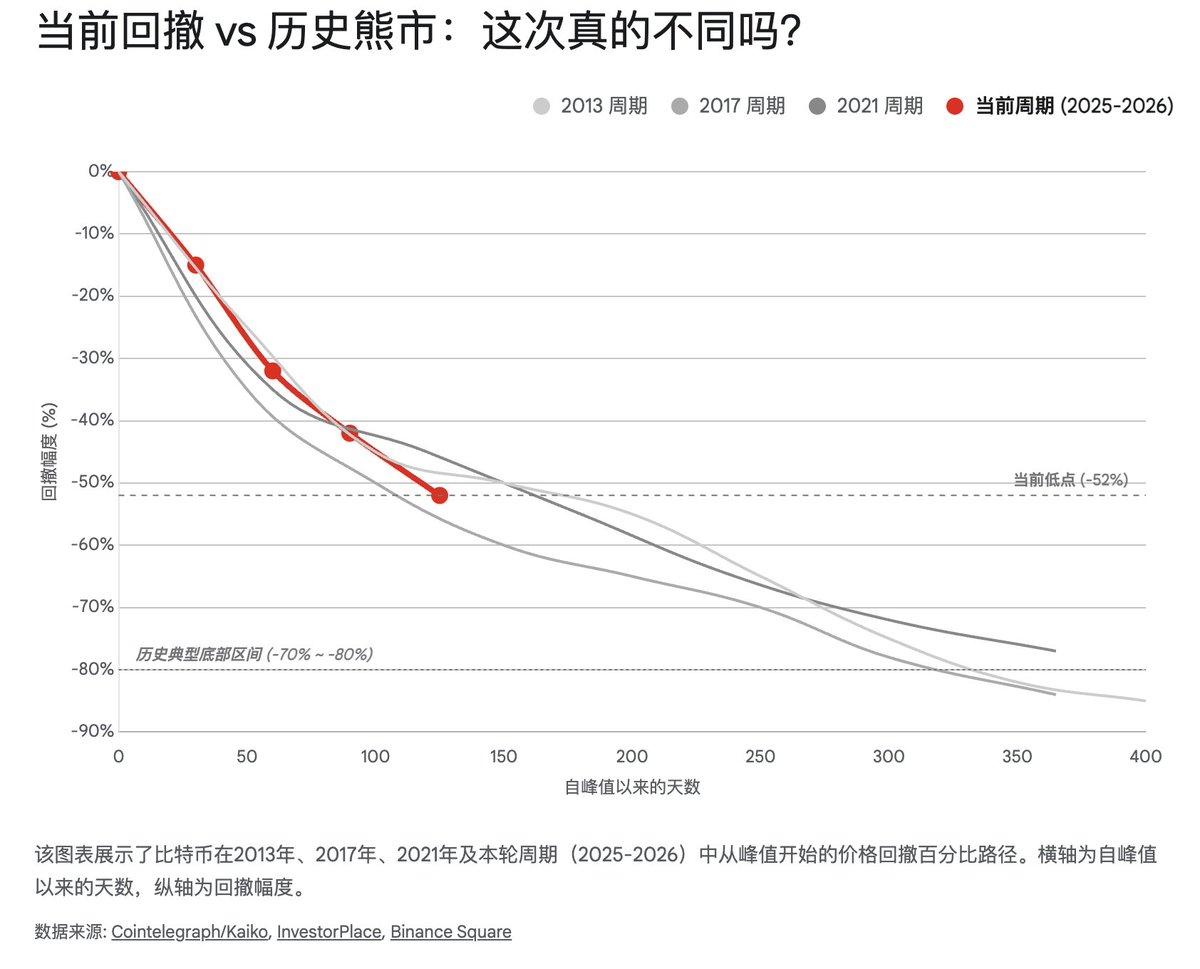
Looking back at historical data, the bull market peaks in 2013, 2017, and 2021 were often accompanied by a nearly 12-month unilateral decline, with maximum drawdowns typically exceeding 80%.
The Bear Market of 2014-2015: Prices fell from $1,100 to below $200, a decline of about 85%, taking about 400 days.
The Bear Market of 2018: Prices fell from $19,000 to $3,100, a decline of about 84%, taking about 365 days.
The Bear Market of 2022: Prices fell from $69,000 to $15,500, a decline of about 77%, taking about 376 days.
As of February 2026, Bitcoin prices have pulled back from the October 2025 peak (approximately $126,000) to around $60,000, a decline of about 52%. Kaiko Research has sharply pointed out that the current 52% drawdown appears "abnormally shallow" compared to historical cycles. If strictly aligning with the intensity of historical bear markets, typical bottoms are often accompanied by drawdowns of 60% to 68% or even deeper, suggesting there is mathematical room for prices to further dip to $40,000 or even lower. Additionally, from a time perspective, only four months have passed since the October 2025 peak; if considering the "bear market lasts a year" rule of thumb, the market may still need 4 to 8 months of "grinding" in the bottom area until the second half of 2026.
However, this simple linear extrapolation is facing unprecedented challenges. This cycle (2024-2026) shows significant structural heterogeneity, primarily reflected in two dimensions:
Institutional Anchor Points Introduced by ETFs: The approval of the U.S. spot Bitcoin ETF has not only brought incremental capital but, more importantly, changed the structure of holders. Institutional funds (such as BlackRock's IBIT, Fidelity's FBTC holdings) have a stronger risk tolerance and longer investment duration compared to retail investors. Data shows that even when prices fall below the average cost baseline of the ETF (about $60,000-$64,000 range), ETFs have not experienced catastrophic net outflows but rather exhibited a "buy the dip" positioning characteristic. This institutional “floor” effect may significantly raise the market's pain threshold, making it difficult for prices to repeat drawdowns of over 80%.
Dominance Shift of Macro Factors: As Bitcoin's market capitalization exceeds $1 trillion, its asset attributes have evolved from being merely an "alternative speculative asset" to a "macro-sensitive emotional asset." The correlation of Bitcoin with the Nasdaq index, gold, and the 10-year U.S. Treasury yield reached historical highs in 2025-2026. This means that Bitcoin price fluctuations are no longer solely driven by endogenous halving supply shocks but are increasingly constrained by the gates of global dollar liquidity.
Therefore, determining "where the bottom is" cannot simply rely on the calendar (time period) or ruler (drawdown magnitude), but must deeply deconstruct the macro variables currently dominating price behavior.
1.2 The "Warsh Shock": The Federal Reserve's Policy Shift and Shadow of Liquidity Tightening
The sharp adjustment of Bitcoin and the entire cryptocurrency market at the beginning of 2026 stems not from an endogenous decline of blockchain technology, but from a sudden change in the macro-financial environment—referred to in the market as the "Warsh Shock."
On January 30, 2026, former Federal Reserve Governor Kevin Warsh was nominated as the new Federal Reserve Chair, succeeding the outgoing Jerome Powell. This personnel change triggered a tumultuous shake in the financial markets. Warsh has long been portrayed as an "inflation hawk" and a "critic of quantitative easing (QE)." The policy inclinations revealed in his nomination hearing and prior statements—termed the "Warsh Doctrine"—advocate for an aggressive "monetary barbell strategy":
Short-term Interest Rate End: May maintain neutral or slightly accommodative rates to support real economic growth.
Balance Sheet End: Advocates for aggressive quantitative tightening (QT), accelerating the reduction of the Federal Reserve's balance sheet of up to $6.6 trillion to restore the central bank's policy space and financial discipline.
This policy combination is expected to directly lead to a surge in long-term treasury yields. The yield on 10-year U.S. Treasurys rapidly broke through the critical psychological barrier of 4.5% in early February, triggering a re-evaluation of valuations across asset classes. For Bitcoin, an asset extremely sensitive to liquidity, the surge in risk-free returns and the Federal Reserve's balance sheet reduction mean the exhaustion of marginal buying and the withdrawal of existing funds.
Moreover, at the FOMC meeting in January 2026, the Federal Reserve decided to keep the federal funds rate unchanged in the target range of 3.50%-3.75%, pausing its previous rate-cutting steps. Although the market still anticipates some degree of rate cuts in 2026, the shadow of "higher for longer" once again looms over the market. Analyses from institutions like JPMorgan and BlackRock indicate that in the context of inflation not fully returning to the 2% target and a still-strong labor market, expectations for excessive easing have been revised.
This macro backdrop provides important clues for assessing Bitcoin's bottom: the "market bottom" of this cycle is highly likely to coincide with the "liquidity bottom." Until the Federal Reserve stops reducing its balance sheet or clearly signals a loosening of liquidity, it is difficult for Bitcoin to initiate a new round of unilateral bull market, and it is more likely to present as wide fluctuations in the bottom region.
2. Miner Economics: The Hardcore Logic of Physical Bottoms and Shutdown Price Defense Lines
In Bitcoin's valuation system, miners are not only maintainers of the network but also the "last line of defense" for prices. The production costs of miners (especially electricity costs and hardware depreciation) constitute Bitcoin's "physical bottom." When the coin price falls below the shutdown price of mainstream mining machines, high-cost miners will be forced to shut down, leading to a decline in the network's overall hash rate, subsequently triggering a difficulty adjustment, which ultimately lowers the unit cost for remaining miners, creating a self-regulating price mechanism. This process is referred to as "Miner Capitulation," which has historically been one of the most accurate signals of market bottoms.
2.1 Hash Rate Purge: The Largest Withdrawal and Difficulty Adjustment Since 2021
In February 2026, the Bitcoin network underwent a historically significant stress test. Data shows that the mining difficulty of the Bitcoin network plummeted by approximately 11.16% in a single adjustment cycle. This is the largest single negative adjustment the network has faced since China's全面禁止比特币挖矿?
免责声明:本文章仅代表作者个人观点,不代表本平台的立场和观点。本文章仅供信息分享,不构成对任何人的任何投资建议。用户与作者之间的任何争议,与本平台无关。如网页中刊载的文章或图片涉及侵权,请提供相关的权利证明和身份证明发送邮件到support@aicoin.com,本平台相关工作人员将会进行核查。


