Yesterday, I made a relatively bold prediction about the bottom of this round of the bear market: the bottom is highly likely to be between 40,000 and 50,000. At the same time, I also made a speculation about the top of the next bull market, which may be around 190,000.
The market is always step by step, and I often emphasize one thing: do not predict the market, we just follow it. The real bottom can only be confirmed after it forms, not "felt" in advance during the decline.
However, giving the range of 40,000 to 50,000 yesterday was not a random guess, but a probabilistic judgment based on price action analysis. In my view, this is the most likely scenario at present. But even so, it does not mean that as soon as the price reaches this range, we can directly buy a large amount of spot.
The key is not "whether it has reached," but "whether it is stable."
Only when the price stabilizes within this range and starts to construct a bottom structure will we consider building positions in spot.
About Cycle Judgment
Yesterday, I also talked about a very important viewpoint:
After the third quarter of this year, Bitcoin is highly likely to find a bottom.
To be more specific, before 2026, that is, this year, it is highly likely to complete the bottoming process.
But in terms of timing, I tend to think the bottom will occur in the second half of the year.
In other words, this year is a bottoming year, a year to prepare for the next bull market.
Typically, in a bear market, the decline reaches a point where most people only realize it when the market has already moved significantly.
For example, when it was at 126,000, we gave a top signal, but at that time, many people were still extremely bullish; even when the price began to retreat, many still held a bullish outlook. It wasn't until the sharp decline that the market truly realized: the bear market has arrived.
But when most people realize the bear market, the drop has actually exceeded 60%. I believe the current drop is at least over 60%.
What does this mean?
When the market begins to panic thoroughly, prices are often already close to the bottom area, not just entering the initial stage of the bear market.
The logic is symmetrical:
When people are extremely bullish at a high level, calling for 200,000, it is often the top.
When panic spreads and everyone confirms a bear market, it is often already close to the bottom.
Why do many people not make money in a bull market?
Many people, even when buying at relatively low levels, ultimately do not make money. The problem is not with the market, but with human nature.
Assuming the bottom of this round is indeed between 40,000 and 50,000.
You buy in this range, but when it rises to 60,000, 70,000, or 80,000, you might have already sold because there will be a lot of voices in the market interfering with your judgment.
Then the price breaks through new highs to 120,000, and you chase in again.
A subsequent 30% to 40% retracement shakes you out of the position.
Stop loss, cut losses.
Then chase the high again, retrace again, and cut losses again.
Many people's operational paths in a bull market are basically like this.
Therefore, the real opponent is not others, but human nature itself.
Back to Short-term Structure
Today, we focus on short-term.
Recently, many people have started to do short-term high-leverage operations, the reason being that last week was very volatile, and the weekend was a high-level consolidation, with no obvious direction from Monday until now.
Our main idea recently has been to short at high levels.
Recently engaged in several short positions, achieving 6 profits and 1 loss.
Yesterday, I participated in a BCH short, and previously did an Ethereum short, with an overall strategy of shorting at high levels.
One Hour Structure Analysis
Back to the one-hour level.
Currently, a confirmed effective resistance level has formed above, while a new bearish structure has emerged:
Decline
Bounce
Further decline
Swing high and low points continuously drop
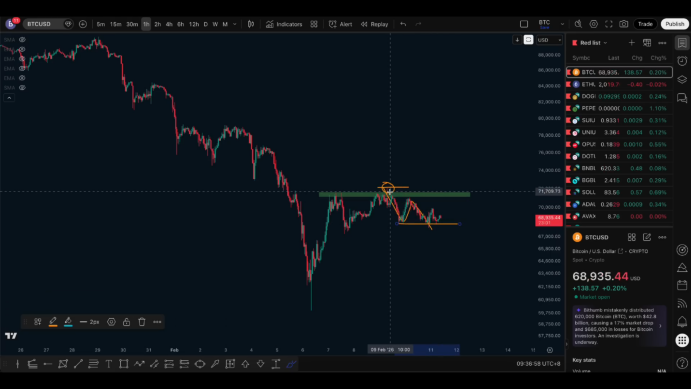
Yesterday, the shorting idea was given above 70,000, with a defensive level at 72,000.
It fell to a low of 68,000, providing nearly 2,000 points of space.
The current low has already been broken, confirming the continuation of the structure.
Therefore, the first expectation, which I believe has the highest probability, is:
First expectation (main logic)
Resistance level effective
Bearish structure established
Next, it will experience a two-wave pullback
Approaching the previous low
It may not necessarily break, but will be close
In terms of operations:
Existing short positions can continue to be held
Defensive level moves from 72,000 to 71,000
Those who have not entered can attempt with low leverage
Exit if resistance above is broken
Second Expectation (Complex Scenario)
This possibility also exists:
First break the previous low
Liquidate high-level longs
Do not give shorts too much profit space
Then break up through the resistance
Liquidate shorts
Finally, go through another round of decline
That is:
Break down → Break up → Decline again
A common "double false move" structure in the market.
Historical experience shows that if the first break is false downward, then the final direction is often downward; if the first break is false upward, the final direction is often upward.
But currently, we are not participating in this expectation.
Core Principle
I have always emphasized:
We only operate based on what we see, not on what we speculate.
What we currently see is:
Effective horizontal resistance
Bearish structure formed
So we will participate in the short trend.
If the high is broken, exit the short position.
If the low is breached, move the stop loss for defense.
If it breaks up directly, that indicates a consolidating upward structure, possibly entering a period of volatility.
Short-term is short-term; holding positions is not recommended, and strict stop losses are advised.
Follow me, join the community,let’s progress together.

免责声明:本文章仅代表作者个人观点,不代表本平台的立场和观点。本文章仅供信息分享,不构成对任何人的任何投资建议。用户与作者之间的任何争议,与本平台无关。如网页中刊载的文章或图片涉及侵权,请提供相关的权利证明和身份证明发送邮件到support@aicoin.com,本平台相关工作人员将会进行核查。