In 2025, the total market capitalization of the cryptocurrency market repeatedly refreshed historical highs, with the scale of on-chain stablecoins and asset tokenization continuing to expand. The flow of funds between on-chain and centralized trading platforms has noticeably accelerated. In this environment of high volatility and high supply, the platform's ability to cover and filter new assets, as well as the price discovery and pricing trajectory after assets go live, has become an important entry point for observing liquidity acceptance efficiency and changes in risk appetite. Based on the 447 new assets launched on Gate in 2025, this article conducts a statistical review of multiple time windows from 5 minutes to 30 days after launch, characterizing overall performance and structural differences through indicators such as the proportion of assets that increased, the increase in rising samples, and the median increase.
Overall Sample Overview: New Launch Structure and First-Day Return Distribution
In terms of supply quantity, Gate launched a total of 447 new assets in 2025, of which 318 were first launches (including 28 exclusive ones) and 129 were non-first launches, with the first launch accounting for about 71%. The new asset supply on the platform mainly comes from first launch projects, rather than the secondary listing of existing coins from other platforms.
If we take the opening price at launch as a uniform benchmark, about 54.8% (245/447) of the assets were still above the opening price 24 hours after launch. Among the rising samples, the average increase over 24 hours reached 635%; however, observing the median value from the full sample (including declining projects), the median increase over 24 hours was 7.57%, which further converged to 3.71% after excluding extreme volatility (increase >1,000%, -90%). This comparison reflects, on one hand, the significant excess return space within the first-day window, and on the other hand, indicates that high multiples of increases are concentrated in a few tokens, with the overall return distribution exhibiting a typical long-tail characteristic.
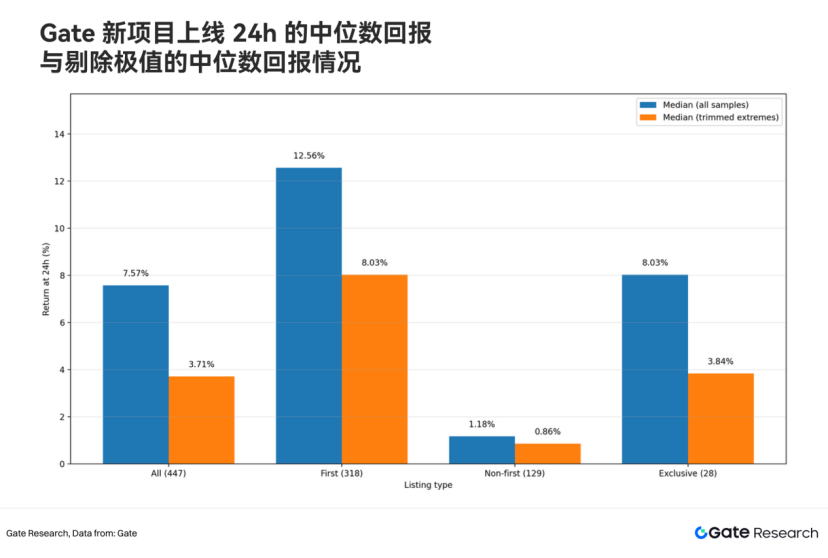
Further breaking down by launch type, there are significant differences in performance on the first day between first launches and non-first launches: the median increase in the 24-hour window for first launch projects was 12.56% (excluding extreme values 8.03%), significantly higher than the 1.18% for non-first launches (excluding extreme values 0.86%). The above differences are not only reflected in the 24-hour window but also further widen at finer early time points, forming clearer layers in the return curves between different types.
Multiple Time Windows: Return Trajectories from 5 Minutes to 30 Days
Breaking down by time dimension, the performance of new coins on Gate was statistically segmented for 5 minutes, 30 minutes, 1 hour, 12 hours, 24 hours, 72 hours, 7 days, and 30 days:
1. Short Cycle Windows Show Higher Positive Return Coverage Rates
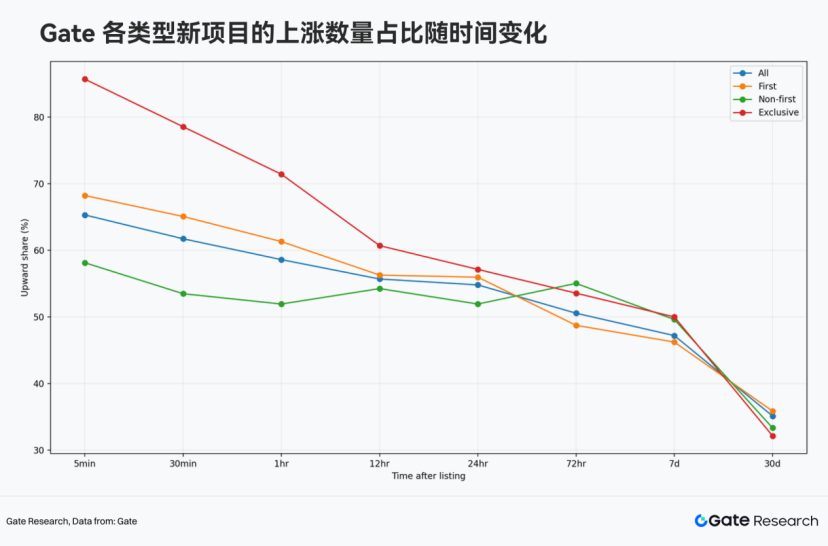
The 447 samples overall show a higher positive return coverage rate in the short cycle windows after launch, but this advantage diminishes as time extends.
Calculating for the full sample:
• 30 minutes: 276/447 increased, with an increase proportion of 61.74%
• 24 hours: 245/447 increased, with an increase proportion of 54.81%
• 72 hours: 226/447 increased, with an increase proportion of 50.56%
• 7 days: 211/447 increased, with an increase proportion of 47.20%
• 30 days: 157/447 increased, with an increase proportion of 35.12%
Overall, the time range where "the proportion of increasing numbers exceeds half" is mainly concentrated within the first 24 hours after launch; by around 72 hours, the proportion of increasing numbers approaches a 50-50 split; by the 30-day dimension, the number of increasing samples drops to about one-third.
2. Significant Median Return Differentiation Between First Launch and Non-First Launch in Early Windows
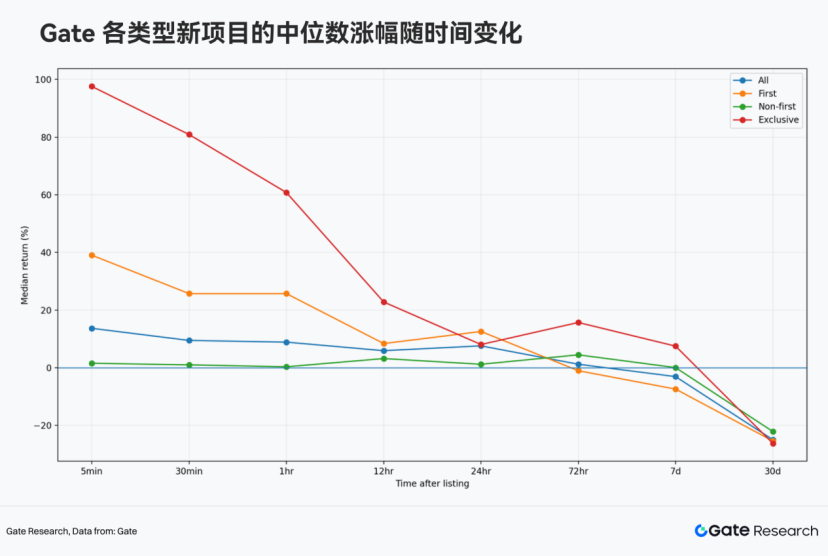
From the time series of median returns, different types of new projects on Gate show clear stratification in the early windows after launch: first launch projects, especially exclusive ones, maintain higher median return levels at multiple time points from 5 minutes to 24 hours; the median of non-first launch projects is generally closer to the zero axis. As the window extends to 72 hours and beyond, the median generally weakens and gradually converges.
Comparing the median increase of the full sample between first launch and non-first launch projects:
• 30 minutes: first launch 25.69%, non-first launch 0.98%
• 24 hours: first launch 12.56%, non-first launch 1.18%
The corresponding number of increasing assets also shows a gap:
• 30 minutes: first launch 65.09%, non-first launch 53.49%
• 24 hours: first launch 55.97%, non-first launch 51.94%
It is evident that in the most critical price discovery window after asset launch, the median return space for Gate's first launch samples is larger, while non-first launches are closer to "narrow fluctuations around the zero axis," especially in projects exclusively launched on Gate, which show a higher positive return coverage rate: the proportion of increasing numbers within 30 minutes of opening is close to 80% (22/28), with a median increase of about 81%; in the 1-hour window, the median increase still exceeds 60%.
3. Around Three Days is a Key Node Where Overall Returns Shift from Positive to "Only a Few Can Continue to Rise, Most Retract or Weaken"
From the time series of the median of the full sample, it can be seen that the median increase in the 24-hour window is still positive (7.57%), but by 72 hours it significantly weakens (median increase 1.20%, excluding extreme values -0.49%), indicating that around three days it is close to the breakeven line. Subsequently, in the 7-day and 30-day windows, the median increases drop to -3.10% and -25.01% (excluding extreme values -5.72% and -24.12%), and the proportion of increasing projects also falls back to 47.20% and 35.12%. This result indicates that the return structure of new coins after launch does not exhibit a linear continuation relationship; on a time scale of around three days, the advantages of the price discovery phase gradually fade, and the trend differentiation and retracement between assets begin to dominate.
First Launch, Exclusive, and Non-First Launch: Return Curve Differentiation and Opportunity Density
Through the above statistical analysis of multiple time windows, it is not difficult to find that Gate's first launch projects and non-first launch projects exhibit different return curve shapes, with first launches more likely to convert enthusiasm into more visible increases and higher coverage rates of increases, while non-first launches are closer to relatively flat fluctuations around the zero axis. This difference is underpinned by Gate's systematic results in the structure of new launches, project selection, and execution of first launches throughout the year: first launch projects not only constitute the main body of new supply in quantity (318/447) but also more easily form clearer market feedback during the critical price discovery phase.
Within the first launch system, exclusive projects further reinforce this characteristic: they resemble "selected samples" of Gate's first launch capability, reflecting higher positive return coverage rates and clearer price feedback in the early launch window—exclusive projects have a positive return coverage rate close to 80% within 30 minutes of opening, with a median increase of about 81%, and more than 1/3 of exclusive projects achieving ≥100% increase within 30 minutes.
The significance of exclusive samples lies not only in the rise and fall of individual projects but also in their more direct reflection of Gate's comprehensive capabilities in project selection, first launch execution, liquidity organization, and capturing market enthusiasm—meaning the platform can not only provide new supply but also transform "new launches" into a process of trading, pricing, and creating wealth effects that can be quickly validated by the market.
Looking back at the representative project trajectories of 2025, Gate's first launch system is not lacking in cases of "dozens of times" wealth effects. From entry-type assets with a massive user and traffic base to technology narrative targets like AI infrastructure, and to meme assets driven by community culture, some first launch projects have completed rapid transitions from attention to trading enthusiasm to price reassessment within a short cycle. Although high multiples of returns do not uniformly occur for all assets, exclusive projects within first launches clearly form stronger market feedback, which precisely reflects Gate's efficiency in screening high-attention assets, execution speed of first launches, and liquidity acceptance capabilities during critical windows.
In the category of "super large user scale and traffic entry" assets, projects represented by Pi Network (PI) possess strong external attention and community foundations. After launching on Gate, PI saw an increase of nearly 60 times over 7 days. For the platform, the challenge with such assets is not just "whether to launch," but whether it can quickly accommodate the concentrated influx of trading demand in an environment of high attention and high controversy, efficiently complete price discovery in critical windows, and convert attention into tangible trading enthusiasm and wealth effects.
In the ongoing diffusion of AI narratives in 2025, transitioning from the application layer to the infrastructure layer, Gate continues to cover AI+Infra direction assets, forming a more complete new launch structure between "traffic-type" and "technology-type" assets. Taking Unibase (UB), an early AI infrastructure potential target related to the x402 protocol, as an example, its phased performance after launching on Gate shows a characteristic of steady upward movement, maintaining relative stability and continuing to rise during the market's severe fluctuations on October 11, ultimately reaching an ATH of $0.086 on October 30, over 500% higher than the opening price.
In the cycle where crypto-native driven meme and community culture accelerate segmentation, attention often exhibits characteristics of high-frequency migration, explosive dissemination, and rapid differentiation. Projects represented by Mubarak (MUBARAK) and Useless (USELESS) derive their pricing logic more from cultural symbols, dissemination efficiency, and the speed of community consensus. The platform's capability with such assets hinges on whether it can quickly respond and timely accommodate trading demand during the upward phase of enthusiasm. After launching MUBARAK at the initial stage of enthusiasm, Gate saw its single-day increase exceed 120%. Behind this is Gate's keen grasp of the rhythm of the attention economy—keeping up and accommodating during the upward trend of hotspots also allows the first launch pool to maintain stronger participation and higher opportunity density amidst narrative rotations.
Based on the 447 new assets launched on Gate in 2025, the data presents three relatively clear conclusions: First, in a market environment characterized by high volatility and high supply, Gate maintained a high density of new asset supply, with first launches accounting for about 71%, making the first launch pool the main structure of the platform's new supply; Second, looking at the key price discovery windows from 5 minutes to 24 hours, the median returns and positive return coverage rates of first launch and exclusive samples are more prominent, indicating that Gate not only launches quickly but also more easily forms perceivable wealth effects in the early windows; Third, as the time extends to 72 hours, 7 days, and 30 days, the median increases of the samples gradually weaken and enter a differentiation range, suggesting that the return structure of new coins does not exhibit a linear continuation. However, this also highlights the platform's value in selection and execution during the early windows—during a period of accelerated narrative rotation and frequent attention migration, Gate's first launch and exclusive system can more easily convert attention into trading enthusiasm and pricing results, and form stronger wealth effects and market responses on certain high-potential projects.
Gate Research Institute is a comprehensive blockchain and cryptocurrency research platform that provides readers with in-depth content, including technical analysis, hot insights, market reviews, industry research, trend forecasts, and macroeconomic policy analysis.
Disclaimer
Investing in the cryptocurrency market involves high risks. Users are advised to conduct independent research and fully understand the nature of the assets and products they purchase before making any investment decisions. Gate is not responsible for any losses or damages resulting from such investment decisions.
免责声明:本文章仅代表作者个人观点,不代表本平台的立场和观点。本文章仅供信息分享,不构成对任何人的任何投资建议。用户与作者之间的任何争议,与本平台无关。如网页中刊载的文章或图片涉及侵权,请提供相关的权利证明和身份证明发送邮件到support@aicoin.com,本平台相关工作人员将会进行核查。


