Based on the trend of this candlestick chart (combined with multiple indicator lines), the core analysis is as follows:
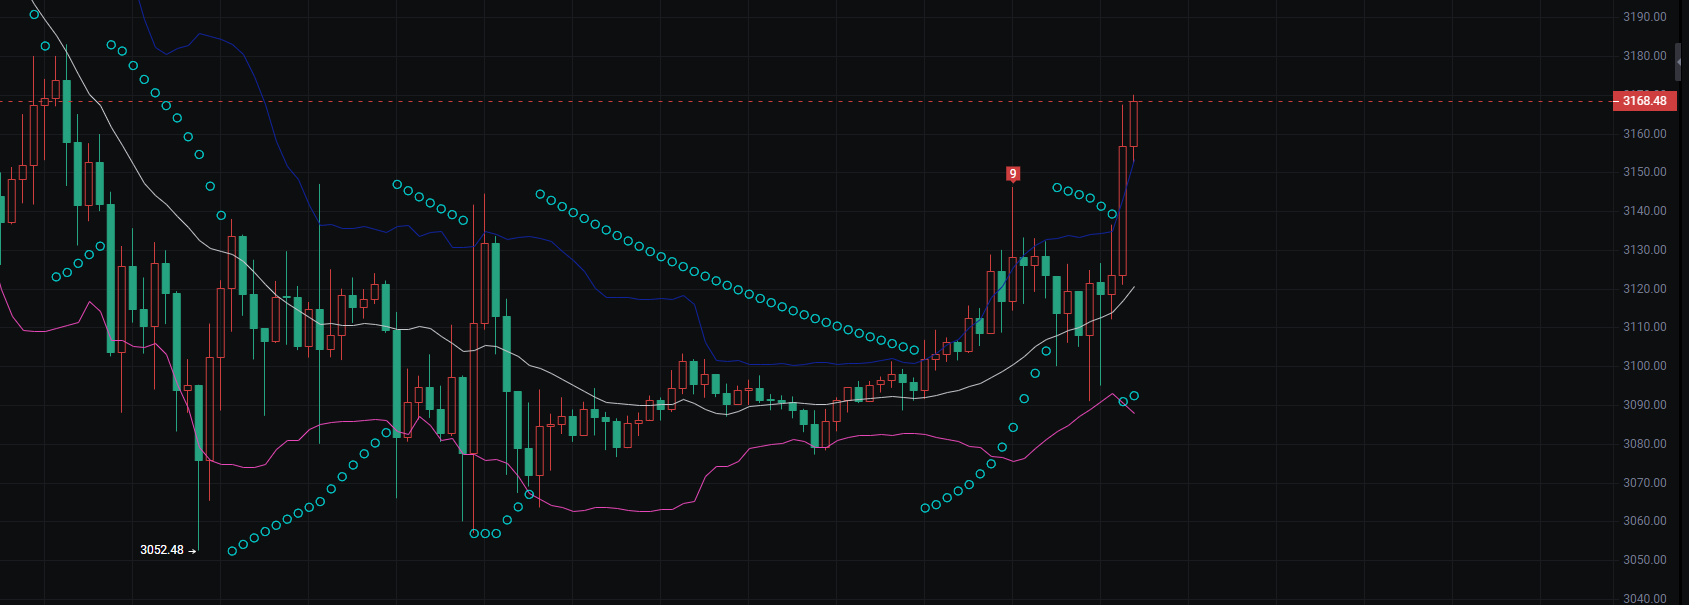
Trend Status ◦ After the price created a new low of 3052.48, it quickly rebounded and is currently rising to around 3141.05. The candlestick formed a long red bar, and the indicator pink line and white line are both turning upwards, temporarily easing the short-term bearish trend and initiating an oversold rebound for the bulls. ◦ The momentum from the previous continuous decline has been fully released at the low point, and the rebound has broken through the key resistance line of 3119.7, indicating a strong willingness for a bullish counterattack. However, in the medium term, it is still necessary to see if it can stabilize at the key level after the rebound.
Key Support and Resistance ◦ Support Level: First support at $3120 (recent rebound consolidation platform), strong support at $3100 (important stabilization point after the low point rebound); if it falls below $3100, the rebound trend may quickly reverse. ◦ Resistance Level: First resistance at $3141 (current price level + previous consolidation pressure), strong resistance at $3160 (indicator white line suppression level + rebound high point during the previous decline); breaking through $3160 may open up the rebound space towards $3180.
Trading Operation Tips ◦ In the short term, focus on going long on pullbacks. If the price stabilizes in the $3120-$3100 range, long positions can be established, with a stop loss set below $3090. ◦ If the price rebounds to the $3141-$3160 range and encounters resistance, and the candlestick shows a bearish bar with increased volume, a light short position can be attempted, with a stop loss set above $3160, targeting around $3120.
From a technical perspective, this chart exhibits strong characteristics of a V-shaped reversal + volume breakout, with the core analysis as follows:
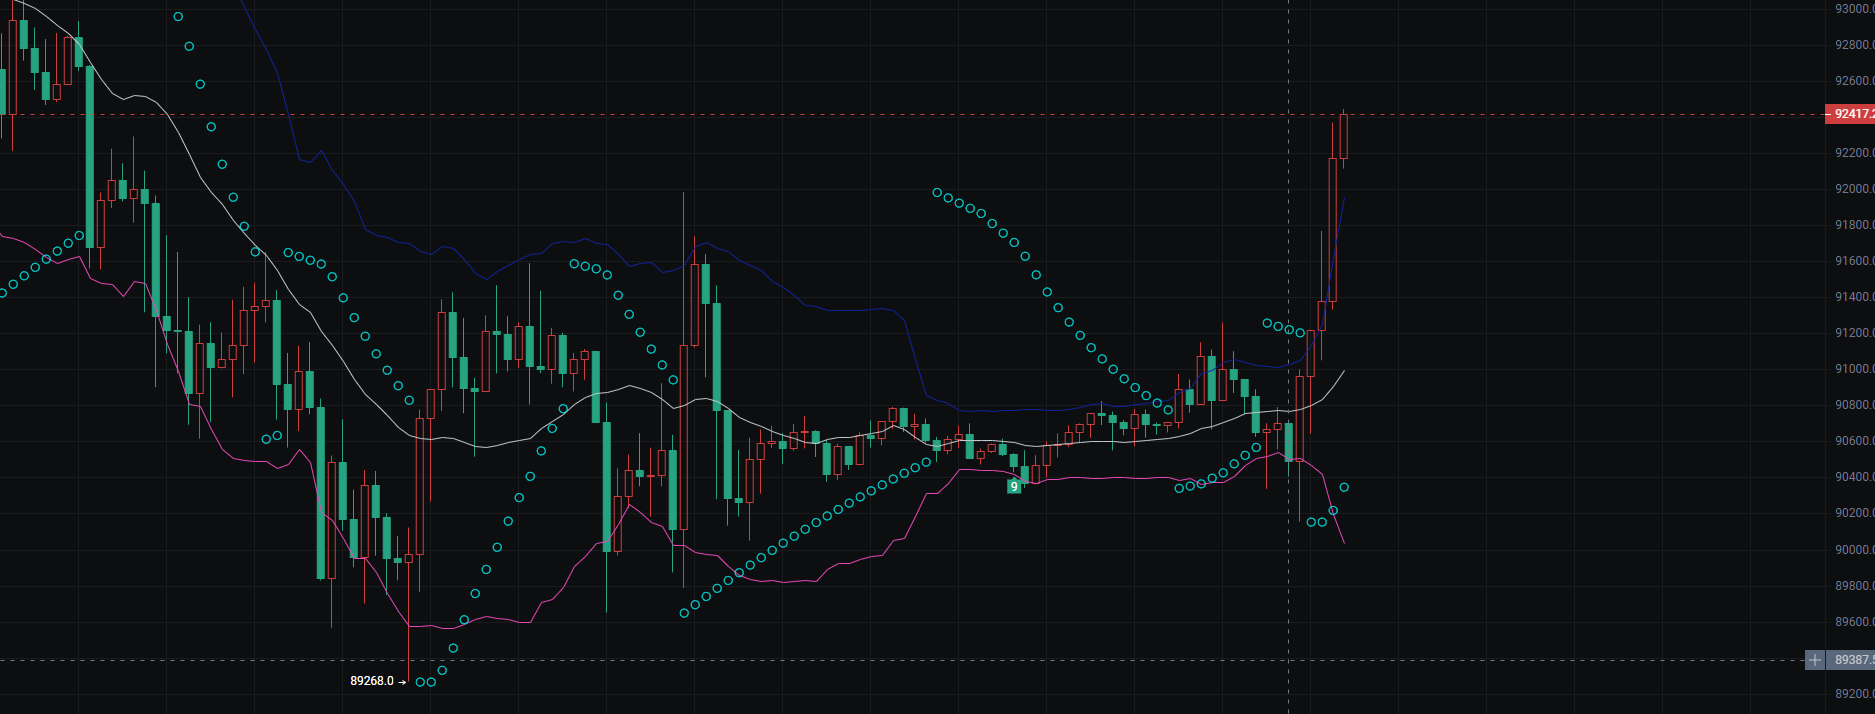
Trend and Pattern The price first dipped to a low of 8926.0 before bottoming out, forming a rapid V-shaped reversal. Recently, it broke through the key resistance level of 9247.7 with a large bullish candlestick and increased volume, indicating a clear short-term bullish trend, typical of an oversold rebound + trend reversal pattern.
Indicator Signals The moving average/track indicators (colored curves + dots) in the chart show that the price has quickly crossed above multiple indicator lines. Although there is a short-term divergence (the price is significantly above the indicator lines), the upward trend of the indicators remains unchanged, and bullish momentum has not yet exhausted.
Key Levels and Operational Points ◦ Support Level: 9247.7 (previous resistance turned into immediate support), followed by the 9100 range (upper edge of the previous consolidation platform); ◦ Resistance Level: Pay attention to the 9300 integer level and the previous high point in the 9300 - 9350 range; ◦ Risk Warning: The short-term increase is too large. If the support at 9247.7 is lost, it may trigger profit-taking, so caution is needed regarding the risk of a pullback; if it stabilizes at this support, the bulls will continue to push towards higher levels.
For more high-quality real-time strategies, please contact the teacher and follow the public account - Bit Bear.

免责声明:本文章仅代表作者个人观点,不代表本平台的立场和观点。本文章仅供信息分享,不构成对任何人的任何投资建议。用户与作者之间的任何争议,与本平台无关。如网页中刊载的文章或图片涉及侵权,请提供相关的权利证明和身份证明发送邮件到support@aicoin.com,本平台相关工作人员将会进行核查。