1. Current Overall Idea
What we need to focus on the most right now is the key interval below, to see if the price can stop falling in this area and establish a short-term bottom.
From a structural perspective, after a slight rebound at the bottom, a clear horizontal resistance level formed above. At that time, we had already indicated a bearish expectation, judging that there would be a period of new decline.
Initially, we judged that there might be a new low, but we later adjusted our view—not looking directly for a new low, but observing the price undergo a decline after facing resistance at the upper horizontal level.
On the 10th, I also shared that at this position we are not looking for a new low for the time being. Because if it directly breaks below the previous low, it would indicate the continuation of a long-term bearish trend. However, I personally lean more towards the idea of entering a fluctuation cycle in the short term.
The premise of this so-called fluctuation cycle is that the low cannot be effectively broken.
2. Key Resistance and Current Structure
The current structure is still skewed towards bearishness; continuing to bet on short positions in the short term is fine, but it should predominantly be short.
The second key resistance level currently is yesterday's second highest point. This position overlaps with:
The previous stage low
Subsequent retest lows
The pullback level after two breaks below
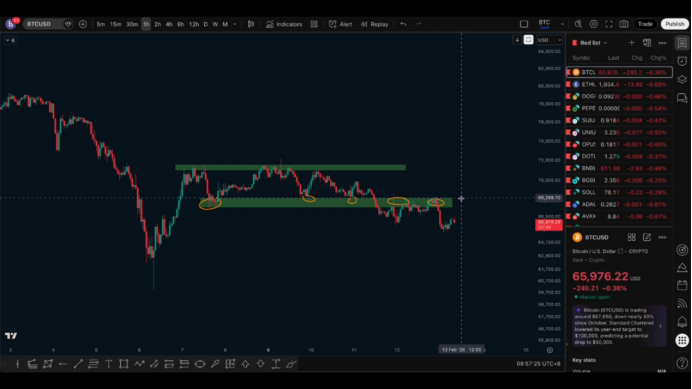
Thus, this area becomes a new key resistance. Yesterday, the price fell sharply in this area, indicating that there is still no clear signal of a stop in the decline.
A new short defense point can be referenced around 68,000. However, attention should be paid to the risk-reward ratio; do not blindly chase shorts.
3. Key Support Interval Below
Two days ago, we mentioned that this rebound and pullback between 0.5-0.68, which corresponds to 66,000-64,600.
Yesterday, the price has entered this interval.
This interval is a healthy pullback area of the entire uptrend. Generally speaking, a 50%-61.8% pullback is considered a healthy correction.
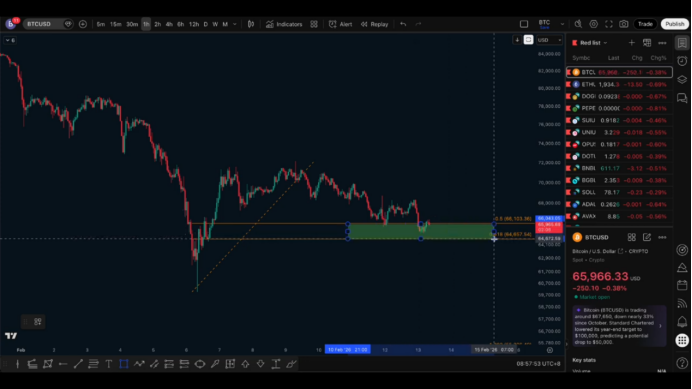
If this interval holds → it may usher in a new phase of rise.
If this interval breaks → bearish momentum is strengthened, and the probability of continuing to explore downwards or even breaking the previous low greatly increases.
Especially at the lowest point of 64,500-64,600, once effectively broken, the probability of breaking the previous low will significantly increase.
The reason is simple: if even the healthy pullback interval cannot hold, it indicates insufficient demand below, with the bears in control.
4. Why Might There Be an Initial Rise?
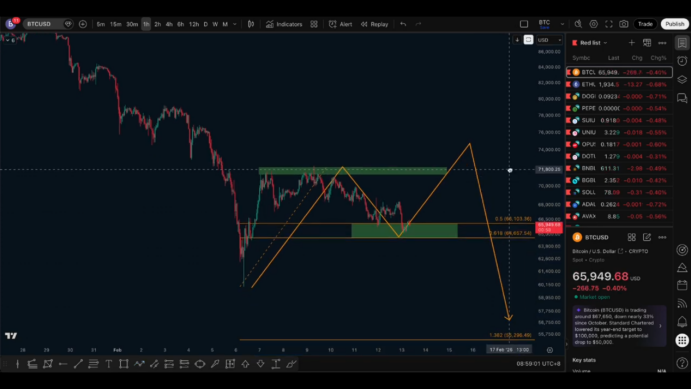
I personally lean towards: even if there is further decline later, there may still be an initial period of bullish structure.
The logic is—main actors often clear out shorts before a real drop happens.
That is to say:
First establish a bullish structure
Break through the horizontal resistance ahead
Induce the market to chase longs
Clear out shorts and induce longs
Then initiate a real decline
Similar to the structure that really turned bearish after breaking 94,000 previously.
This kind of trading strategy is not uncommon in the market, but the premise is that the current interval must hold. If 64,500 is effectively broken, the expectation of "rising and correcting to continue rising" basically loses its validity.
5. Current Operation Strategy Summary
The strategy now is actually very clear:
Situation 1: Break below the interval (break below 64,500)
Consider continuing to short
Target the breaking of the previous low
Watch the area below 60,000
Situation 2: The interval stops falling and breaks upwards
Consider positioning for a short long
Set the defense point at the lowest point of the interval
Monitor the situation of breaking the upper horizontal resistance
Situation 3: The price continues to fluctuate within the 66,000-64,600 interval
Can choose to observe
Patiently wait for clear direction
In a key interval, not acting is also a strategy.
Follow me, join the community, and grow together.

免责声明:本文章仅代表作者个人观点,不代表本平台的立场和观点。本文章仅供信息分享,不构成对任何人的任何投资建议。用户与作者之间的任何争议,与本平台无关。如网页中刊载的文章或图片涉及侵权,请提供相关的权利证明和身份证明发送邮件到support@aicoin.com,本平台相关工作人员将会进行核查。


