一、回顾这两天的走势
价格在7万-71,000区间遇阻回落。其实在2月10号,我就已经分享过这个观点。当时价格在上方形成了明确的阻力,我们判断这是一个有效压力位,确认压力之后,可以偏左侧去尝试短空布局。
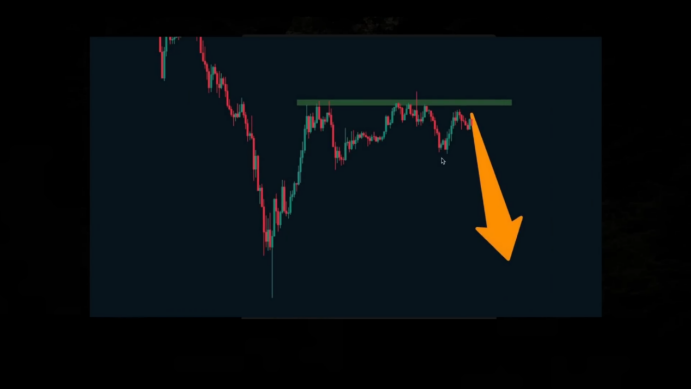
虽然当时还没有走出标准的空头结构,没有连续下移的波段低点,但我们已经强调过——确认有效阻力后,就可以提前做布局。
另外,这一段V反本质上是大周期中的一次底部V反,并不足以直接推动趋势反转,所以大概率还会有一段新的下跌。
随后行情也验证了这个逻辑。价格从7万上方一路回落,最低来到6万6附近,整体有4,000-5,000点的空间。这一段短空,如果一直有关注我观点的朋友,应该是可以参与到的。
我的思路是:
如果是下跌行情,山寨币通常跌幅更大,可以优先考虑山寨;
如果是反弹行情,比特币的反弹力度更强;
如果确认是大周期空头趋势,更倾向做比特币的趋势空;
如果是横盘震荡阶段,短空更适合做山寨,因为山寨通常“跟跌不跟涨”。
最近我们整体就是按照这个逻辑在操作。
二、接下来怎么做?
我直接讲结论:
接下来,我会更倾向于寻找多头交易机会。
从4小时结构看,这一段走势大概率会进入类似前面那段的“中枢调整”。之前那段调整持续了50多天,这一次未必会那么久,但我认为会进入一段阶段性调整。
我们之前讲过,底部V反不会直接带来趋势反转,一定会有新的回落。目前新的回落已经完成,那么接下来就要开始考虑新的多头布局。
而且通常行情在真正大跌之前,会先清算空头;在真正大涨之前,会先清算多头。比如之前价格突破94,000,清算空头,形成诱多,再走下跌。市场往往是这样运作的。
所以我认为接下来会进入一个调整阶段,时间可能在1个月左右。
三、1小时级别的两种做多方案
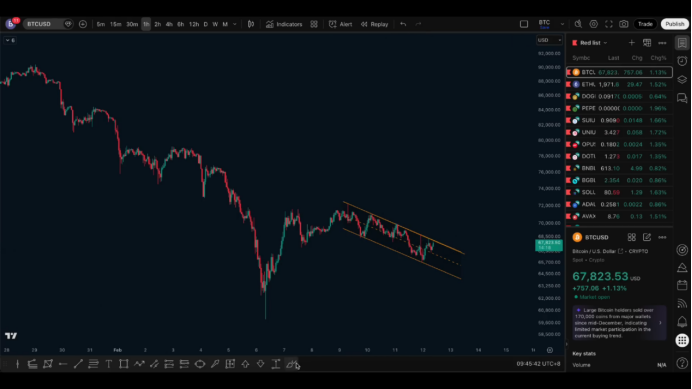
目前1小时结构是一个标准的下降通道,上方趋势线压制非常明显,目前已经是第8次测试。
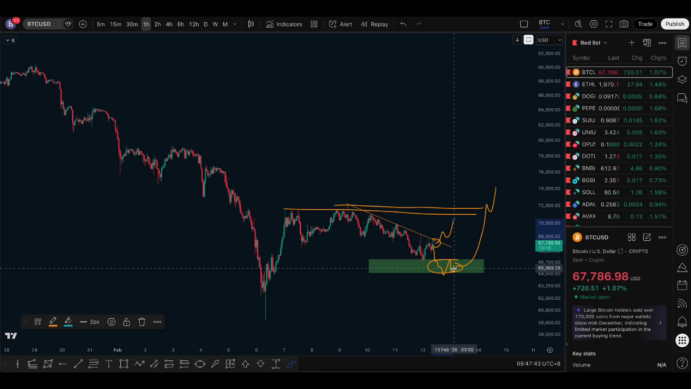
第一种方案:通道上破
如果趋势线被有效突破,可以考虑接入短多。
但目标必须看7万2的突破。无论哪种方式做多,短期目标都是7万2。
入场逻辑,通道上破;
以前方阶段性低点作为防守点;
看7万2破位。
不过这个方案我会临盘再判断,可能做,也可能不做。
第二种方案:回踩0.5-0.618区间
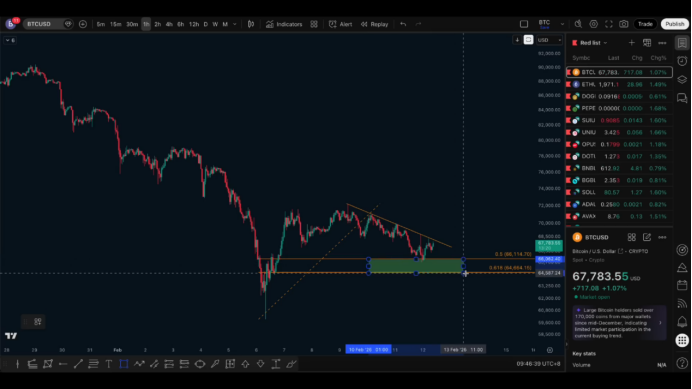
这一段上涨回调的0.5-0.618区间在66,100-64,600之间。
如果价格回落到这个区间,并且:
没有形成有效破位;
有明显止跌企稳、筑底信号;
重新向上突破区间;
我才会考虑分批建立多头仓位。
为什么要等突破区间?
因为突破代表买盘开始主动进场,同时我们也有了清晰的防守点——可以以前方低点作为止损依据。
如果只是跌进区间,没有止跌结构,我不会直接接多,因为没有明确防守逻辑。
我个人更倾向第二种方案。
原因很简单:
如果在65,000附近入场,目标至少看71,000-72,000,有大约7,000点空间,风险收益比才合理。
四、关于底部区域判断
我认为真正的阶段低点在6万3-6万4之间。
更下方的插针我会视为清算杠杆行为,不纳入结构判断。
而66,100-64,600这个区间,距离6万3-6万4只差约1,000点,是比较理想的承接区域。
五、当前可以做什么?
目前:
趋势线没有破位;
下方买区还没到;
做多条件尚未成立。
因此现在没有做多方案。
如果手里有空单,可以继续持有。
如果要尝试新的空头,可以把防守点放在68,000-69,000上方。
下方短线预期目标在65,000附近。
等条件出现,我们再考虑切换思路。
关注我,加入社区,一起进步。

免责声明:本文章仅代表作者个人观点,不代表本平台的立场和观点。本文章仅供信息分享,不构成对任何人的任何投资建议。用户与作者之间的任何争议,与本平台无关。如网页中刊载的文章或图片涉及侵权,请提供相关的权利证明和身份证明发送邮件到support@aicoin.com,本平台相关工作人员将会进行核查。


