Recently, many friends have been asking me a question:
Will Bitcoin replicate the past four-year cycle this time?
I actually provided an answer to this question a long time ago.
- Why I judged the entry into a correction cycle in early October
In early October, when Bitcoin's price was still around 124,000, I clearly stated that Bitcoin had entered a major cycle correction phase.
At that time, I also provided a judgment that Bitcoin's future bottom range would roughly fall between 70,000 and 50,000.
We have repeatedly emphasized one point:
We need to see a price in the 50,000s or 60,000s to consider medium to long-term buying.
- The time pattern of the upward cycle
From a weekly perspective, the duration of the past three major upward trends was:
First round: about 1,070 days
Second round: about 1,070 days
Third round (from 2022 to October this year): about 1,060 days
A very clear pattern can be seen:
The upward cycles are generally concentrated between 1,000 days and 1,100 days.
This is precisely Bitcoin's typical four-year upward cycle.
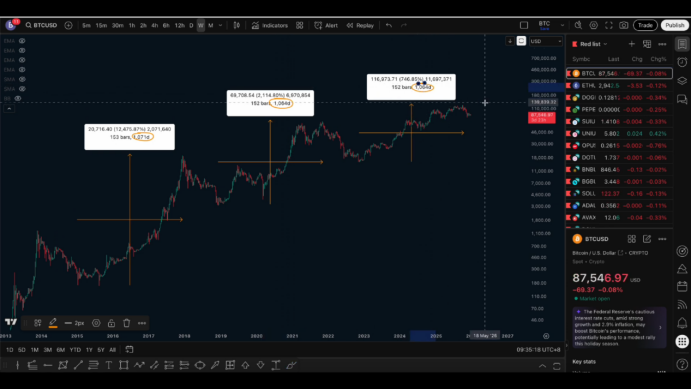
Because of this, combined with the fact that multiple highs and failed breakout structures had already appeared in price behavior at that time, I judged in early October that this round of upward movement was likely over.
Currently, this judgment stands.
- The time and magnitude of the downward cycle
Now let's look at the downward cycle.
In the past few rounds of downward trends:
The duration of the decline is mostly around 365 days
Some are close to 400 days, but overall concentrated around one year
If we calculate based on this rhythm, this round of decline started in early October this year,
the time for Bitcoin to bottom is likely to fall after the third quarter of next year.
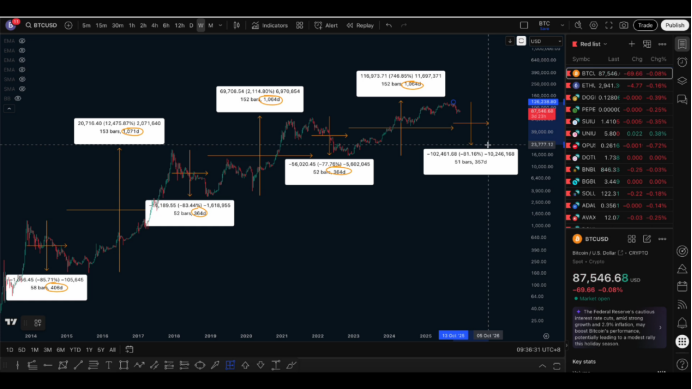
In terms of the magnitude of the decline:
Early cycles saw declines of 85% to 83%
The last round was about 77%
The overall decline shows a trend of gradual convergence
In my view, this round may not see a decline of over 70%,
but at least a retracement of over 50% is very likely to occur.
- Judgment of key price ranges
If we calculate a 50% decline, Bitcoin's price would be around 65,000;
If it reaches a 60% decline, the price would fall below 50,000.
Whether it will definitely reach lower levels is currently uncertain,
but I believe the probability of a decline around 50% is quite high.
From the weekly structure, this round of upward movement experienced three distinct phases of wide fluctuations.
These ranges are essentially areas of concentrated chip exchange,
and once the price returns to these areas, it often forms certain support.
Combined with the important price area of 69,000 at the top of the last bull market,
the comprehensive judgment is that between 65,000 and 60,000 is a relatively reasonable and valuable observation range.
But still, as I said:
Let's see when the price arrives, and take it step by step.
What is clear now is:
This position is not suitable for participating in spot trading.
The reason is simple:
No signs of a bottom
No multi-cycle reversal signals
The downward structure has not yet completed
- The essential reason for the four-year cycle
Many people treat the four-year cycle as a kind of "market curse,"
but in my view, it is essentially a liquidity issue.
As institutional participation continues to increase, Bitcoin is rapidly becoming institutionalized,
it is no longer a completely independent asset but is deeply influenced by the macro environment.
For example:
Liquidity tightening puts pressure on prices
Gold and precious metals rising can divert some funds
Increased demand for safe-haven assets withdraws liquidity from risk assets
Because of this, Bitcoin repeatedly shows
the rhythm of 4 years of rise + 1 year of correction
- Short-term structure and trading thoughts
Back to the short term, today is Christmas, the US stock market is closed, and overall volatility expectations are low.
From a structural perspective:
The key resistance level above remains between 91,000 and 90,500
This position has not been effectively broken
The weekly, daily, and hourly levels are still in a bearish structure
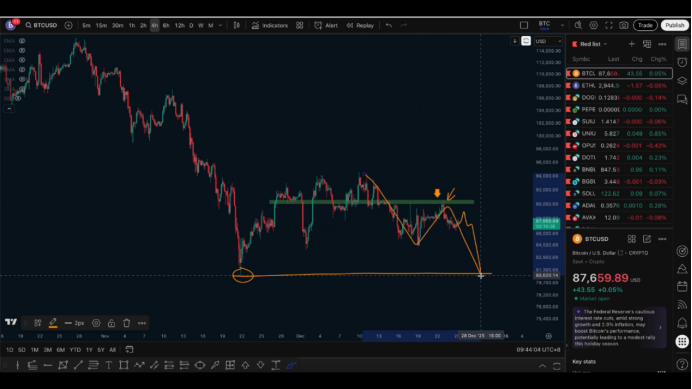
Therefore, the current thought remains unchanged:
Focus on shorting during rebounds
Set the defensive level above 91,000 to 90,500
The short-term target still focuses on whether the 80,000 level forms an effective breakdown
In our member group, we also participated in a short Ethereum trade yesterday,
overall still following the structure, focusing on bearish positions.
Follow me, join the community, and let's progress together.

免责声明:本文章仅代表作者个人观点,不代表本平台的立场和观点。本文章仅供信息分享,不构成对任何人的任何投资建议。用户与作者之间的任何争议,与本平台无关。如网页中刊载的文章或图片涉及侵权,请提供相关的权利证明和身份证明发送邮件到support@aicoin.com,本平台相关工作人员将会进行核查。