Written by: CoinGlass
Introduction
The year 2025 constitutes a clear structural dividing point in the evolution of the cryptocurrency market. In this year, crypto assets further embedded themselves into the mainstream financial system, transitioning from a phase dominated by marginal experimentation. The structure of market participants, trading tools, and regulatory environments underwent significant structural adjustments.
The derivatives market achieved significant expansion in 2025, with a notably more complex market structure. The early single-driven model, primarily characterized by high-leverage retail speculation, was replaced by a more diverse institutional trading demand. The market entered a new phase of "institutional capital dominance, with compliant infrastructure and decentralized technology evolving in parallel." On one hand, traditional financial capital entered the market through channels such as BTC spot ETFs, options, compliant futures, and mergers and acquisitions, with larger scales and clearer compliance pathways. The demand for hedging and basis trading gradually shifted towards on-exchange products, driving a structural rise in CME: after surpassing Binance in 2024 to become the world's largest BTC futures holding platform, CME further consolidated its dominant position in BTC derivatives in 2025, and for the first time approached Binance's retail scale in ETH derivatives market holdings and trading participation. On the other hand, on-chain derivatives, relying on intent-centric architecture and high-performance application chains, began to form functional alternatives to centralized derivatives in specific niche scenarios, especially in censorship-resistant trading and composable strategy execution, creating substantial competitive pressure on CEX in the marginal market share.
The increased complexity and deeper leverage chains simultaneously elevated systemic tail risks. The extreme events that erupted during 2025 posed an unprecedented stress test on existing margin mechanisms, clearing rules, and cross-platform risk transmission paths. Their impact extended beyond single assets or platforms, necessitating a reassessment of the robustness of the entire derivatives ecosystem.
It is important to emphasize that the aforementioned changes are just a slice of the market reconstruction in 2025. Beyond the macro narrative and extreme events, the rise of Perp DEX, the large-scale expansion of stablecoins, the institutional exploration of RWA, the development of DAT architecture, the iteration of on-chain prediction markets, and the gradual implementation of regulatory frameworks in major jurisdictions collectively formed a multidimensional backdrop for the year. These internal structural evolutions and external shock events intertwined to create the overall picture and analytical starting point for the cryptocurrency derivatives market in 2025.
Market Overview
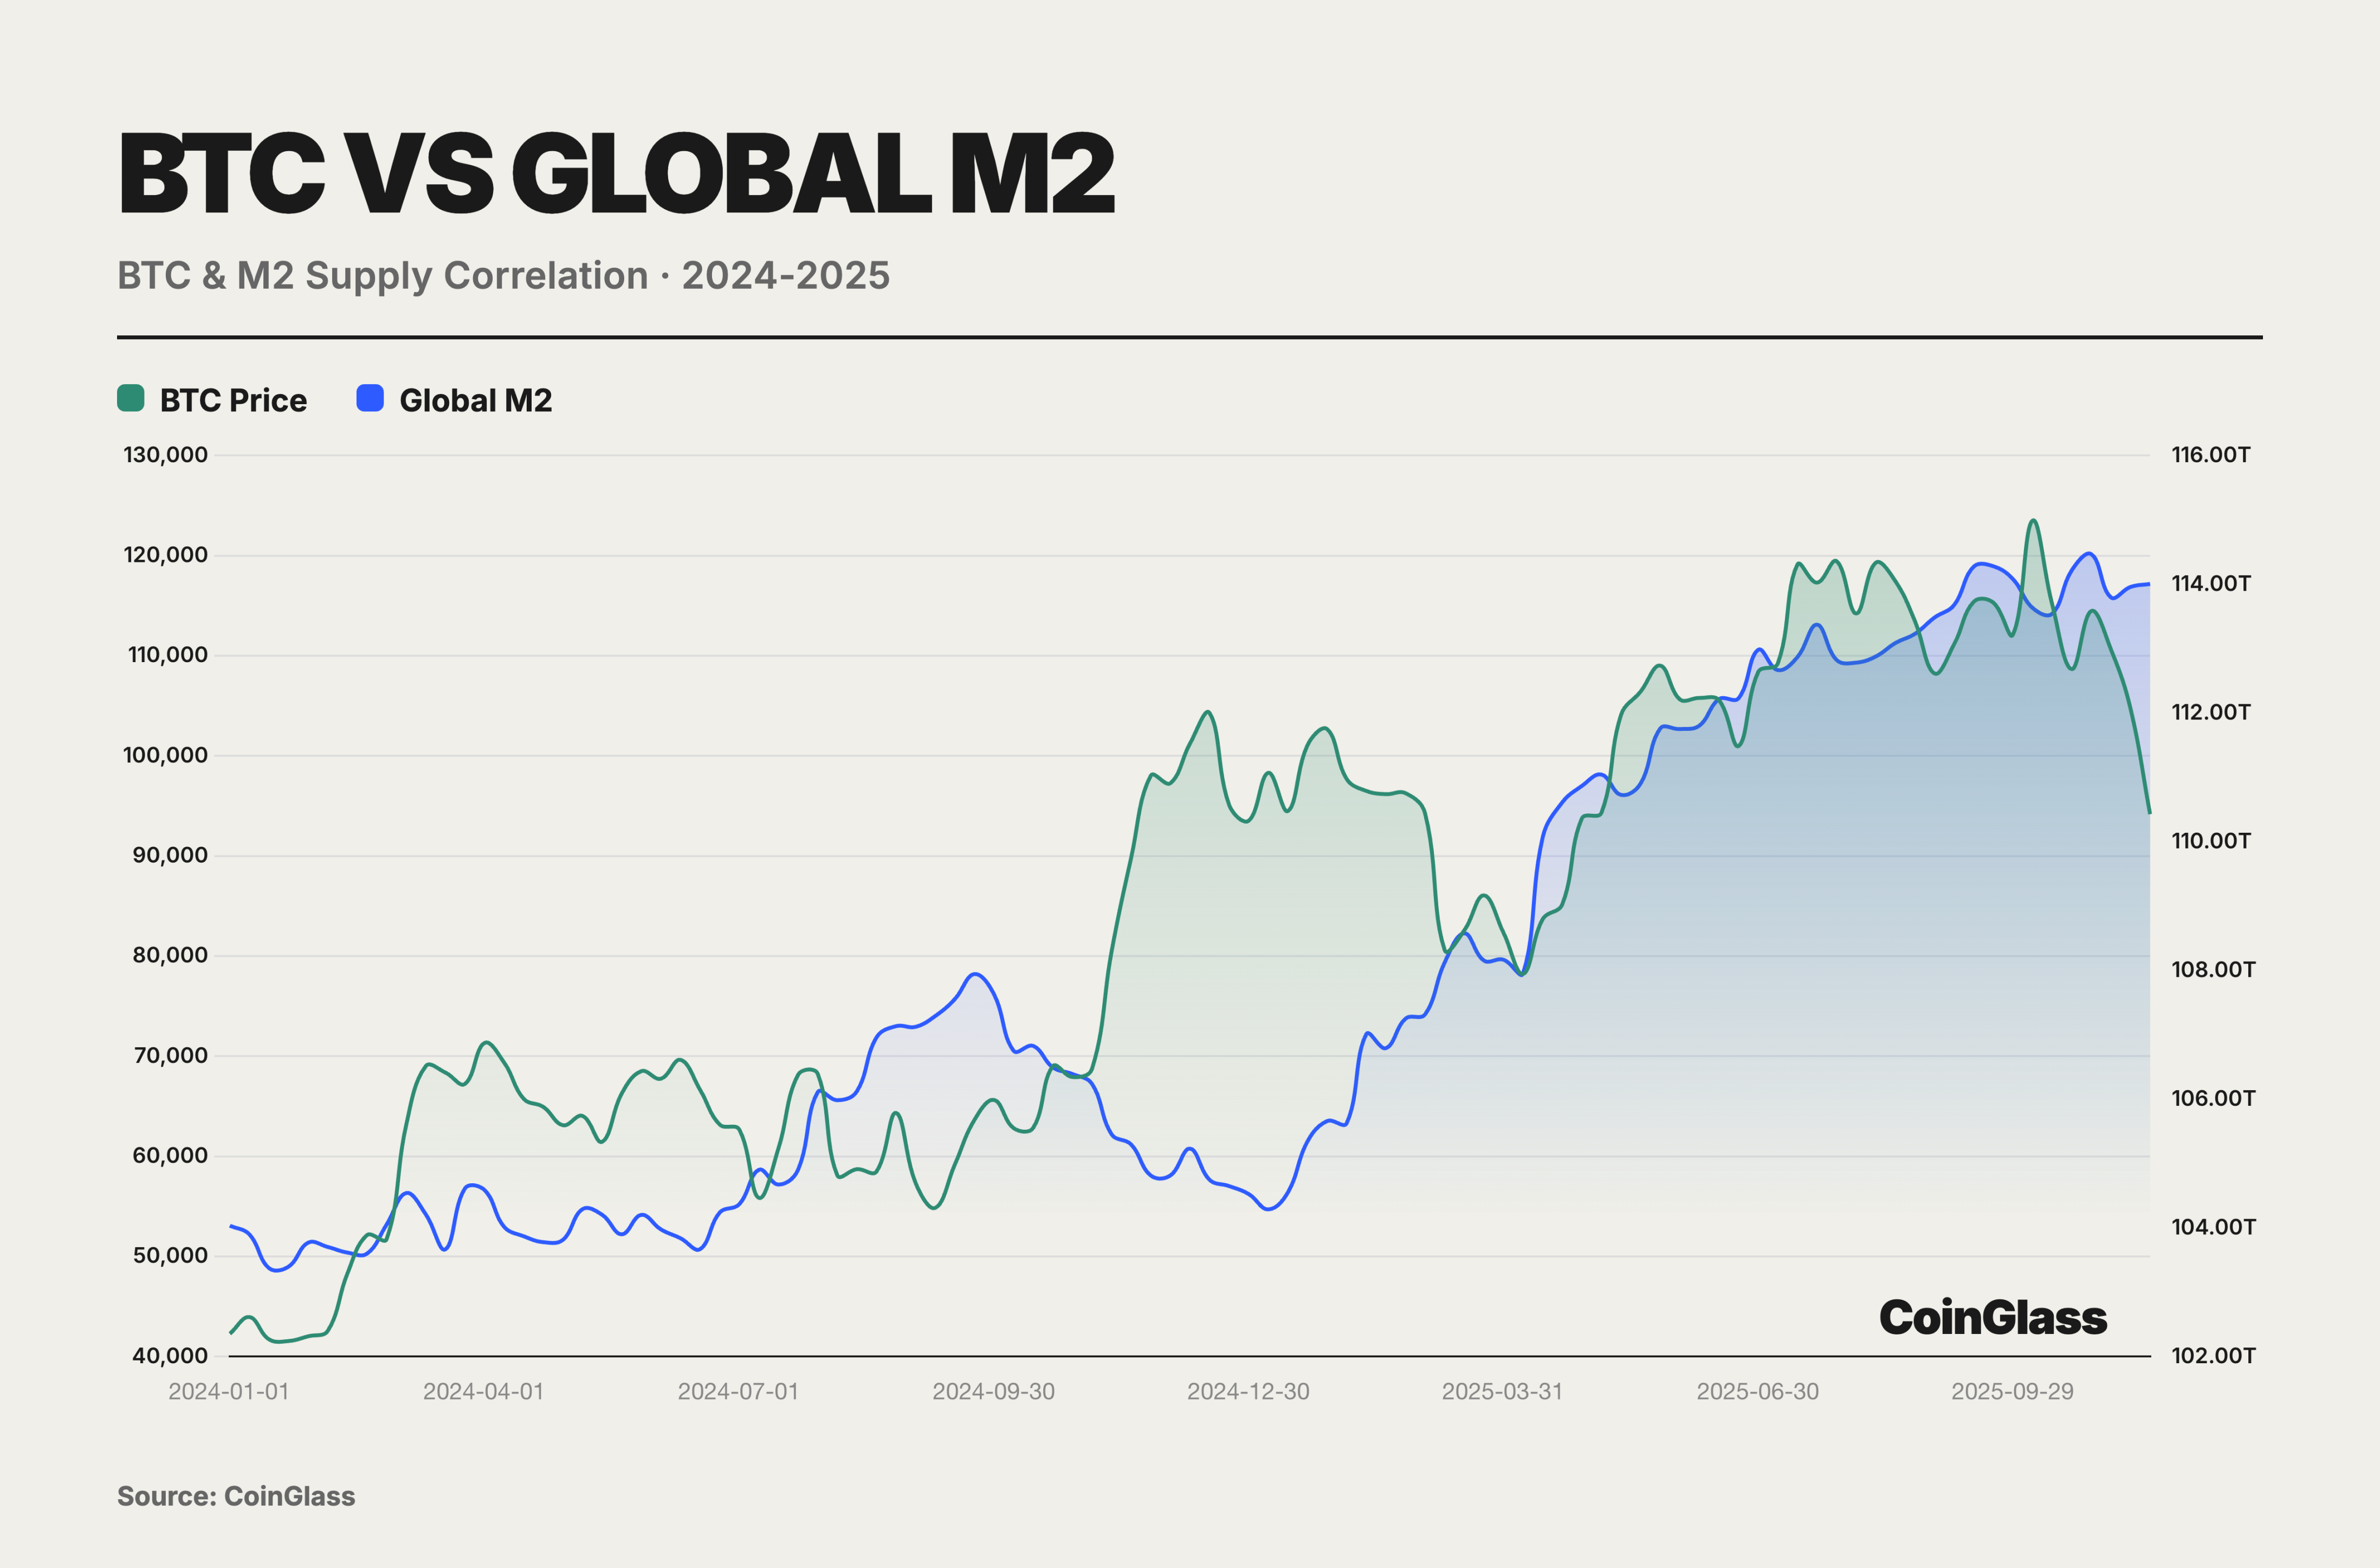
During the easing + bull market window from 2024 to 2025, BTC became more akin to a High-Beta risk asset rather than an independent inflation hedge. Its annual correlation with global M2 at 0.78 masked the structural decoupling in the second half of the year, while the decline in November validated its essence as a High-Beta risk asset. Buying BTC was not a hedge against inflation but a bet on liquidity; once liquidity tightened, BTC would be the first to be sold off. Against the backdrop of the Federal Reserve initiating a rate-cutting cycle and global central banks significantly increasing liquidity, BTC soared from $40,000 to $126,000. This excess return essentially stemmed from its Beta coefficient of 2.5-3.0, which reflects a leveraged response to liquidity expansion rather than independent value discovery.
Geopolitical and policy uncertainties became significant factors influencing the market in 2025, and the complexity of the macroeconomic environment provided an extremely rich trading narrative for the derivatives market. The renewed trade friction between the U.S. and China, the Federal Reserve's difficult balance between rate cuts and inflation, the retreat of arbitrage trading triggered by the normalization of the Bank of Japan's monetary policy, and the new U.S. government's aggressive crypto-friendly policies collectively intertwined to create a complex macro force, injecting continuous volatility and deep gaming space into the derivatives market. Overall, cryptocurrencies continued to behave more like risk assets, exhibiting extreme sensitivity to global liquidity conditions and central bank policy shifts as a category of High-Beta risk assets.
In 2025, major jurisdictions exhibited a pattern of "converging direction, diverging paths" in the regulation of crypto derivatives. Under the leadership of the new government, the U.S. shifted towards a regulatory framework centered on legislation and licensing, incorporating digital assets into the national financial strategy, and through a series of bills including the GENIUS Act, weakened the previous uncertainty stemming from "enforcement as regulation." The European Union continued to implement a robust path centered on consumer protection and leverage restrictions under existing frameworks such as MiCA and MiFID, imposing stricter entry thresholds for high-leverage retail derivatives. Significant internal differences were observed in the Asian region: Mainland China maintained a high-pressure stance on crypto trading, while Hong Kong and Singapore positioned themselves as compliance testing grounds, competing for institutional pricing and settlement business through licensing systems and product whitelists; among them, the Singapore Exchange launched BTC and ETH perpetual futures, marking the beginning of some crypto-native products being integrated into traditional financial infrastructure. The UAE, relying on a unified digital asset regulatory framework, accelerated the attraction of crypto enterprises and trading platforms, shaping itself into a regional compliance hub. Overall, the regulation of DeFi derivatives gradually converged towards the principle of "same business, same risk, same regulation," indicating a progressive alignment of compliance requirements between on-chain and off-chain markets.
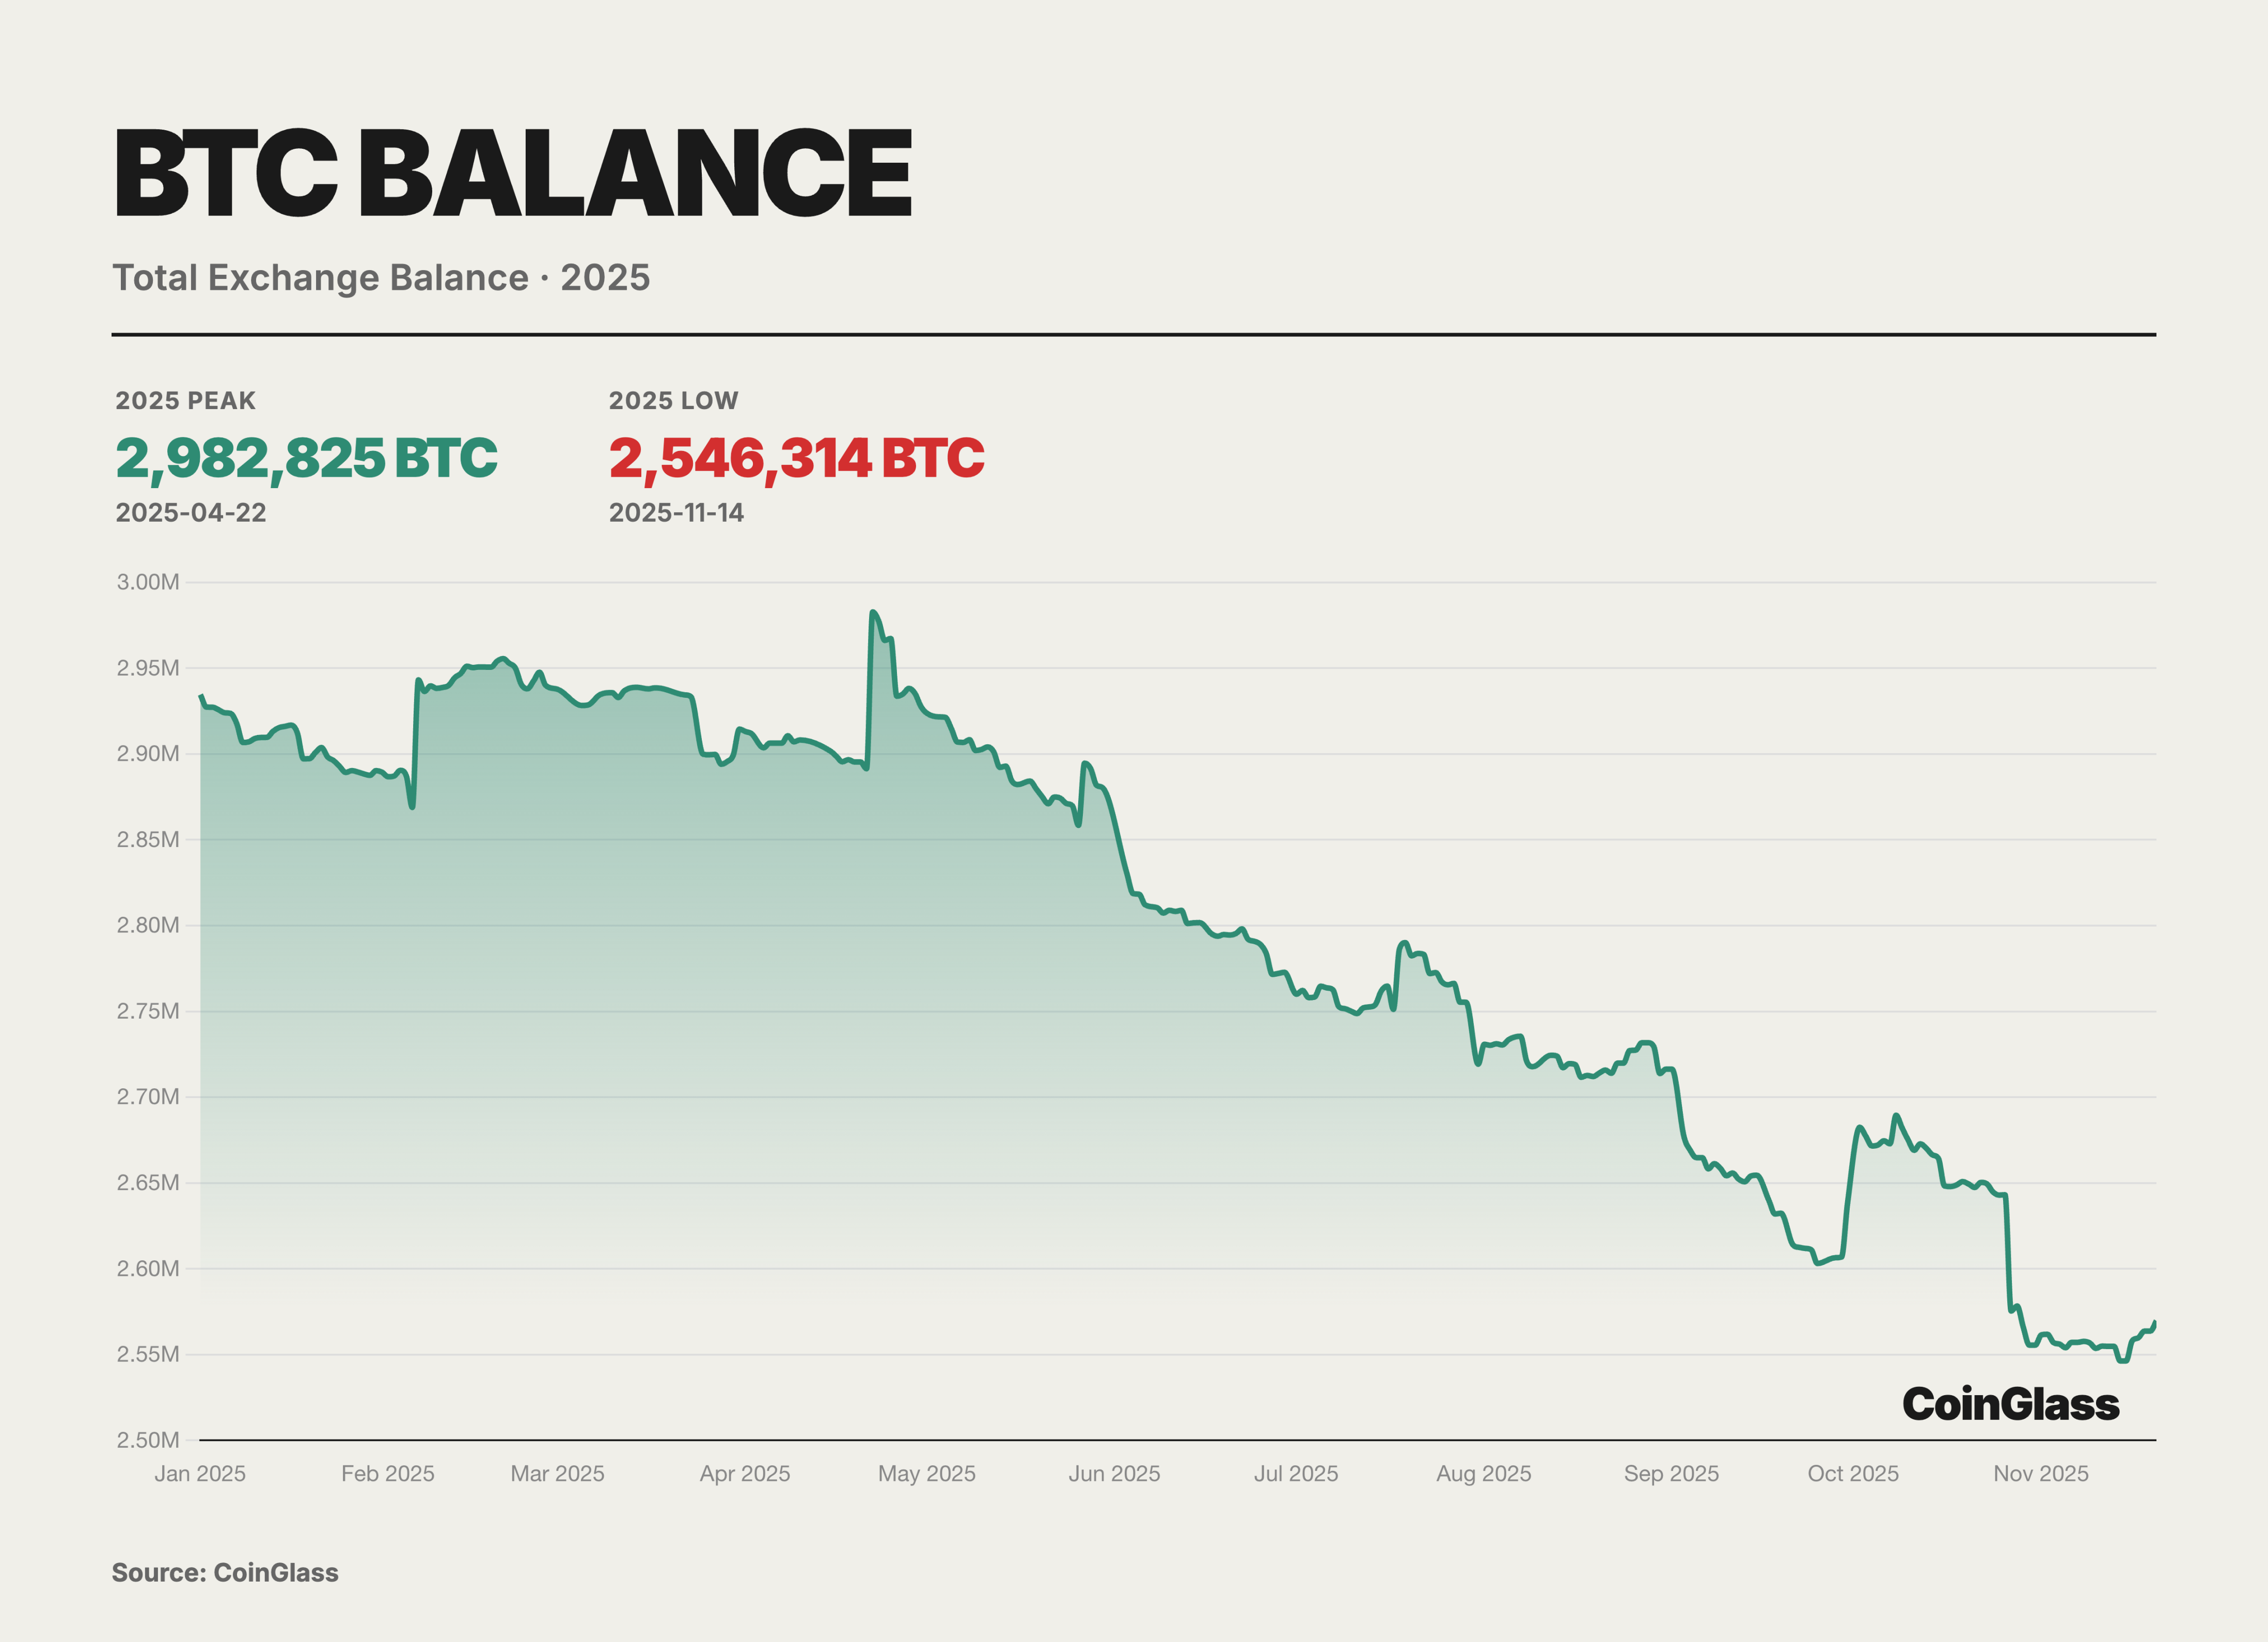
In 2025, the supply structure of BTC at the exchange level showed clear signs of rebalancing, with the overall exchange balance declining stepwise, entering a continuous destocking phase since the peak in April. CoinGlass data shows that after reaching an annual peak of approximately 2.98 million BTC around April 22, the exchange BTC reserves exhibited a stepwise decline over the following months, dropping to about 2.54 million BTC in mid-November, with a net outflow of approximately 430,000 BTC, a decrease of about 15%.
This round of destocking reflects more the migration of chips from exchanges to self-custody addresses, and the structural tilt of trading demand towards "low turnover, long holding," rather than a simple reduction in short-term selling pressure. As tradable chips continue to be withdrawn from exchanges, this helps to raise marginal transaction prices and amplify pro-cyclical gains during price uptrends; however, it also means that once macro expectations or price trends reverse, if previously withdrawn reserves from exchanges concentrate back, it may create amplified selling pressure and volatility on a thinner order book.
In 2025, the scale and application scenarios of stablecoins and DAT expanded simultaneously, beginning to directly interface with traditional finance at the boundary level. The total market capitalization of stablecoins once exceeded $230 billion, with an on-chain settlement scale of approximately $1.5 trillion for the year. Supported by legislation such as the GENIUS Act, stablecoins gradually solidified as the underlying settlement layer for cross-border payments and on-chain finance. The DAT model provided a standardized path for traditional institutional investors to gain exposure to crypto assets through compliant equity or fund vehicles, with the market value of BTC and ETH assets held peaking at over $140 billion, a year-on-year increase of more than three times. RWA acted as a key intermediary: anchoring cash flows from real-world assets on one end and connecting stablecoins and DAT's on-chain settlement and valuation systems on the other. The BCG–Ripple 2025 report predicts that the tokenized asset market will expand from the current approximately $600 billion to nearly $18.9 trillion by 2033, with a compound growth rate of about 53%, providing a scale assumption basis for this evolution.
2025 also marked a turning point for decentralized derivatives, transitioning from concept validation to actual market share competition. Mainstream on-chain derivatives protocols made substantial progress in technical architecture, product forms, and interaction experiences, beginning to form a considerable alternative to CEX's trading and listing advantages. High-performance application chain architectures, represented by Hyperliquid, validated that decentralized infrastructure could directly compete with centralized matching platforms in terms of throughput, latency, and capital efficiency in specific scenarios. The intent-centric architecture became the core paradigm for upgrading the DeFi end experience in 2025: users only need to specify the target state, and Solvers or AI agents competitively search for the optimal execution path off-chain, then submit it for on-chain settlement, significantly lowering the operational threshold for complex transactions.
In 2025, the on-chain integration of RWA became an important symbol of the crypto industry's move towards the mainstream. Its growth momentum primarily stemmed from two aspects: first, the marginal easing of the regulatory environment, as the U.S. sought to reshape its position as a crypto financial center, with U.S. Treasuries and stocks becoming core assets for tokenization; second, strong real demand—many global investors lack direct and convenient access to U.S. stock trading channels, and tokenization somewhat lowers the entry barriers posed by nationality and geography. Token Terminal data shows that the market value of stock tokens grew by 2695% in 2025.
At the same time, the brand effect of leading issuers and trading platforms gradually emerged: Ondo, xStocks, and others, with on-chain accessible traditional financial assets as entry points, became representative players in the RWA narrative; mainstream exchanges like Bitget and Bybit continued to invest resources in the listing, trading, and liquidity support of related assets. Coupled with the advantages of eliminating cumbersome account opening processes and 24/7 trading availability, stock tokens became a significantly rising focus in the market in 2025. Bitget's report indicated that during Q3 2025, its stock contract trading volume increased by 4468% quarter-on-quarter, with cumulative trading volume surpassing $10 billion.
In an environment where macro narratives and regulatory frameworks gradually clarified and uncertainties converged, more complex trading structures and gaming spaces were opened. Based on this macro and institutional background, the second part will turn to empirical profiling of centralized trading infrastructure: by quantitatively tracking the distribution of spot and derivatives trading volumes, market share changes of mainstream CEX, and the capital flows of BTC spot ETFs, it will depict the funding allocation paths of various participants in 2025, the structural share rearrangement among trading platforms, and the reshaping of overall market liquidity and price discovery mechanisms by institutional capital.
Centralized Derivatives Exchanges
CEX Derivatives Trading Volume
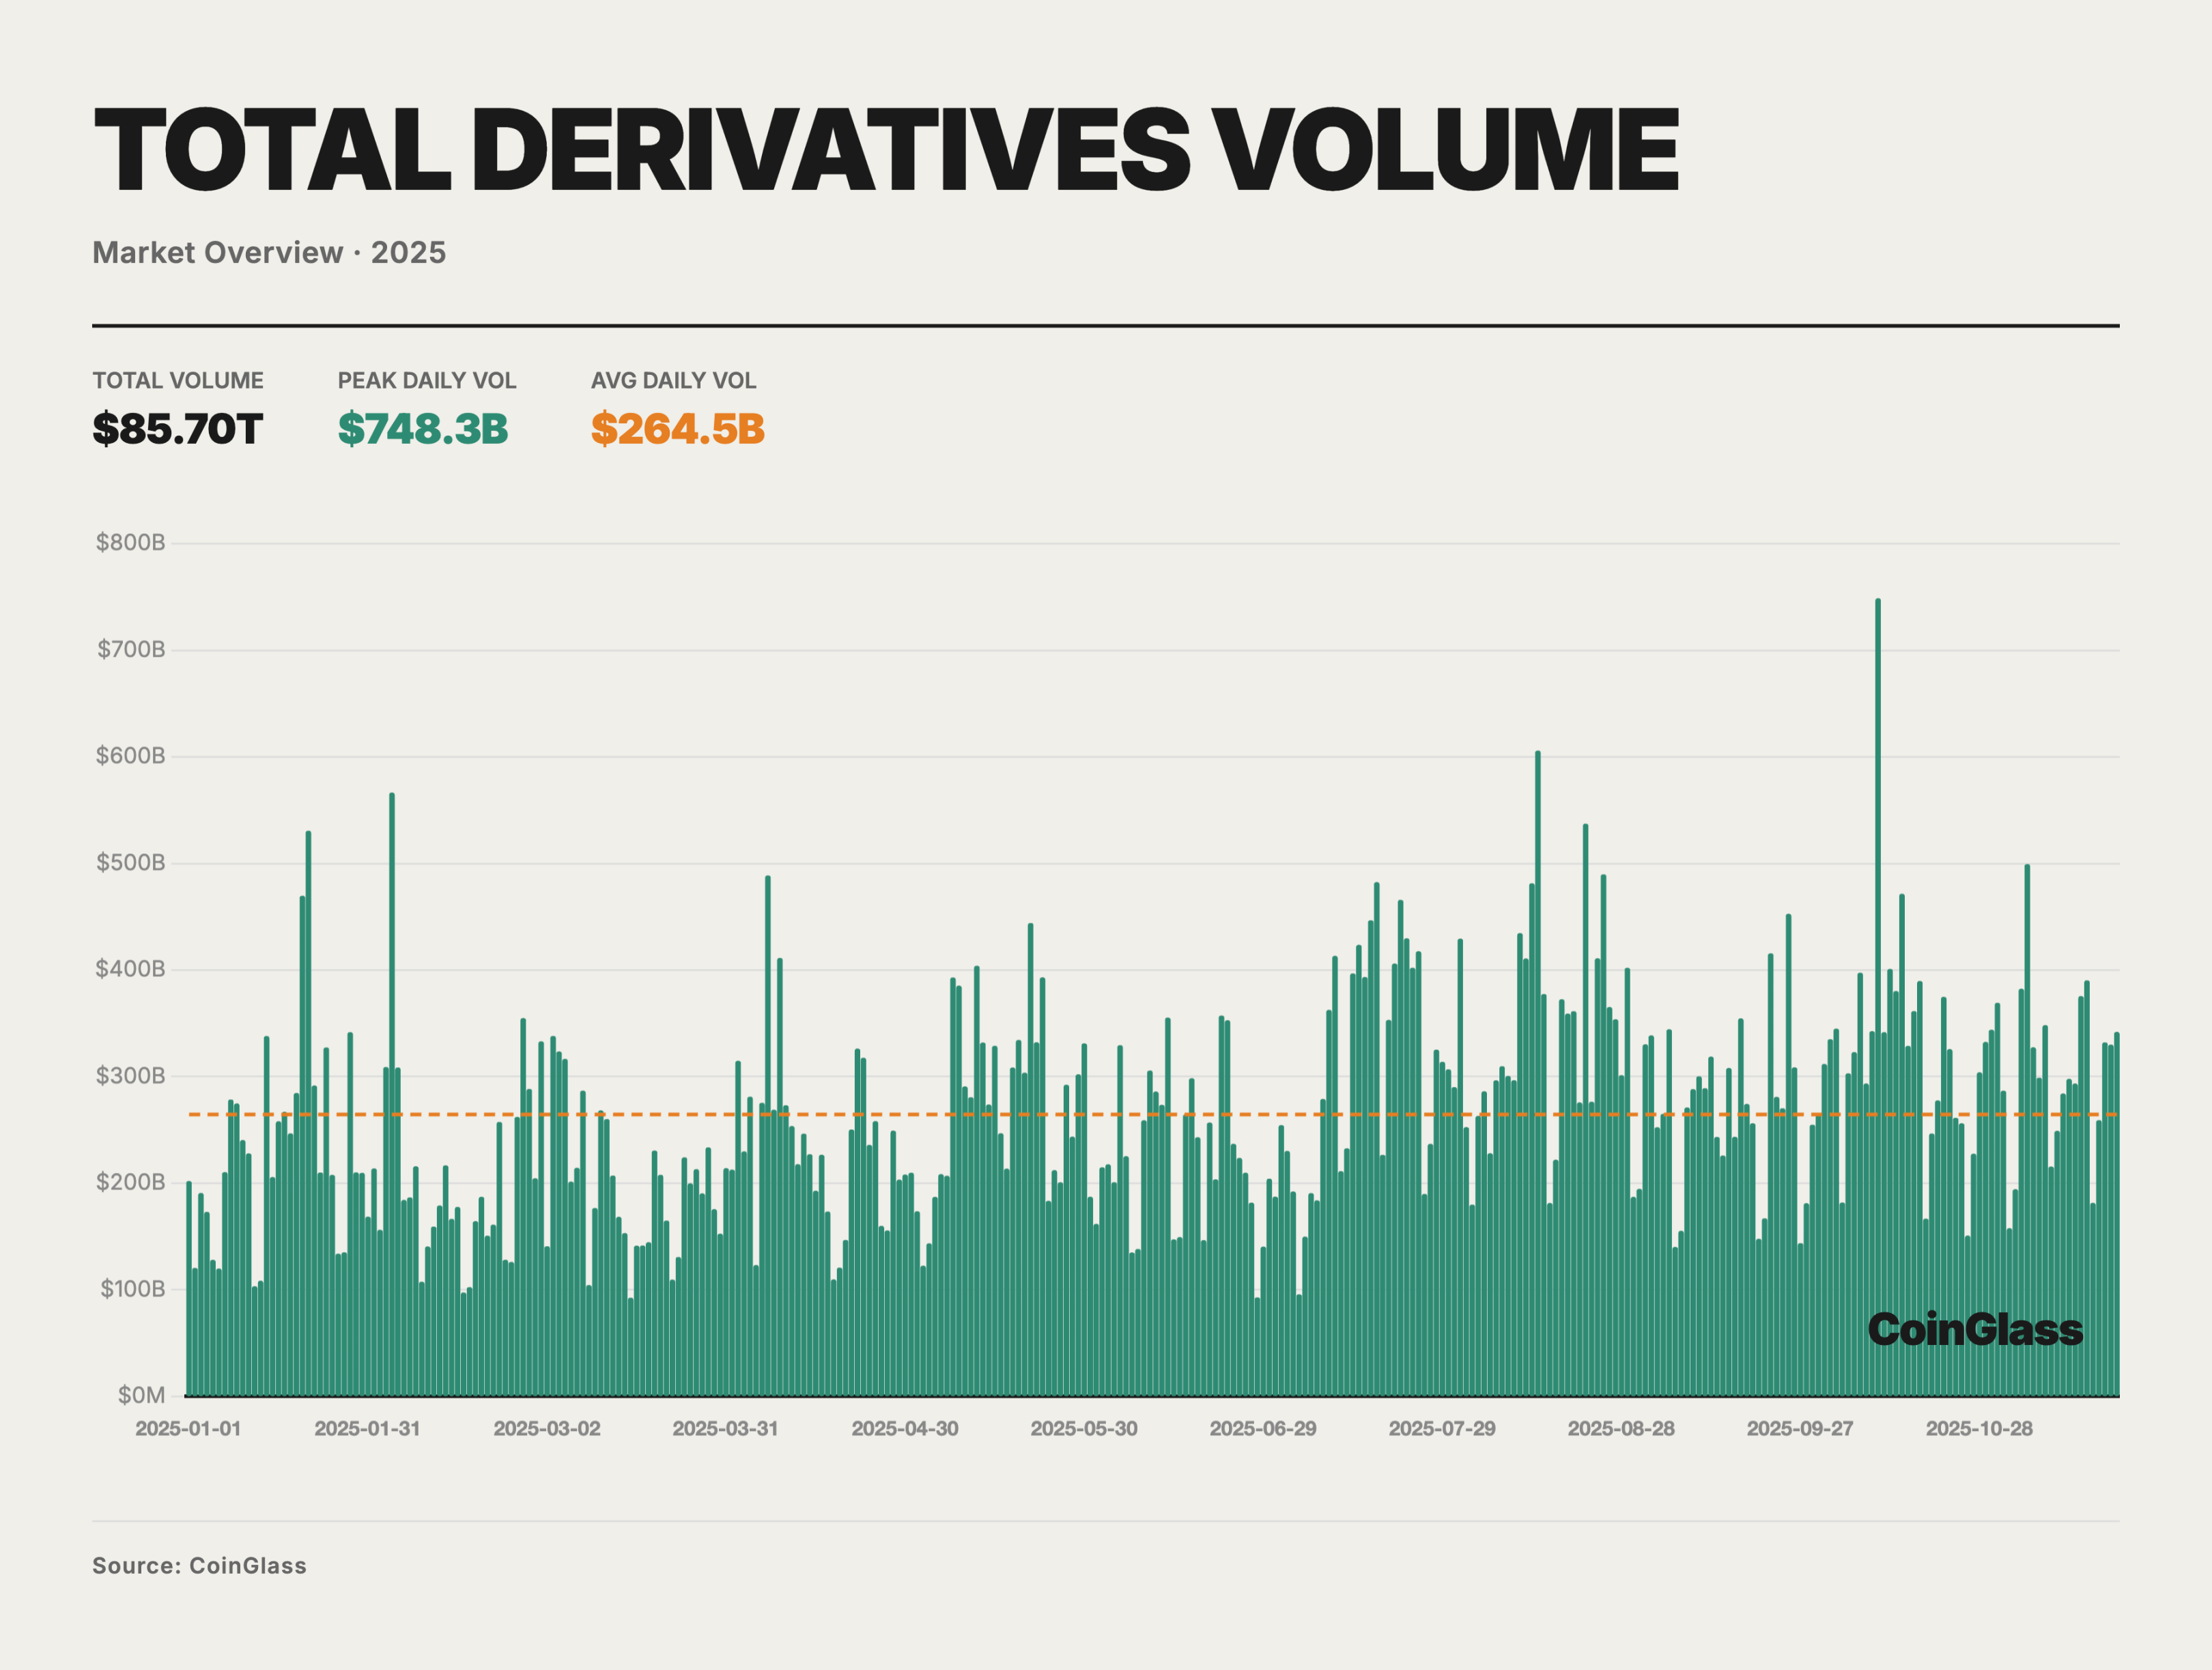
In 2025, the total trading volume of the cryptocurrency derivatives market was approximately $85.70 trillion, with an average daily trading volume of about $264.5 billion. Against the backdrop of a still tight macro liquidity environment and a phase of repairing risk appetite, the overall trading activity for the year exhibited a structure of "initially low, then high, with oscillating increases." Currently, derivatives have become the primary venue for price formation and risk management for the vast majority of mainstream assets. The orange dashed line in the chart indicates repeated days of increased trading volume above the average, with a peak of approximately $748 billion on October 10, significantly higher than the normal levels for the year, reflecting that during the acceleration phase, derivatives have become the core battleground for price discovery and leveraged speculation. On a monthly basis, the average daily trading volume in the first quarter was mostly around $200 billion, gradually increasing from the second quarter, with daily averages in July-August and October rising to over $300 billion.
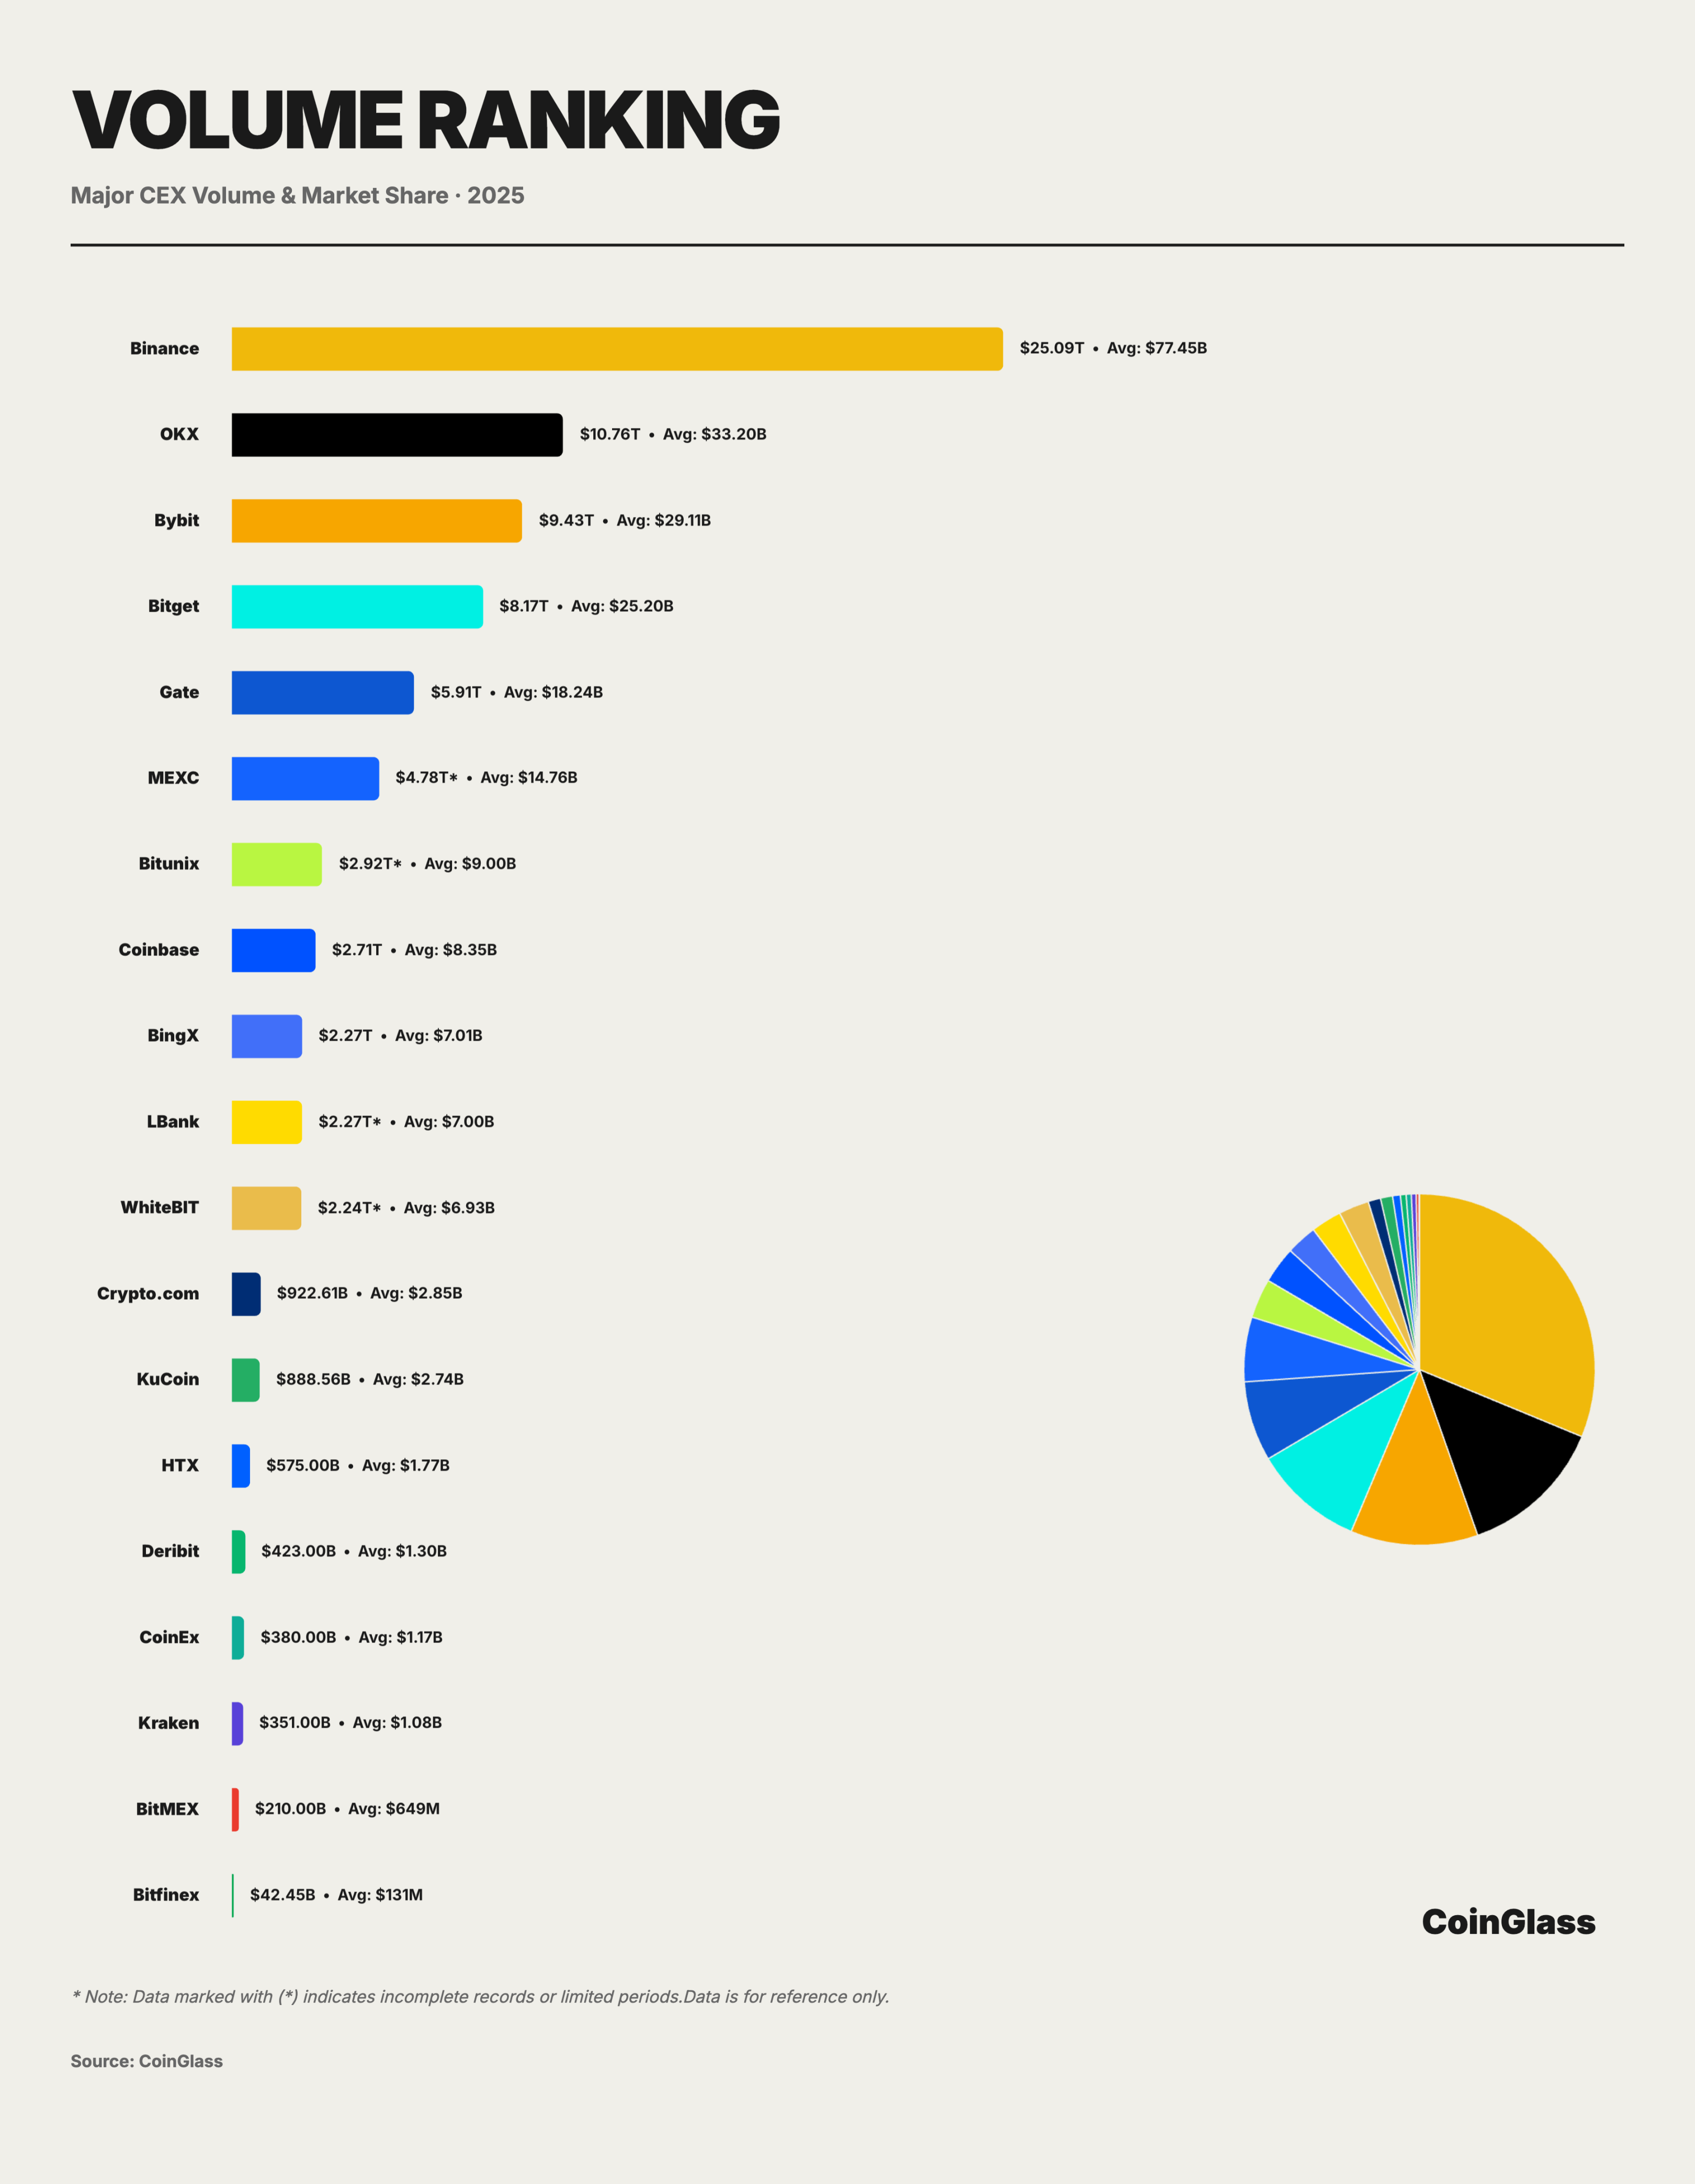
Behind the total trading volume of $85.70 trillion and the daily average of $264.5 billion, the distribution of market share shows a highly concentrated characteristic. Binance firmly occupies the market leadership position with a cumulative trading volume of $25.09 trillion and a daily average of $77.45 billion, holding approximately 29.3% of the market share. This means that for every $100 in trading volume in the global derivatives market, about $30 occurs on Binance.
The competitive landscape of the second tier shows clear differentiation. OKX, Bybit, and Bitget follow closely, with cumulative trading volumes ranging from approximately $8.2 trillion to $10.8 trillion, and daily averages between $25 billion and $33 billion, collectively accounting for about 62.3% of the market share along with Binance. OKX ranks second with a total of $10.76 trillion and a daily average of $33.20 billion, holding about 12.5% of the market share. Bybit follows closely with a cumulative trading volume of $9.43 trillion and a daily average of $29.11 billion, representing about 11% market share. Bitget ranks fourth with a total of $8.17 trillion and a daily average of $25.20 billion, holding about 9.5% market share.
Gate.io ranks fifth with $5.91 trillion and a daily average of $18.24 billion, with its market share dropping to about 6.9%. Although Gate, as an established exchange, still maintains a certain volume, the gap between it and the top three is widening. More notably, there is a gap phenomenon after Gate: BingX's $2.27 trillion is less than 40% of Gate's, while Crypto.com and KuCoin have fallen to the billion-dollar level ($922.61 billion and $888.56 billion), accounting for only 3-4% of Binance. Platforms like Crypto.com and KuCoin, which are in the long tail, have a market share of about 1%, serving more regional or segmented customer functions, with significantly weaker bargaining power and liquidity stickiness compared to the leaders. In terms of year-on-year and quarter-on-quarter growth rates of trading volume, Bitunix is in the leading range for both indicators, with the steepest growth slope, making it one of the fastest-growing platforms in terms of trading volume.
This cliff-like distribution reveals the Matthew effect of platform economics, where leading platforms form a self-reinforcing cycle due to liquidity advantages. For small and medium platforms, it is necessary to establish differentiated positioning in niche markets; otherwise, they will face continuous pressure of market share loss.
CEX Derivatives Open Interest
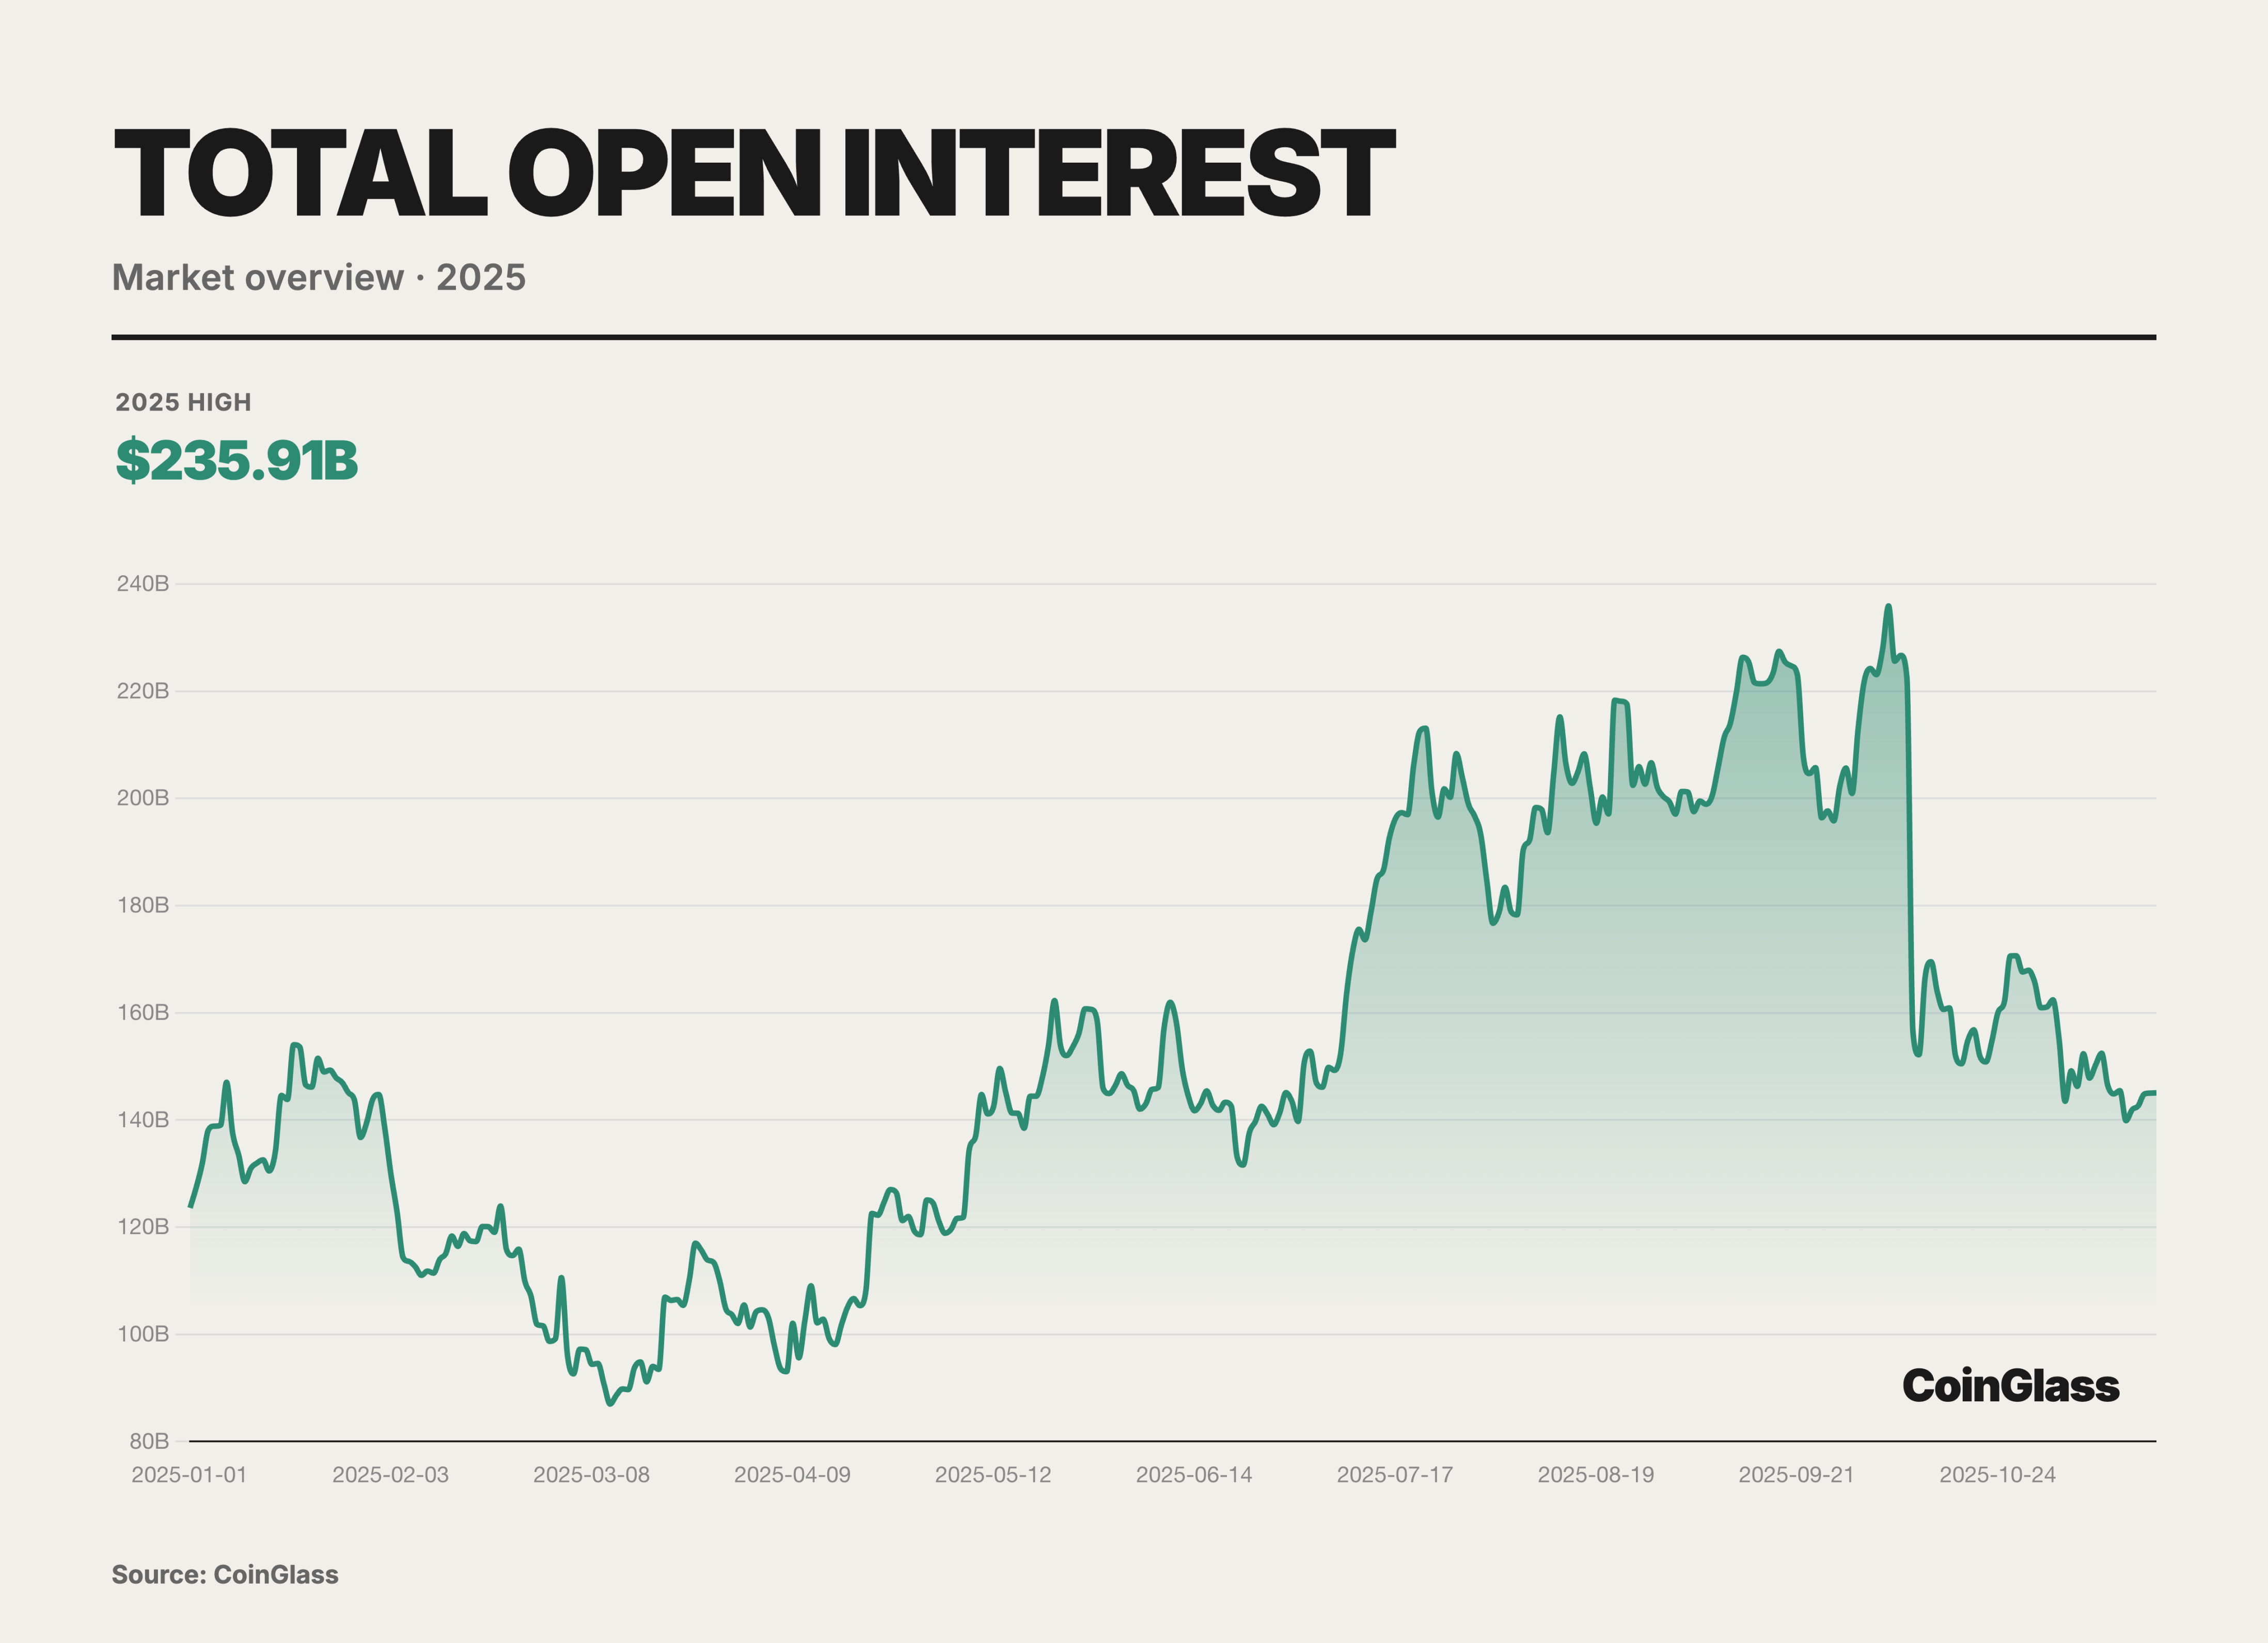
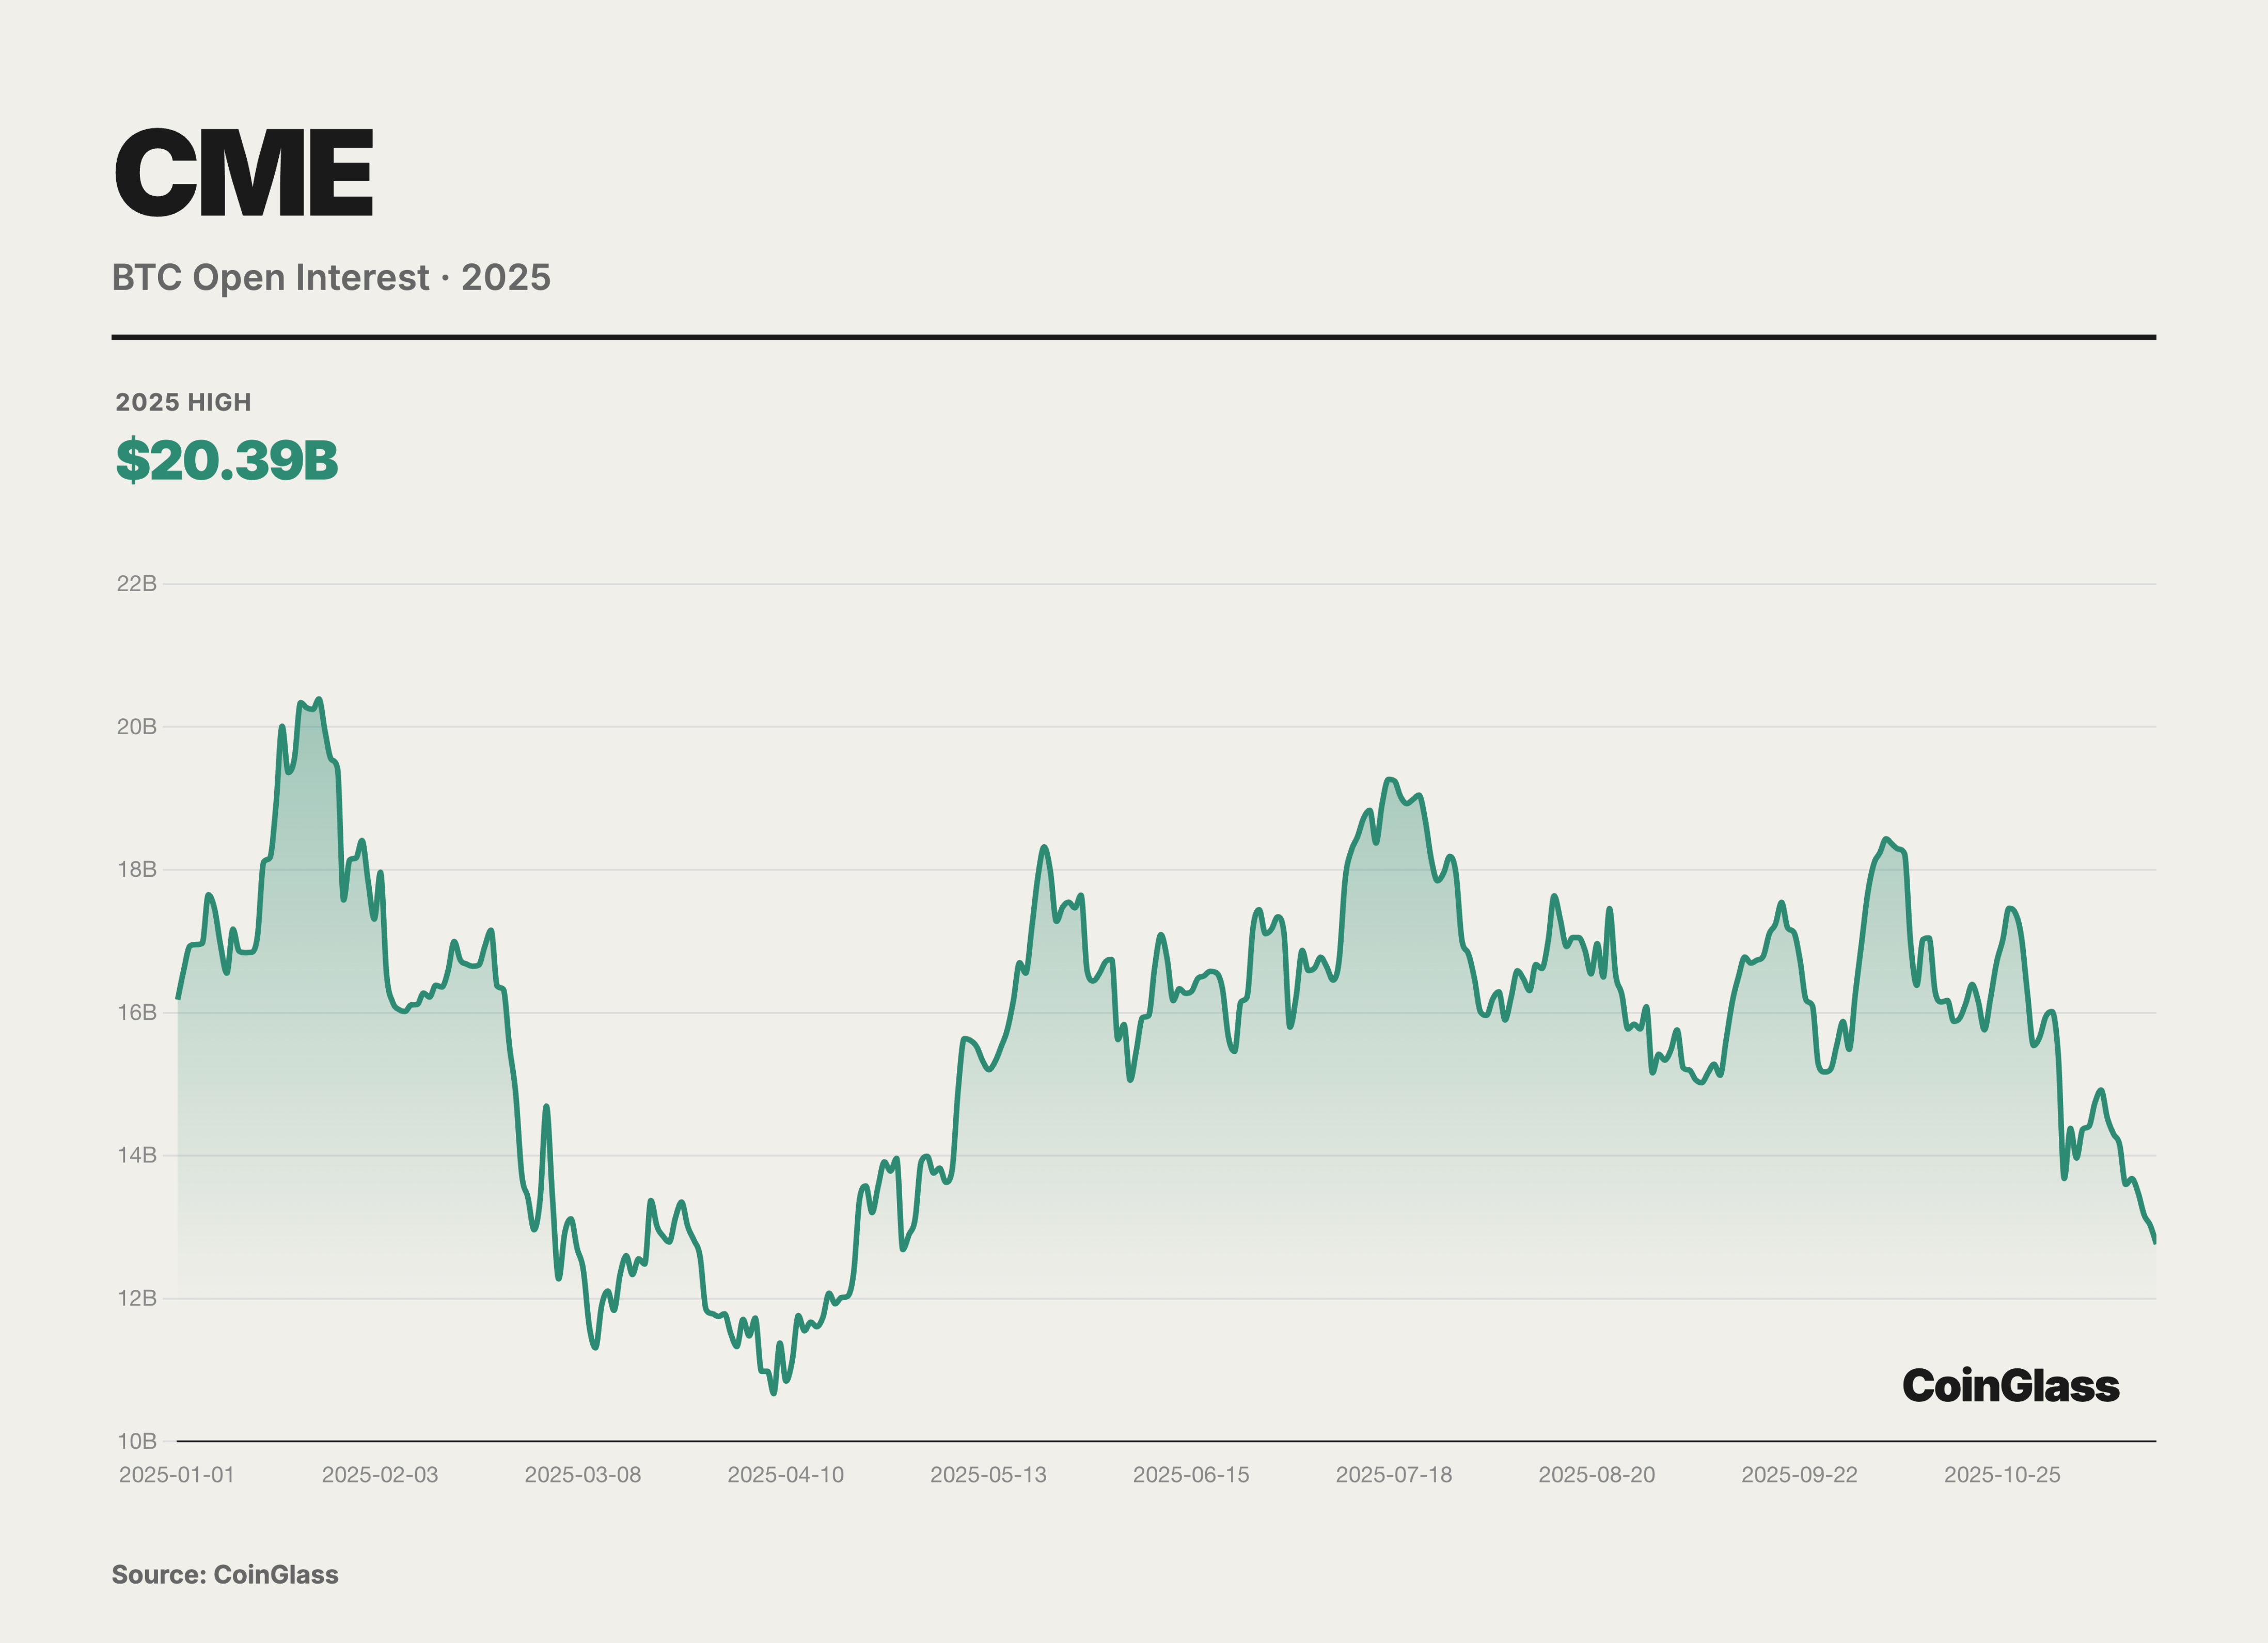
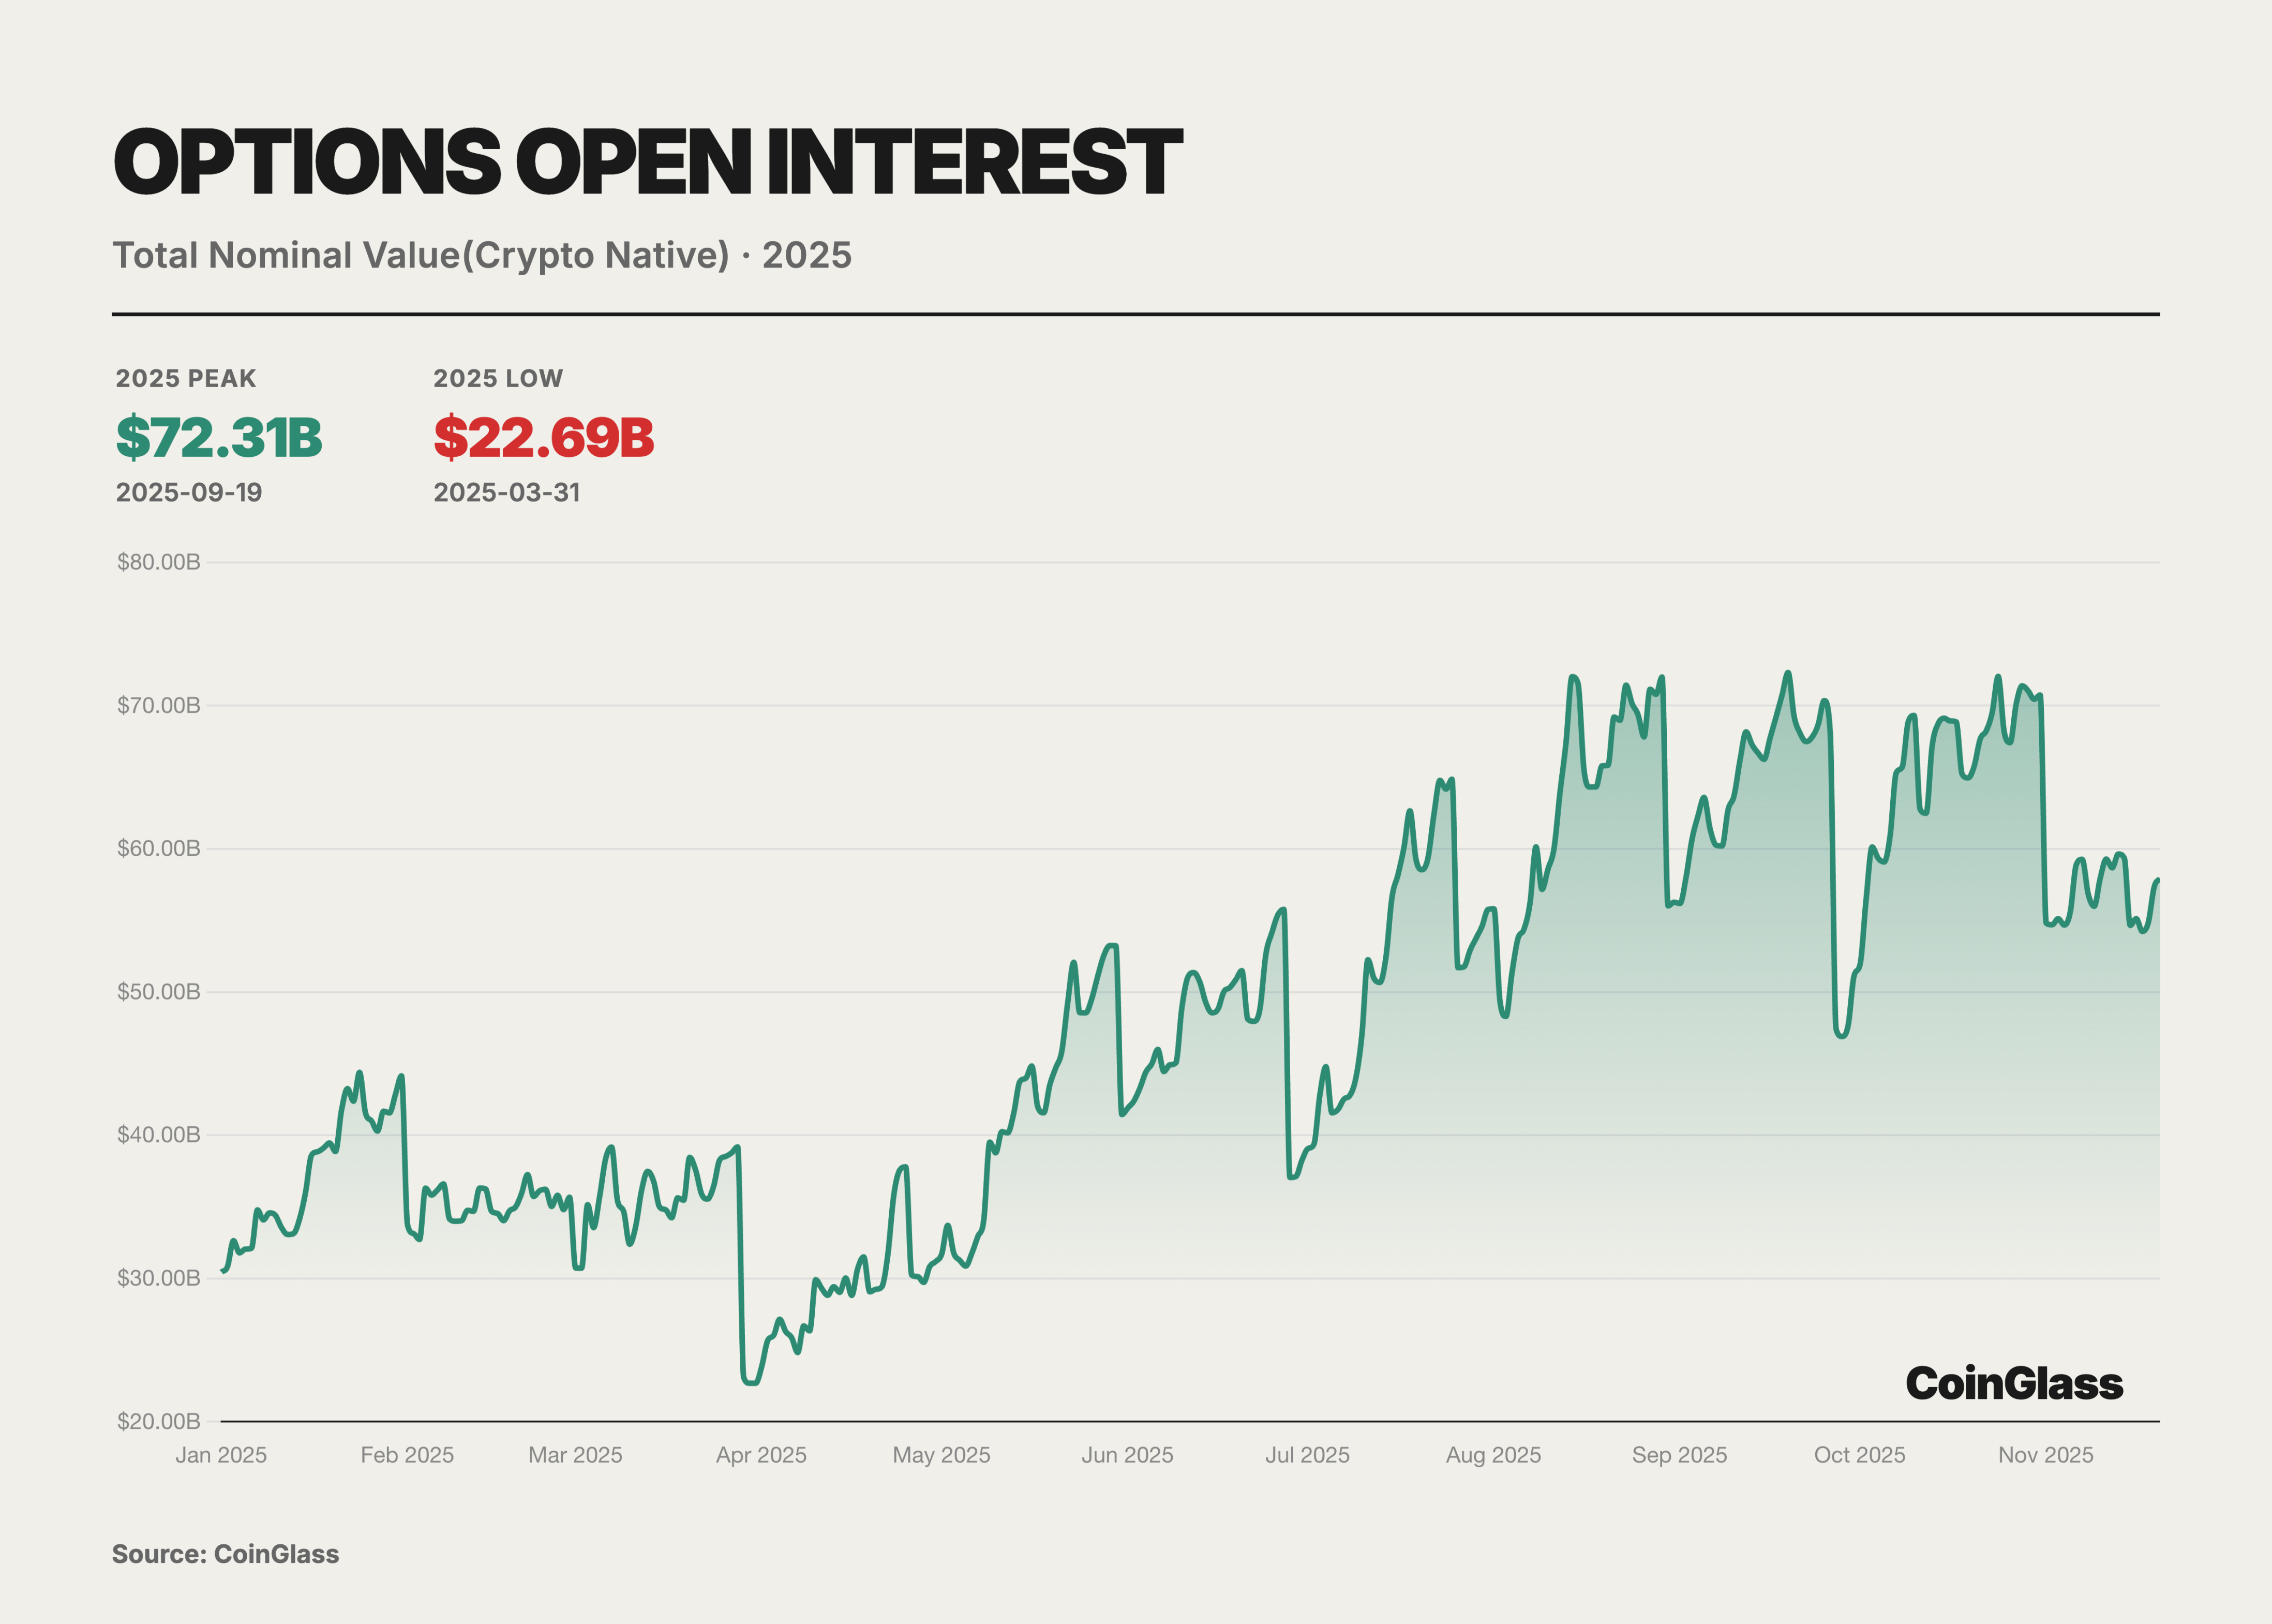
In 2025, global cryptocurrency derivatives open interest (OI) experienced a dramatic oscillation path characterized by an initial suppression followed by a rise and then a sharp drop. After experiencing deep deleveraging in Q1, OI once dipped to an annual low of $87 billion due to panic, but then demonstrated strong resilience in Q2, completing a confidence rebuild from hesitant probing to moderate accumulation. This recovery trend evolved into an almost frenzied accumulation of leverage in Q3, with accelerated capital inflows pushing OI to a historical peak of $235.9 billion on October 7. The highly crowded trading structure significantly increased the probability and intensity of market corrections, with a lightning-fast deleveraging in early Q4 wiping out over $70 billion in open interest in just one day, accounting for one-third of the total open interest. Nevertheless, the OI fell back to $145.1 billion, still representing a 17% increase from the beginning of the year, and the overall capital accumulation in the second half of the year was significantly higher than in the first half.

Based on the daily open interest data of major CEX in 2025, the global derivatives market has solidified into a clearly tiered oligopoly structure. The top ten centralized exchanges collectively hold about $108.3 billion in open interest, with Binance accounting for approximately $30 billion in daily average OI, representing about 28%. Bybit, Gate, and Bitget have daily averages of approximately $19 billion, $15.6 billion, and $15.3 billion, respectively, collectively controlling about 73% of the total tradable leveraged positions in the market. Adding OKX, the top five platforms' OI share exceeds 80%, indicating extremely high concentration among the leaders. Binance, with approximately $30 billion in daily open interest, establishes a tiered leading advantage, with its volume nearly equal to the sum of the second and third places, playing a decisive role as the cornerstone of market liquidity. Following closely is the second tier composed of Bybit, Gate, and Bitget, with each maintaining daily open interest in the high range of $15 billion to $19 billion, collectively controlling half of the market; among them, the daily average difference between Gate and Bitget is only about $300 million, indicating a high degree of competition in market share.
OKX's open interest data is relatively low, partly because OKX offers users a product structure with higher capital utilization, allowing funds to rotate quickly between different trading pairs and products, distributed across non-trading modules such as spot, wealth management, and staking, thus the open interest indicator cannot fully reflect the actual scale of deposited funds. Additionally, there may be some divergence between trading volume and open interest on certain platforms, so investors should pay more attention to trading structure and capital distribution rather than relying solely on open interest indicators.
CEX Liquidity Depth
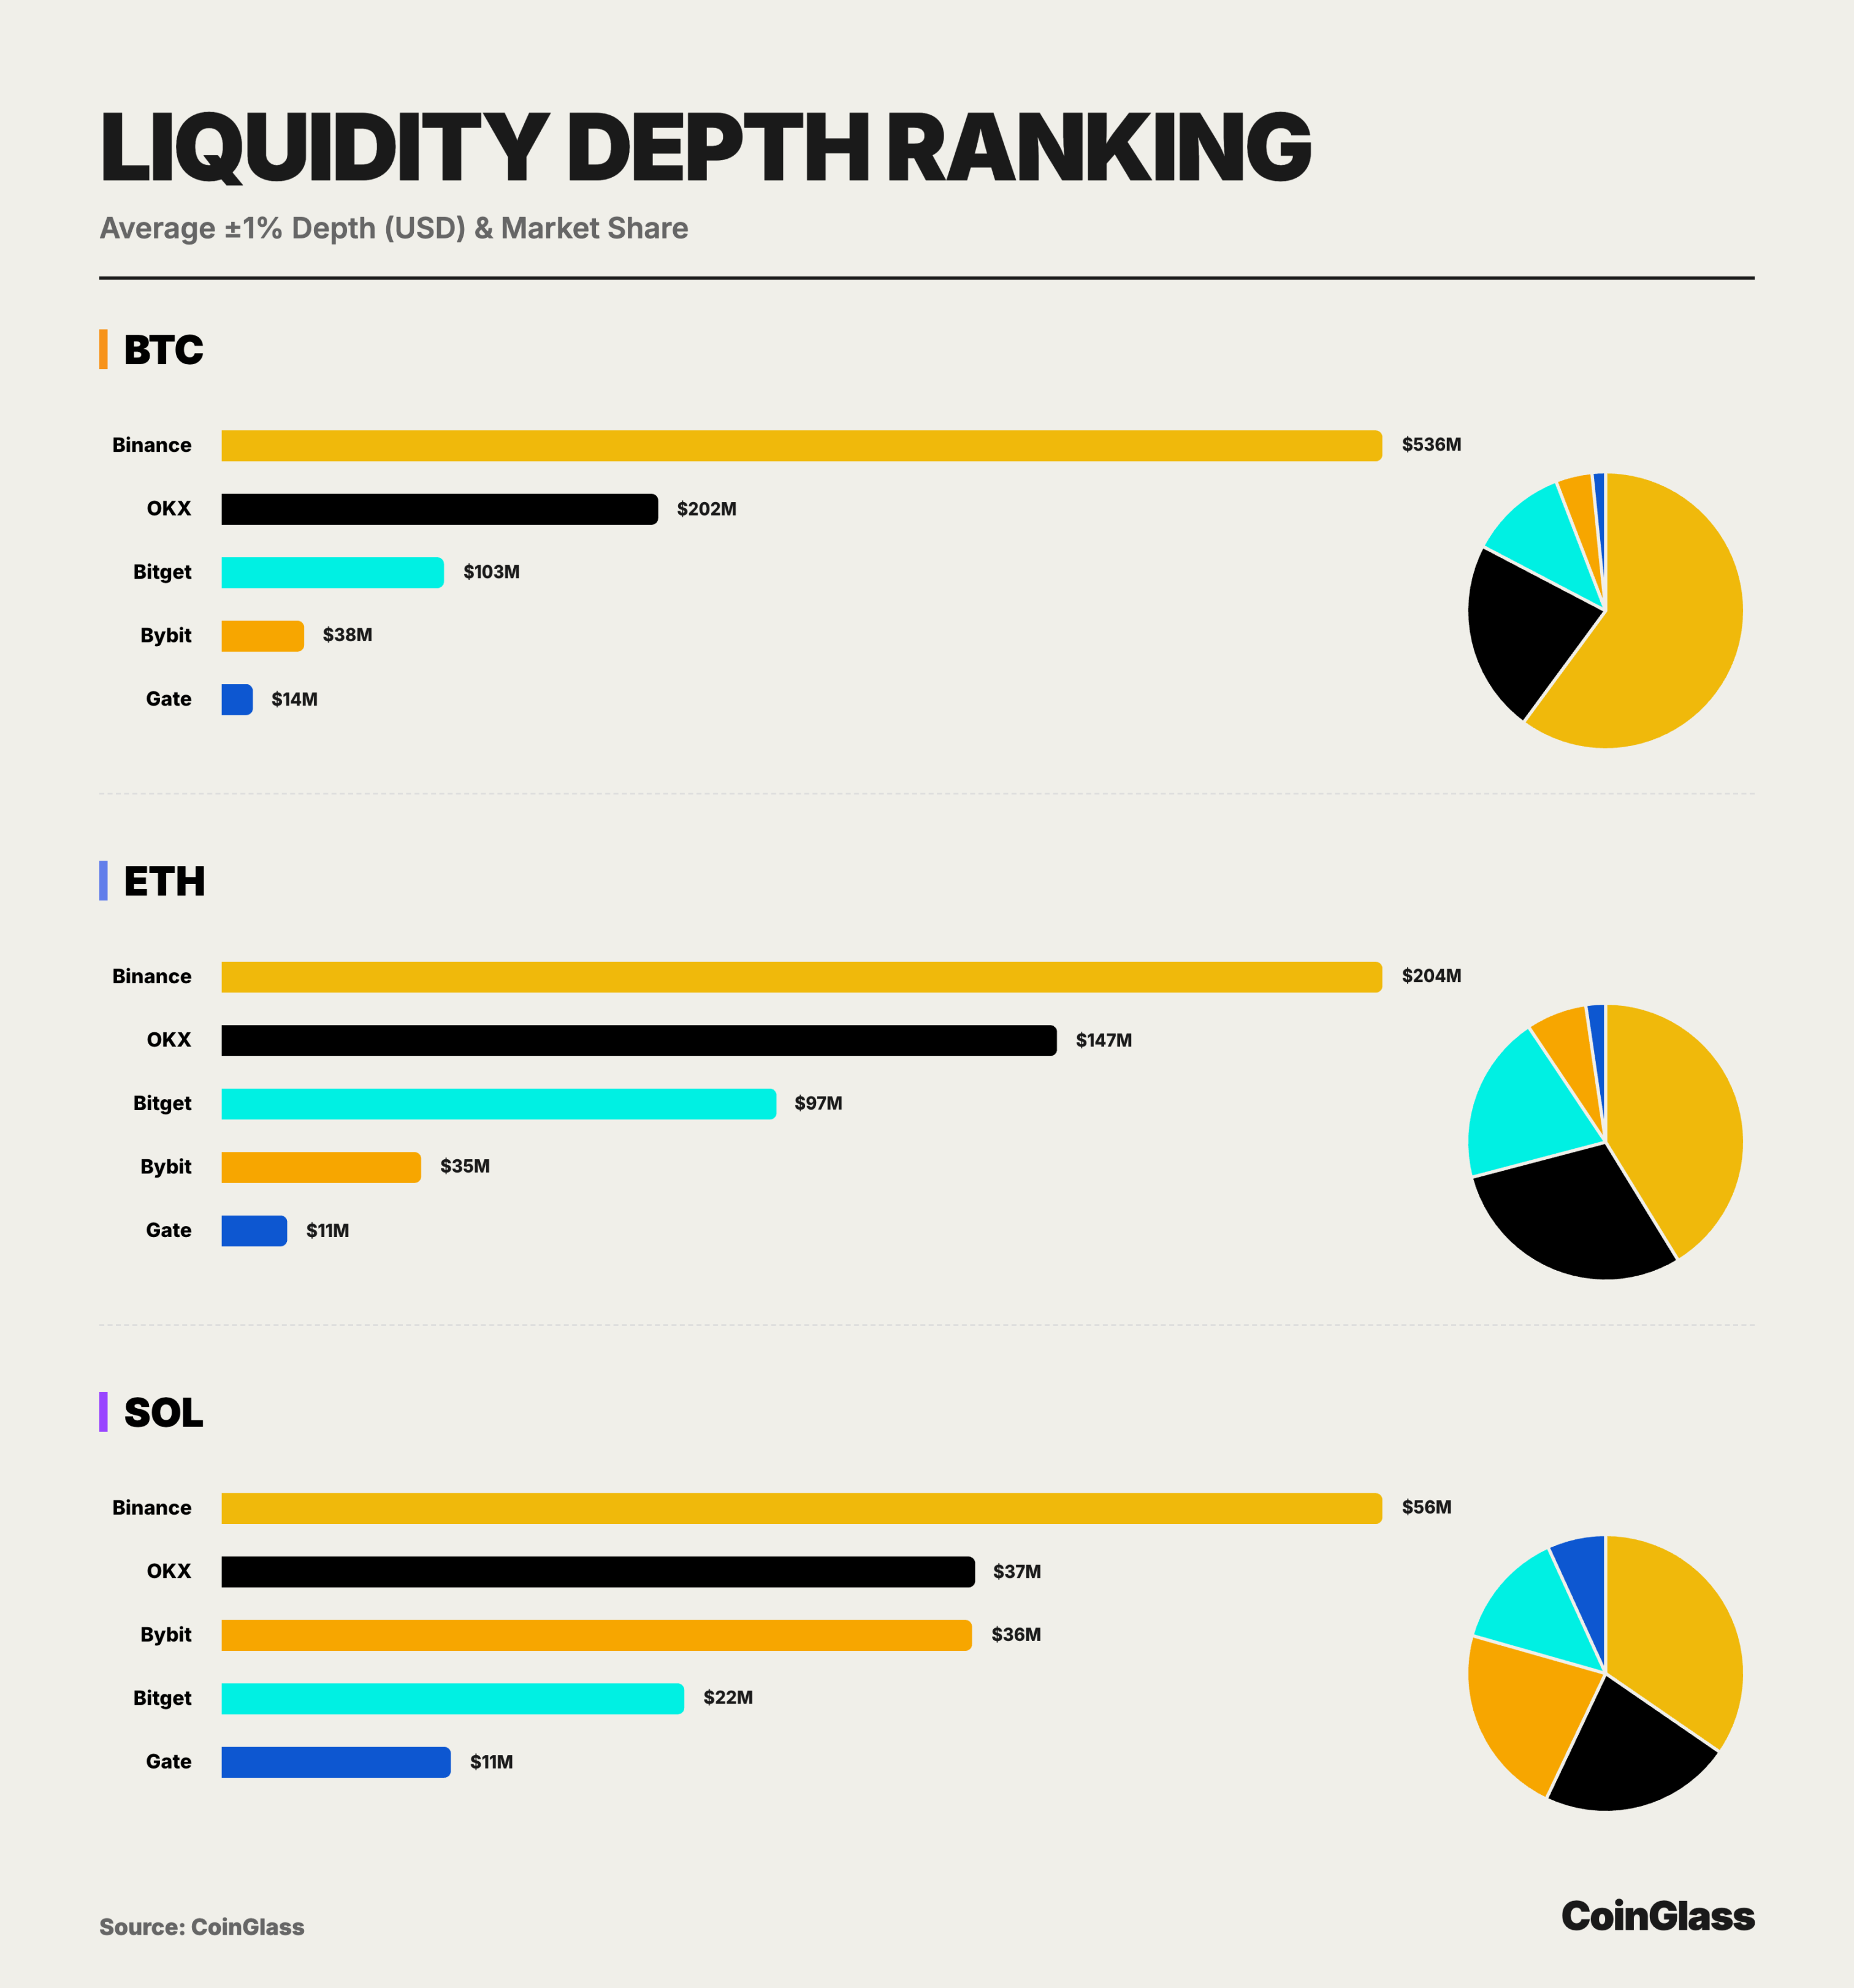
Based on the bilateral liquidity depth data of major assets (BTC/ETH/SOL) in 2025, the market presents a structure that is starkly different from that of open interest. Binance undoubtedly leads with a tiered advantage, with a BTC depth of $536 million, which is 2.6 times that of the second place and nearly equal to the total of the other four platforms, establishing its absolute position as the liquidity hub for global cryptocurrency derivatives. OKX, with a BTC depth of $202 million and an ETH depth of $147 million, demonstrates its hard power in accommodating large trades, proving that it remains the preferred choice for institutions and whales after Binance.
For BTC, Bitget ranks third with a bilateral depth of approximately $103 million, about 2.7 times that of Bybit and 7 times that of Gate, contributing nearly 11.5% to the overall market BTC depth. For ETH, Bitget's ±1% depth is approximately $97.48 million, nearing 70% of OKX's, significantly higher than Bybit and Gate, contributing nearly 20% to the overall market ETH depth, thus forming a liquidity distribution where Binance is absolutely leading, OKX firmly in second place, and Bitget steadily occupying the core of the second tier. Even in the relatively weak liquidity of SOL, Bitget still provides over $22.42 million in ±1% depth, about 60% of OKX and Bybit, accounting for approximately 14% of the overall market SOL depth, indicating its considerable order absorption capacity in high-volatility, relatively long-tail mainstream assets.
CEX User Asset Accumulation
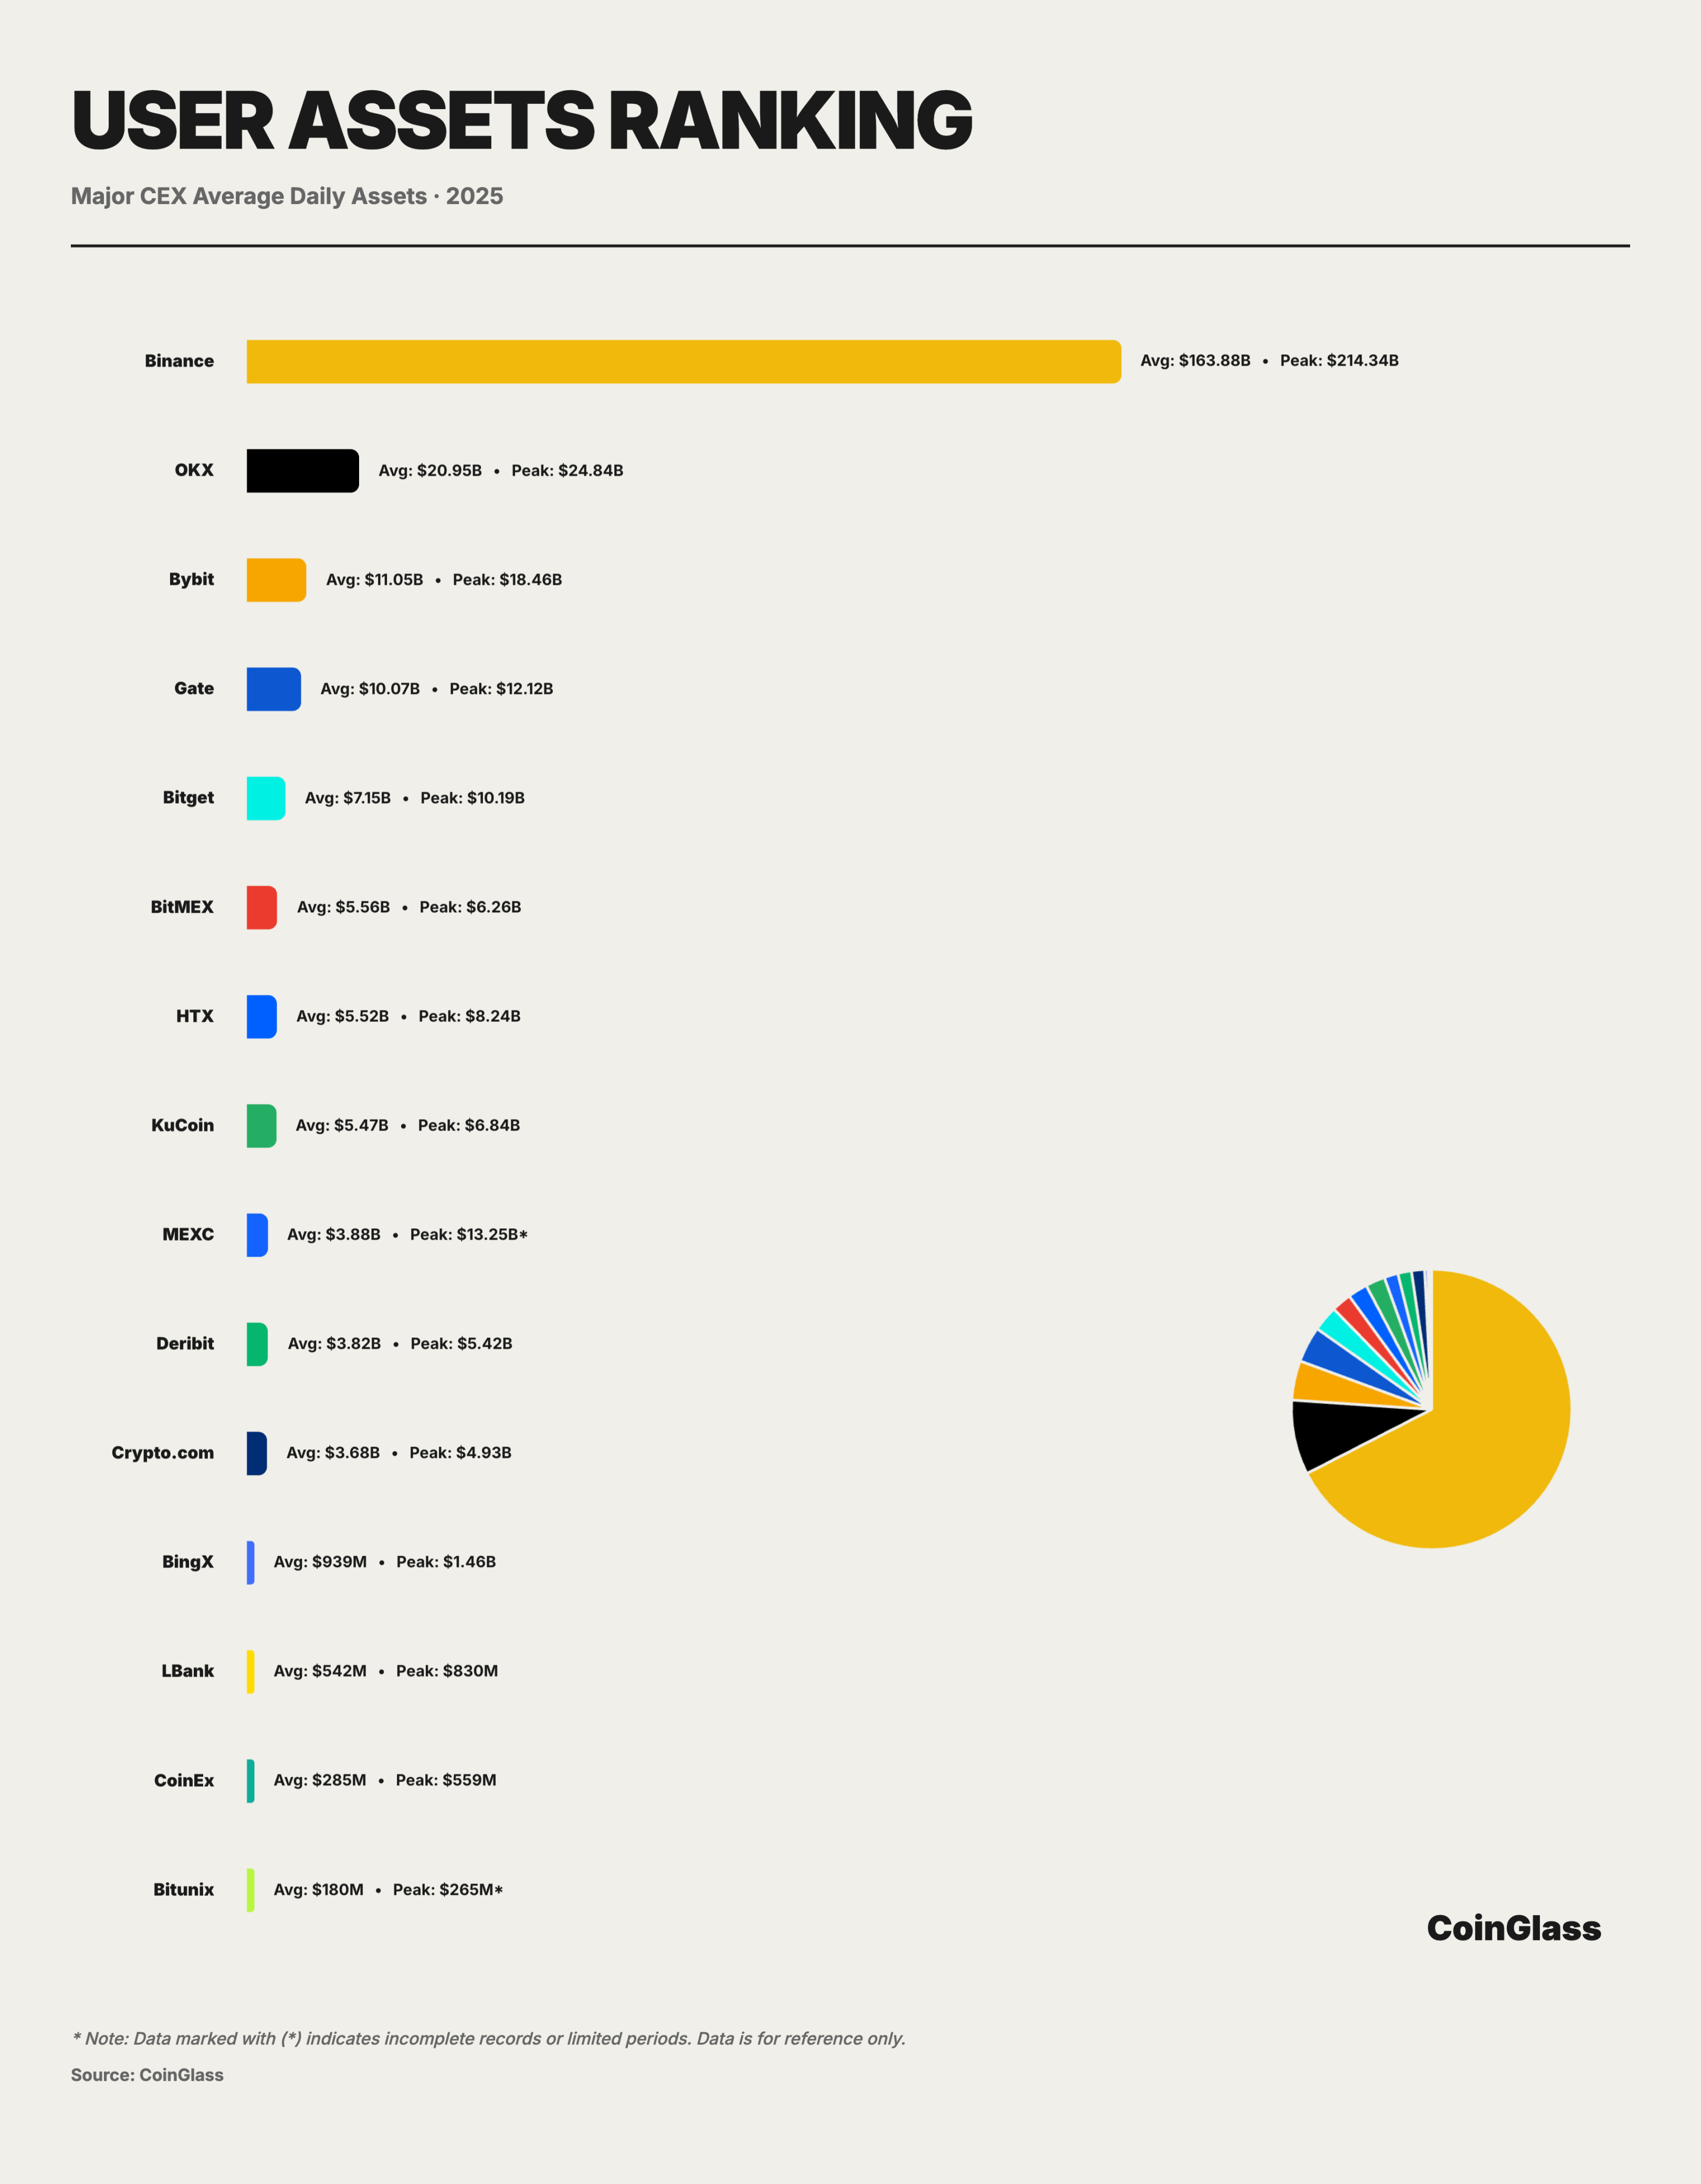
Based on the user asset accumulation data for 2025, the cryptocurrency market presents a highly concentrated unipolar structure at the level of fund custody. Based on the Herfindahl-Hirschman Index calculation, the concentration of CEX custodial assets in 2025 is 5352, indicating that the cryptocurrency exchange market is in a state of extreme oligopoly, with Binance dominating, holding over 72% of the market share. Binance's average daily custodial assets are approximately $163.9 billion, with a peak of about $214.3 billion during the year, exceeding the total assets of the next seven major platforms by 2.5 times. This concentration means that in terms of actual fund storage and custody, Binance effectively assumes a role similar to that of a "systemic infrastructure," and its operational and compliance status has an amplifying effect on the robustness of the entire cryptocurrency market.
OKX ranks second with approximately $21 billion in average daily assets and a peak of $24.8 billion, about twice the size of Bybit, which ranks third, demonstrating its advantage in user fund retention and medium- to long-term asset accumulation. However, this bipolar + multiple mid-tier platform structure means that custody risk is highly concentrated on the top two platforms; if either platform experiences a tail event in compliance, technology, or operations, the spillover effect will far exceed the market share of a single platform. After the second tier, the market enters a more fiercely competitive range of tens of billions. Bybit, Gate, and Bitget have average daily assets of approximately $11.05 billion, $10.07 billion, and $7.15 billion, respectively, collectively forming the secondary asset-bearing layer. The top five platforms have absorbed over 90% of user assets, indicating a high concentration of user funds.
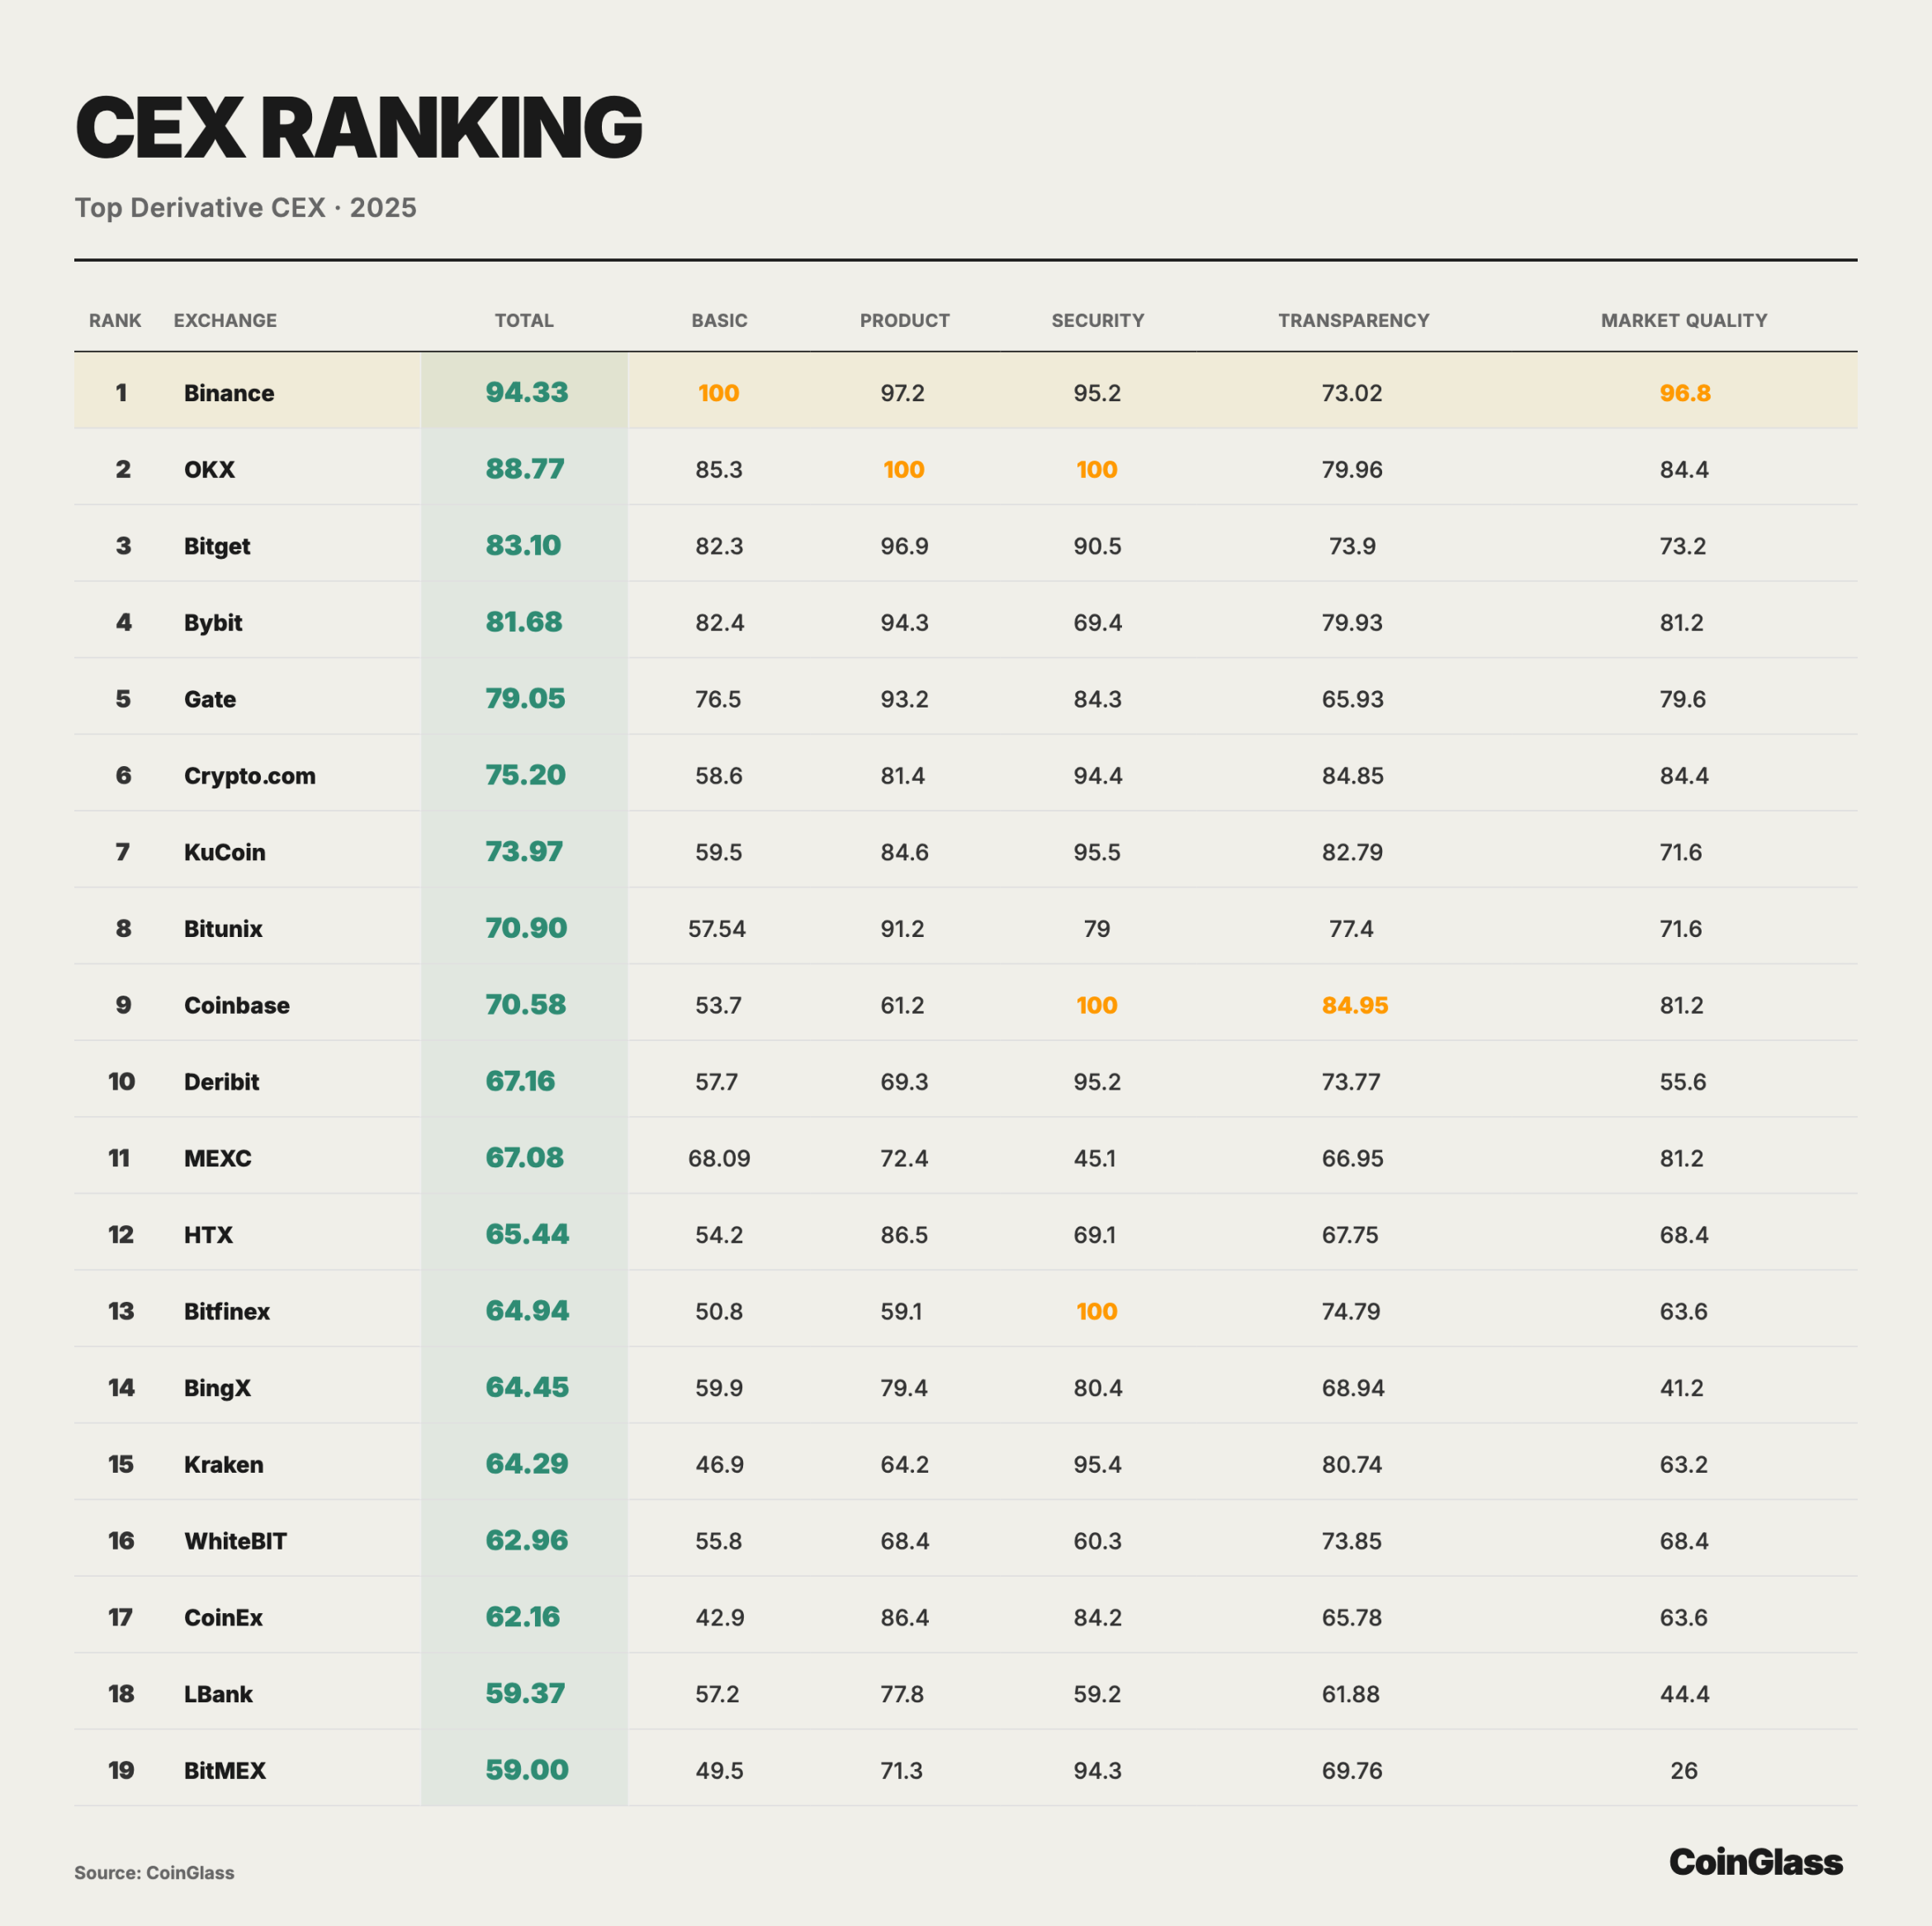
CEX Rankings
To further translate the narrative of concentration in derivatives trading on the CEX side from volume to comparable quality dimensions, CoinGlass conducted a comprehensive scoring and ranking of major derivatives CEX. The following chart focuses on basic trading data as the core weight and provides sub-scores and weighted totals from dimensions such as product, security, transparency, and market quality, thereby visually presenting the structural differences among different platforms in liquidity bearing, risk control constraints, and information disclosure.
Clearing Data
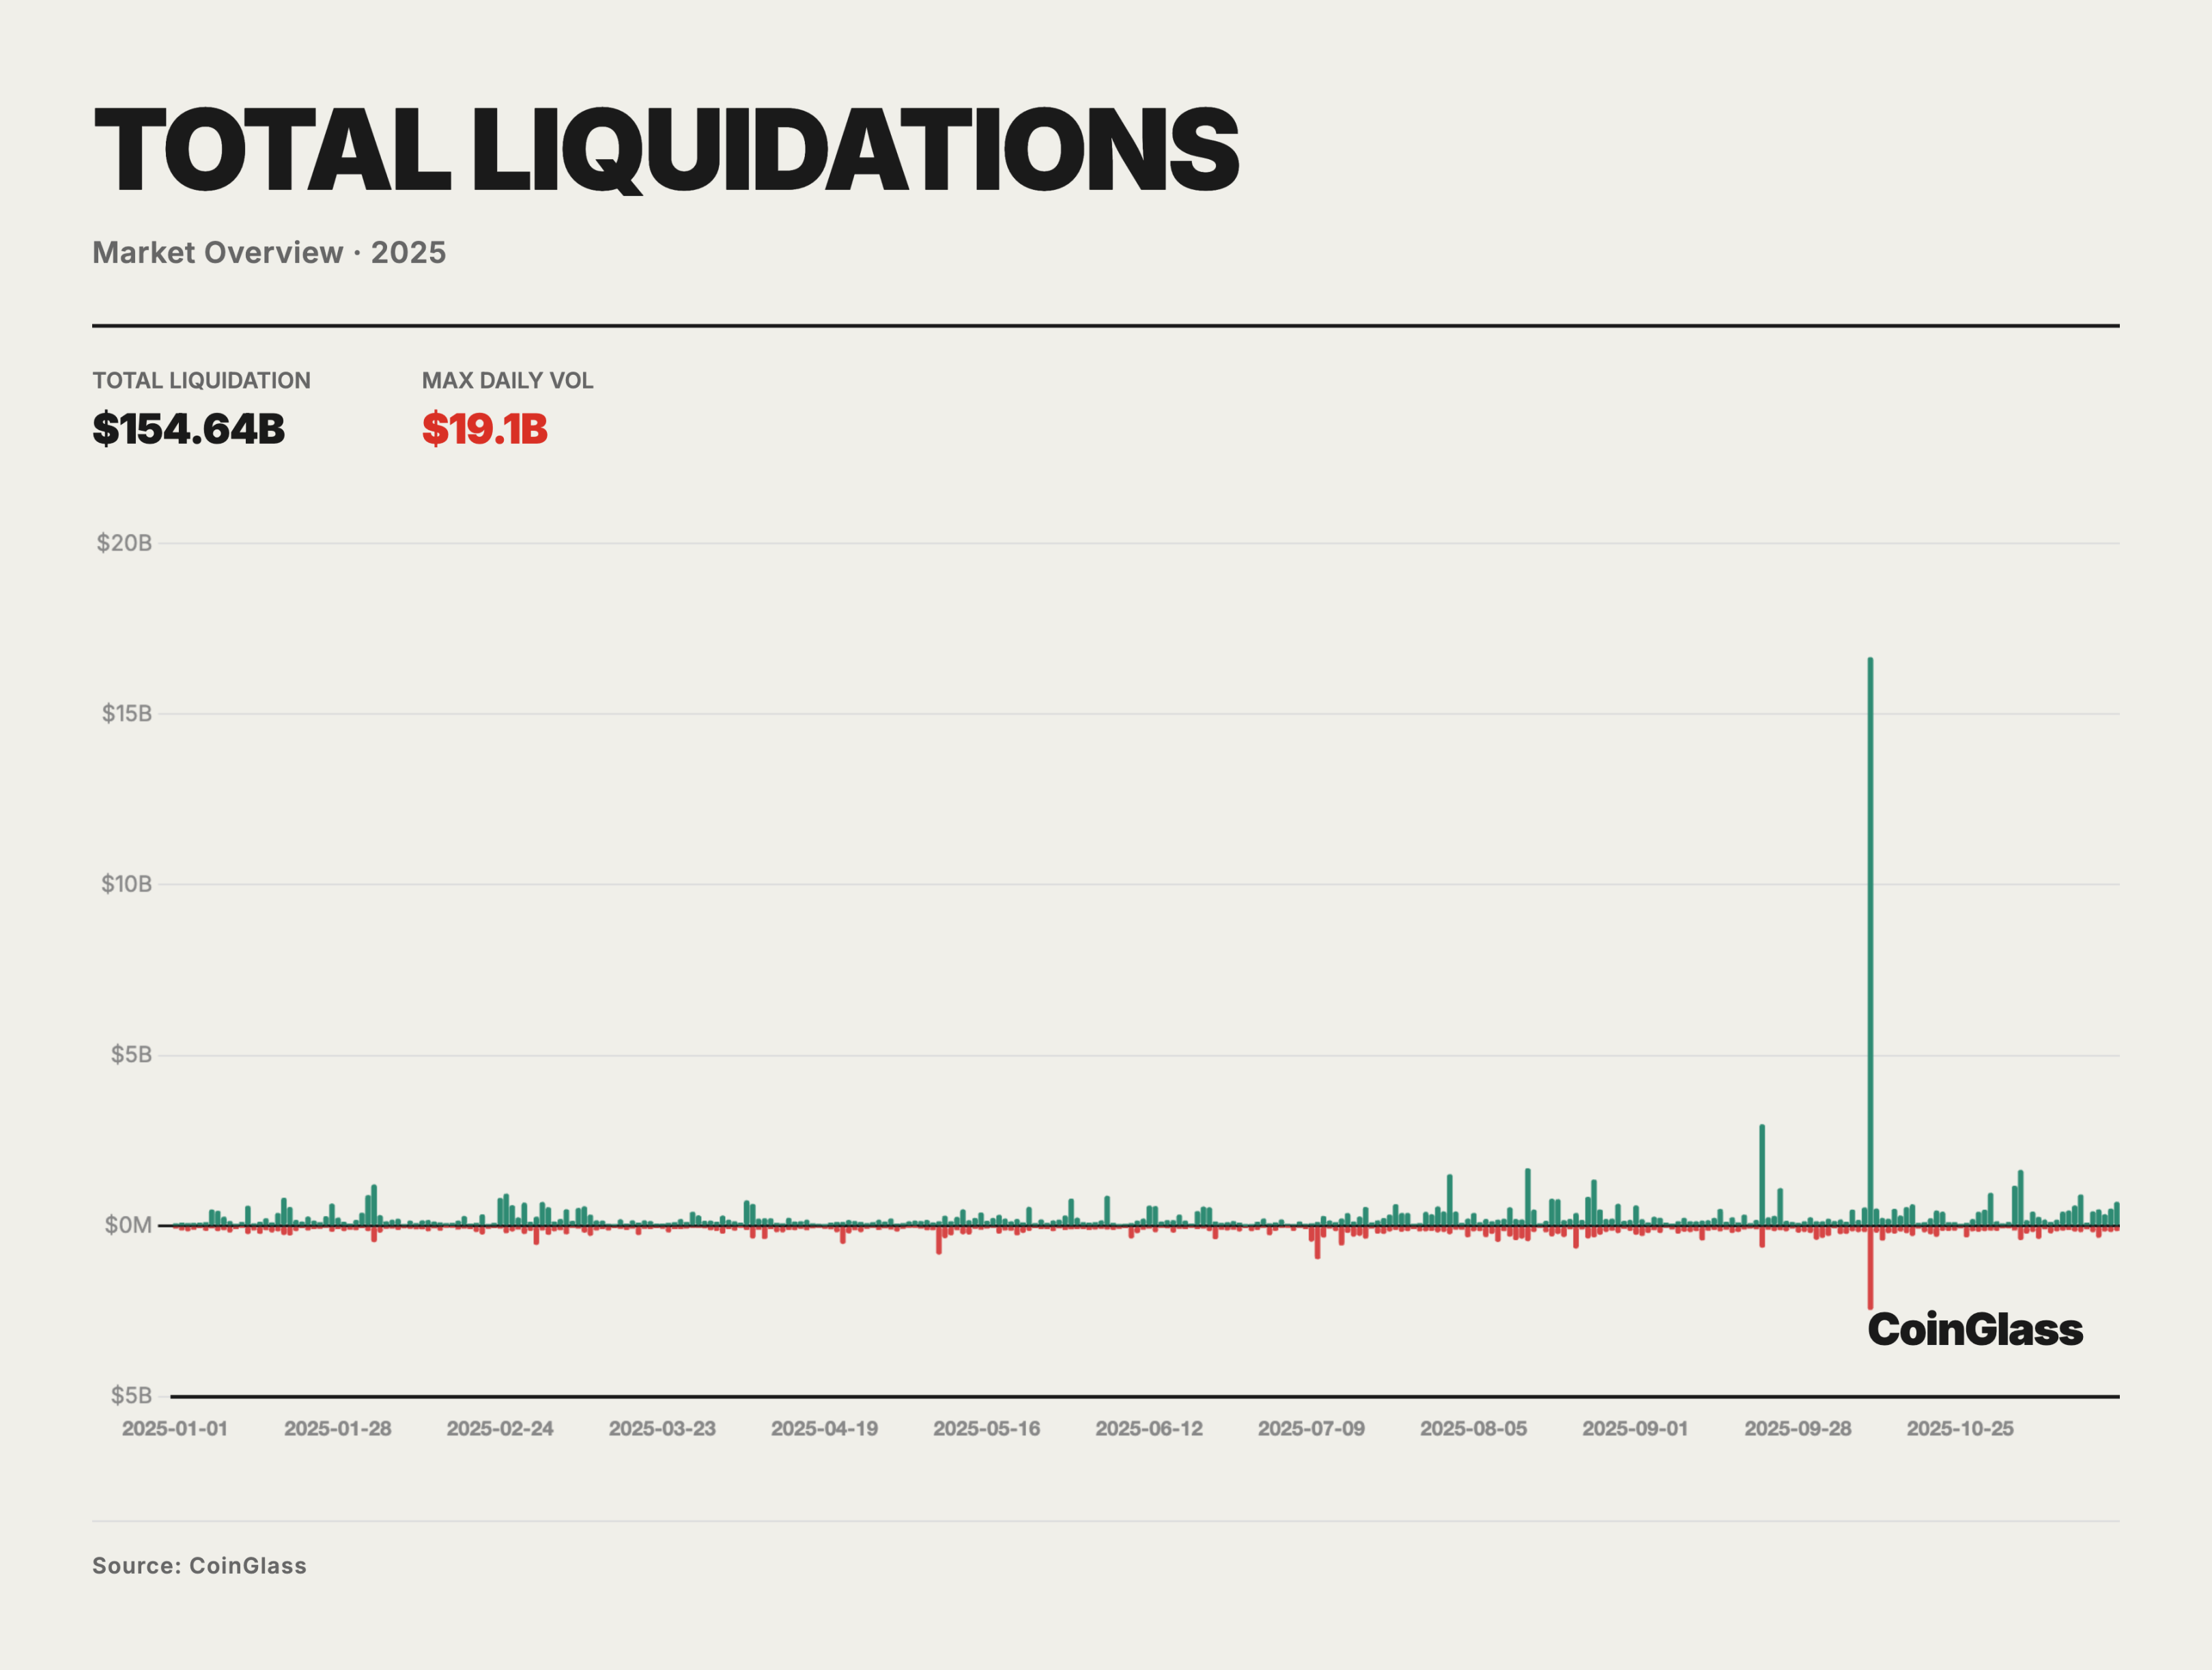
In 2025, the total nominal amount of forced liquidations for both long and short positions was approximately $150 billion, corresponding to an average daily amount of about $400-500 million in normal leverage reshuffling. On the vast majority of trading days, the scale of liquidations for both sides remained in the tens of millions to hundreds of millions range, primarily reflecting daily margin adjustments and short-term position liquidations in a high-leverage environment, with limited medium- to long-term impact on prices and structures. The truly systemic pressure concentrated in a few extreme event windows, with the deleveraging event from October 10 to October 11 being the most typical.
On October 10, 2025, the scale of liquidations across the market reached an extreme peak during the sample period, with total liquidations exceeding $19 billion, far surpassing the single-day highs of previous liquidation events. Combined with the disclosure rhythm from some platforms and feedback from market makers, the actual nominal liquidation scale may have approached $30-40 billion, several times that of the previous cycle's second-highest event. Structurally, the liquidations on that day were heavily skewed towards the long side, with long liquidations accounting for about 85-90%, indicating that prior to the event, the BTC and related derivatives markets were in an extremely crowded long leverage state.
From a causal chain perspective, the trigger point for the October 10-11 event came from an exogenous macro shock. On October 10, U.S. President Trump announced that starting November 1, a 100% tariff would be imposed on Chinese imports, along with plans to implement export controls on key software, significantly raising market expectations for a new round of high-intensity trade wars, leading global risk assets to shift into a clear risk-off mode. Prior to this, BTC had reached an all-time high of about $126,000 in 2025, driven by expectations of easing and an expansion of risk appetite, with the leverage utilization rate in the derivatives market at a high level, and the basis between spot and futures being elevated, putting the entire system in a fragile state of high valuation and high leverage. The exogenous macro negative news landed in this context, becoming the direct trigger for the concentrated liquidation chain.
What truly determined the magnitude of the event's impact was the pre-existing leverage and product structure, as well as the design of the liquidation mechanism. Compared to three or four years ago, the market in 2025 featured more perpetual products with high open interest, more mid- to small-cap assets, and more large platforms, significantly increasing the overall nominal leverage scale; at the same time, many institutions adopted complex strategies involving long-short hedging, cross-product, and cross-term positions, which superficially appeared as "risk hedging," but in reality, heavily relied on the orderly operation of the liquidation engine and ADL mechanism under extreme conditions, with tail risks inadequately managed. Once the liquidation and risk management mechanisms deviated from their ideal trajectory under pressure, the hedging legs that should have offset each other were mechanically dismantled, and combinations originally structured as neutral or low net exposure were forced to reveal high net directional positions.
After the price fell below the critical margin threshold on October 10, the conventional incremental liquidation logic was first activated, with a large number of margin-deficient longs being thrown into the order book for market price liquidation, triggering the first round of concentrated deleveraging. As the liquidity in the order book was rapidly consumed, some platforms' insurance funds struggled to fully absorb the losses, and the long-untouched automatic liquidation (ADL) mechanism was forced to intervene. By design, ADL is used in extreme situations, when insurance funds are insufficient, to forcefully reduce shorts to prevent prices from being driven to extreme levels by liquidation pressure, thereby triggering the last line of defense against insolvency for the platform. However, in this event, the execution of ADL exhibited significant deviations in price transparency and execution paths: some positions were forcefully liquidated at prices significantly diverging from market prices, causing the short positions of leading market makers, including Wintermute, to be passively closed at points far from reasonable price levels, making it nearly impossible to hedge losses through normal trading; meanwhile, the triggering of ADL was mainly concentrated on illiquid altcoins and long-tail contracts, rather than mainstream assets like BTC/ETH, causing many institutions employing structural strategies such as short BTC/long Alt to lose their short hedging legs in a short time, rapidly exposing them to significant downside in miscellaneous coin positions. The deviation in the execution of the liquidation and ADL mechanisms, compounded by infrastructure-level issues, amplified the pressure. In extreme market conditions, several centralized platforms and on-chain channels experienced congestion in withdrawals and asset transfers, with cross-platform funding channels partially interrupted at critical moments, making typical cross-exchange hedging paths difficult to execute smoothly, leading market makers, even if willing to take on counterparty risk, to struggle to hedge risks in a timely manner on other platforms or markets. In this situation, professional liquidity providers were forced to reduce quotes or even temporarily withdraw due to risk control, further entrusting price discovery to the automated logic of the liquidation engine and ADL. Meanwhile, under high load conditions, some CEX platforms experienced matching and interface lags or even brief outages, while the crypto market lacked clear circuit breaker and centralized bidding mechanisms like those in traditional stock and futures markets, forcing prices to continue sliding on an order book dominated by passive liquidations, further amplifying tail volatility.
In terms of outcomes, the impact of this event on different assets and platforms was highly uneven, but we believe the long-term effects of this event are highly underestimated. The maximum decline for mainstream assets like BTC and ETH was roughly in the 10-15% range, while many altcoins and long-tail assets experienced extreme retracements of 80% or even close to zero, reflecting that the liquidation chain and ADL execution produced the most severe price distortions on the least liquid targets. Compared to the Terra/3AC period in 2022, this round of events did not trigger large-scale institutional chain defaults; although market-making institutions like Wintermute suffered some losses due to the ADL mechanism, their overall capital remained sufficient, with risks more concentrated in specific strategies and assets, rather than spreading through the complex market structure to the entire system.
On-Exchange Derivatives and DAT
On-Exchange Derivatives
The fiscal year 2025 was not only a watershed moment in the history of digital asset development but also a key year for CME to establish its position as the global center for cryptocurrency pricing and risk transfer. If 2024 was the inaugural year for spot ETF access, then 2025 marked the deepening of the on-exchange derivatives market. In this year, we witnessed institutional capital shift from purely passive allocation to actively managing through complex derivatives strategies, with the liquidity moat between the compliant on-exchange derivatives market and the unregulated offshore market being completely restructured.
The most disruptive product innovation in 2025 was undoubtedly the launch and popularization of Spot-Quoted Futures (codes QBTC and QETH). Unlike traditional futures, these contracts aim to provide a closer anchoring to spot prices through a special settlement mechanism, significantly reducing basis risk and roll costs.
With the launch of real-time data for the CME BTC Volatility Index (BVX), the market is likely to welcome tradable volatility futures in 2026. Institutional investors will have direct tools to hedge unknown risks for the first time, without needing to simulate through complex options combinations.
In 2025, we witnessed the normalization and scaling of basis trading. With the exponential growth of assets under management for spot ETFs, using CME futures for cash-and-carry arbitrage not only became a mainstream strategy for hedge funds but also a key link connecting traditional financial rates with crypto-native yields.
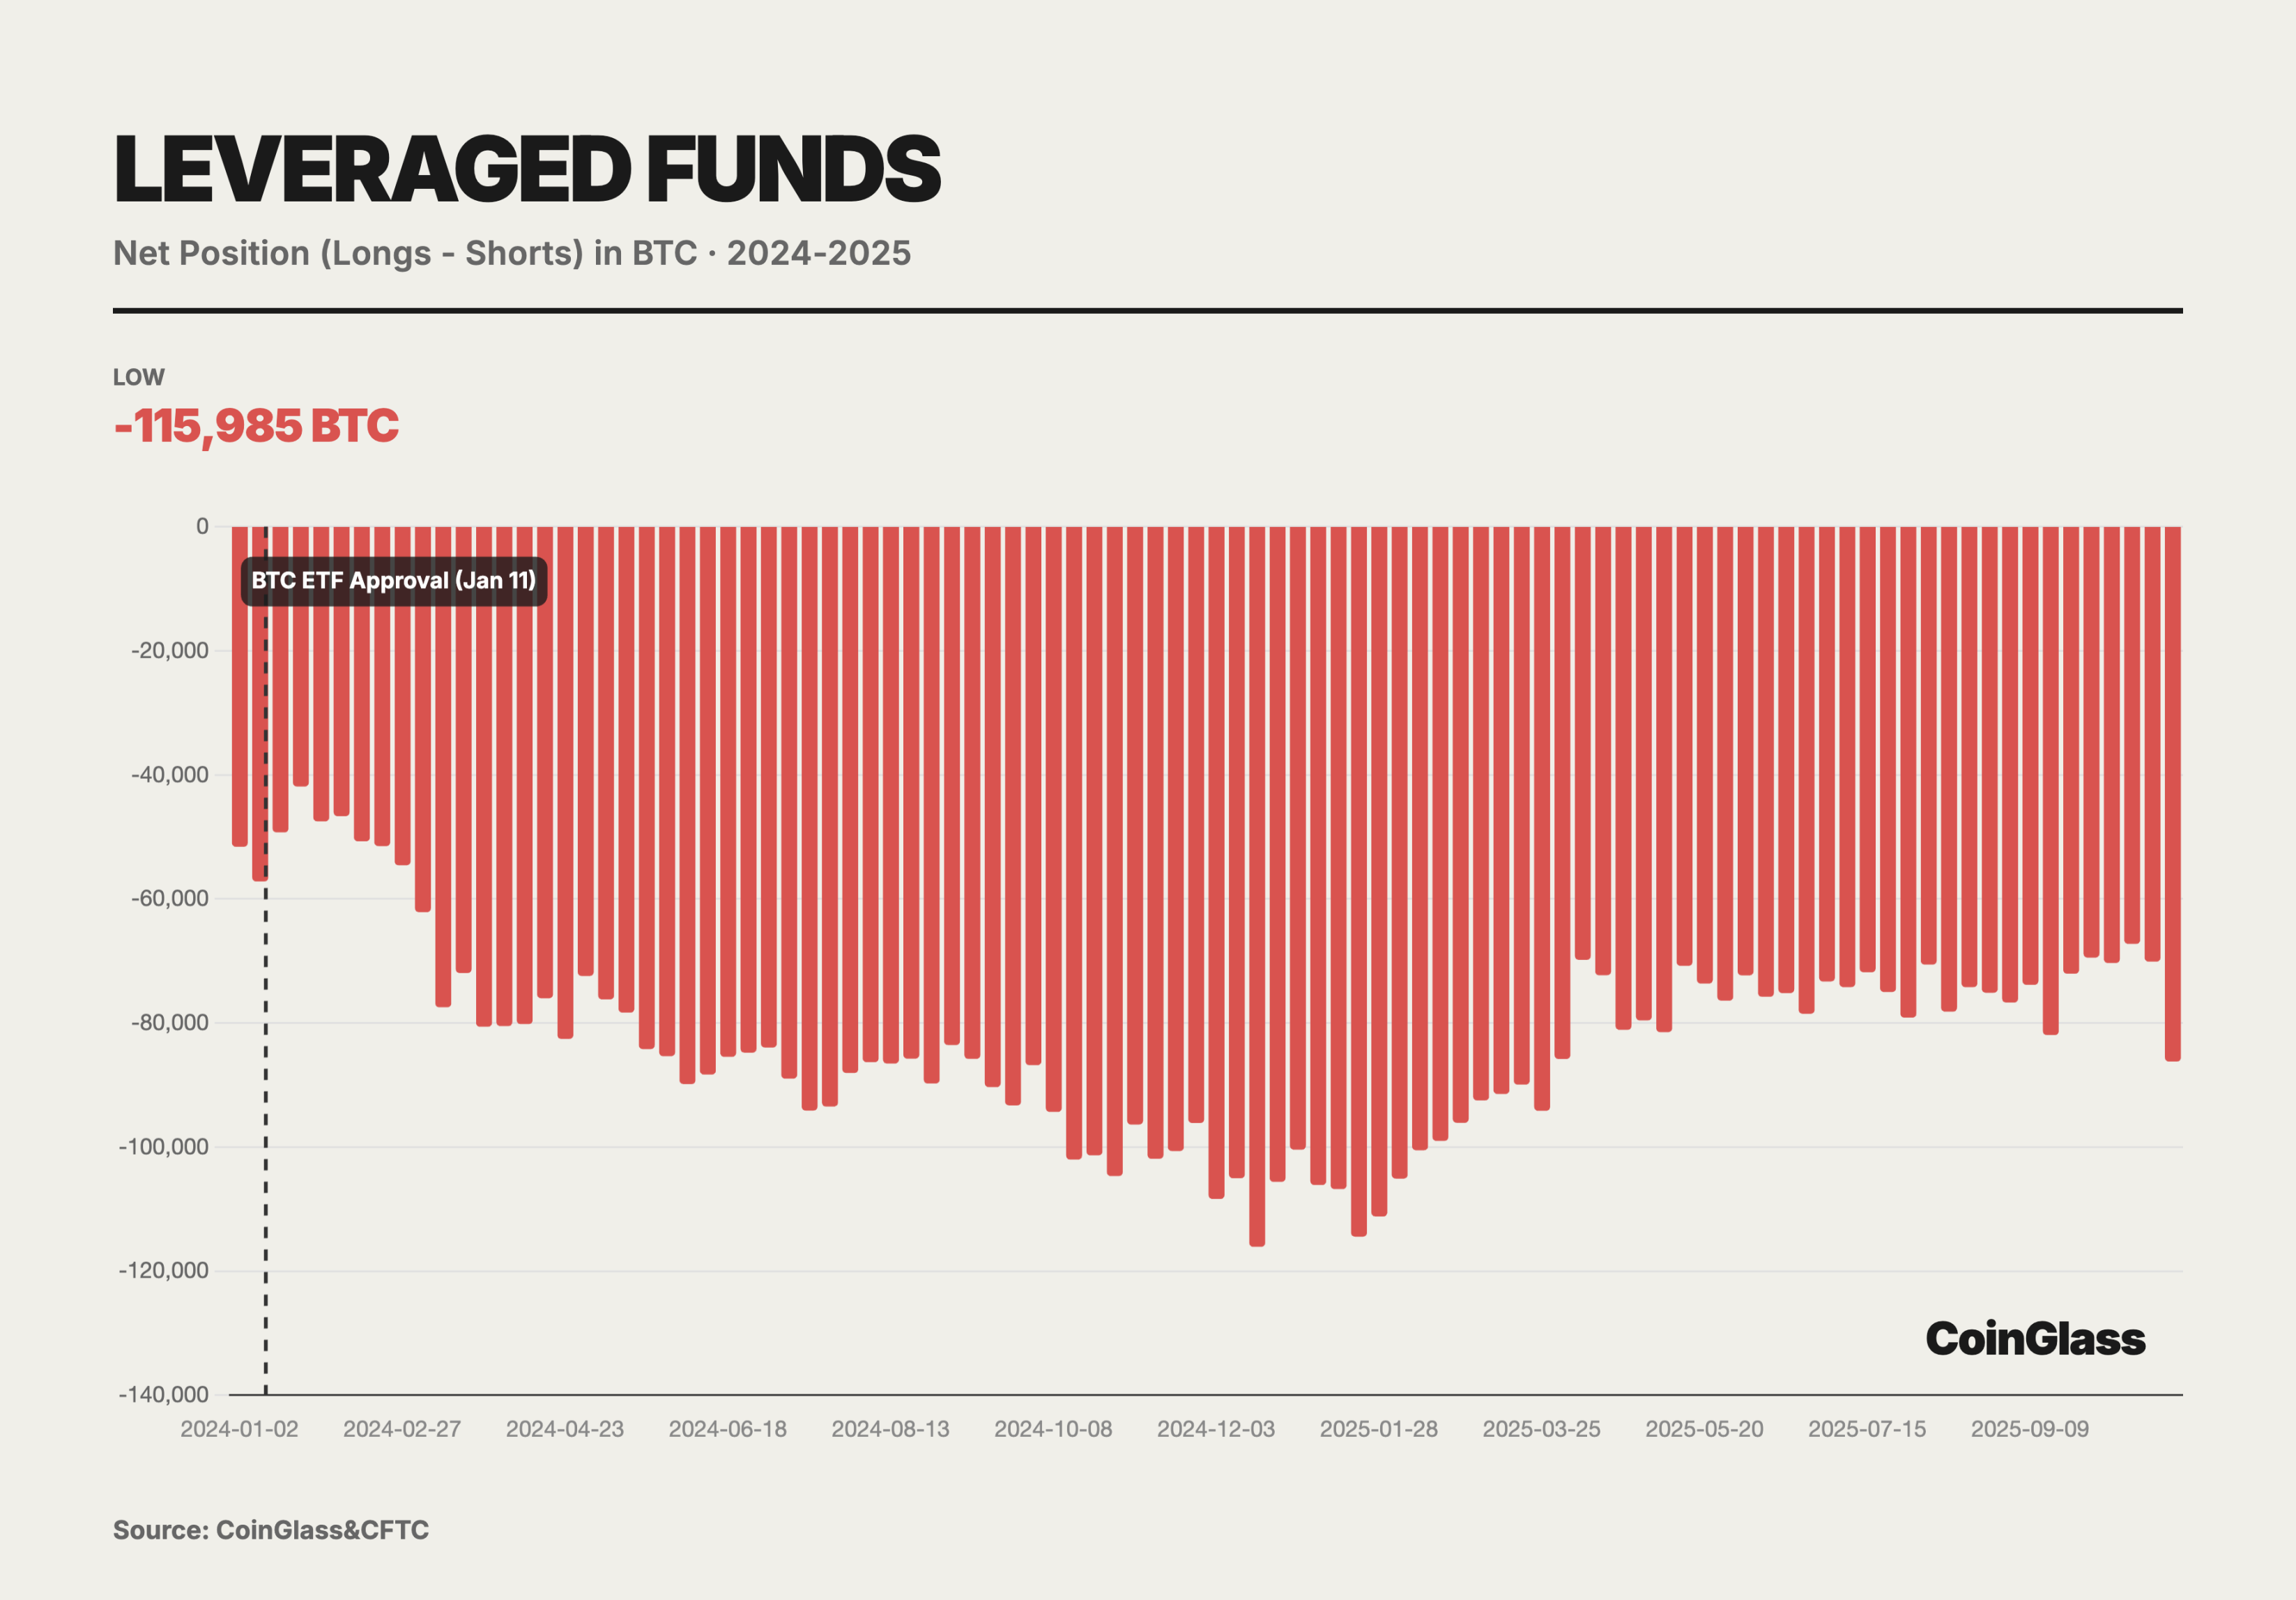
Currently, leveraged funds hold net short positions of up to 14,000 contracts. In-depth analysis shows that this is actually a direct product of basis trading. Leveraged funds buy BTC in the spot market or through ETFs while simultaneously selling an equivalent amount of futures contracts on CME. This combination is delta neutral, aiming to profit from the basis yield when futures prices exceed spot prices. As the inflow of funds into spot ETFs increases, the short positions of leveraged funds have also increased in tandem. This proves that the short positions are not directional shorts but are meant to hedge the long inventory brought by spot ETFs. At their peak, leveraged funds held net short positions of 115,985 BTC, effectively making them the main providers and carriers of liquidity for spot ETFs.
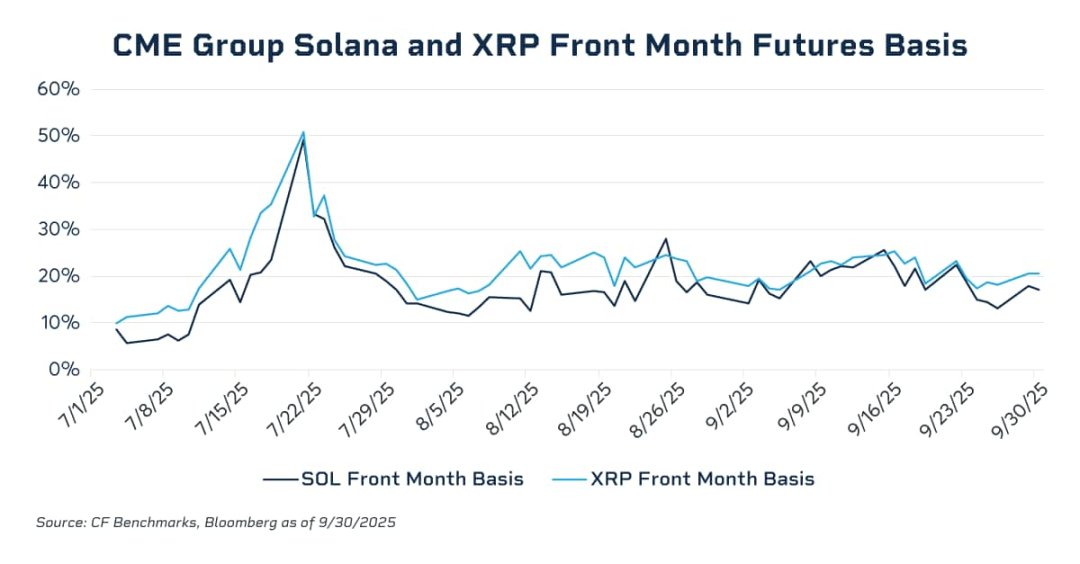
Data shows that the annualized basis for the front-month contracts soared to the 20-25% range during the bull market in November 2024, while it compressed to nearly 0 during the deleveraging period in Q1. In July 2025, the annualized basis for near-month futures contracts of SOL and XRP surged to nearly 50%, far exceeding the basis levels typically seen in BTC futures, clearly exposing the lack of effective cross-market arbitrage forces in the related markets. In the absence of highly liquid, regulated spot investment tools, institutional capital found it difficult to scale deploy cash and arbitrage structures for futures shorts/spot longs, and thus could not exert sustained pressure on excessively high basis premiums. With the launch of SOL and XRP spot ETFs under a common listing regulatory framework, this structural gap has been partially filled, providing necessary spot vehicles and liquidity foundations for compliant institutional capital to enter the market and compress futures basis through arbitrage. As the CFTC approves spot trading, it is highly likely that margin offsets between spot and futures will be realized in 2026. This will release tens of billions of dollars in idle capital, greatly enhancing the market's leverage efficiency. At that time, the friction costs of basis trading will drop to historic lows, and basis levels may further converge to those of traditional commodities.
In November 2025, the average daily trading volume of the CME cryptocurrency sector reached a historic 424,000 contracts, with a nominal value of $13.2 billion, a year-on-year increase of 78%. This figure surpassed any single-month performance in 2024 and approached the levels seen at the peak of the 2021 bull market, but its composition was healthier, driven more by institutional hedging and arbitrage rather than pure retail speculation.
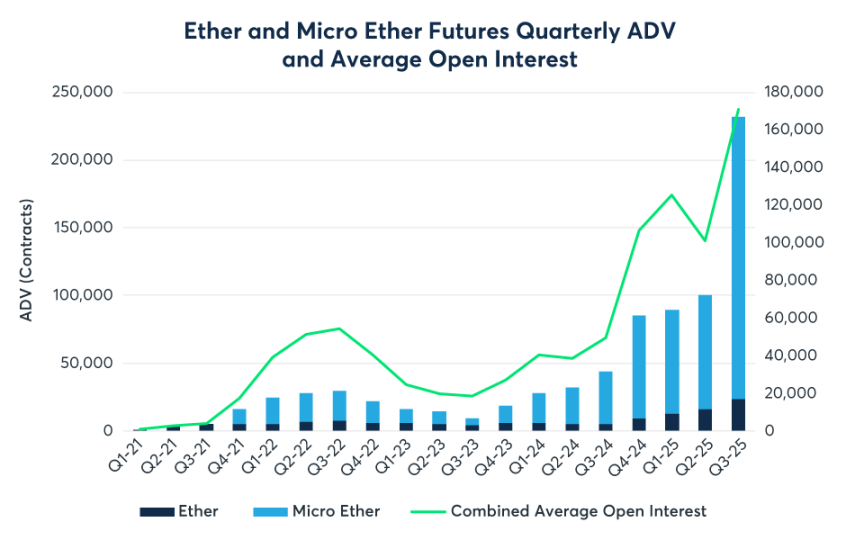
Despite BTC maintaining an absolute advantage in nominal open interest, 2025 was a year of explosive liquidity for ETH derivatives. Data shows that the average daily trading volume of ETH futures in the third quarter surged by 355% year-on-year, far exceeding the growth rate of BTC. The passage of the GENIUS Act in July 2025 removed the last compliance barrier for traditional financial institutions to enter the market, directly driving the CME cryptocurrency complex to set a record of $31.3 billion in average daily open interest in Q3. Micro contracts continued to play a foundational role in liquidity, with the average daily volume of micro ETH futures (MET) reaching an astonishing 208,000 contracts. According to broker data, many mid-sized hedge funds and family offices preferred to use micro contracts for position adjustments to more precisely match the scale of their spot portfolios, avoiding the granularity issues posed by standard contracts (5 BTC / 50 ETH).
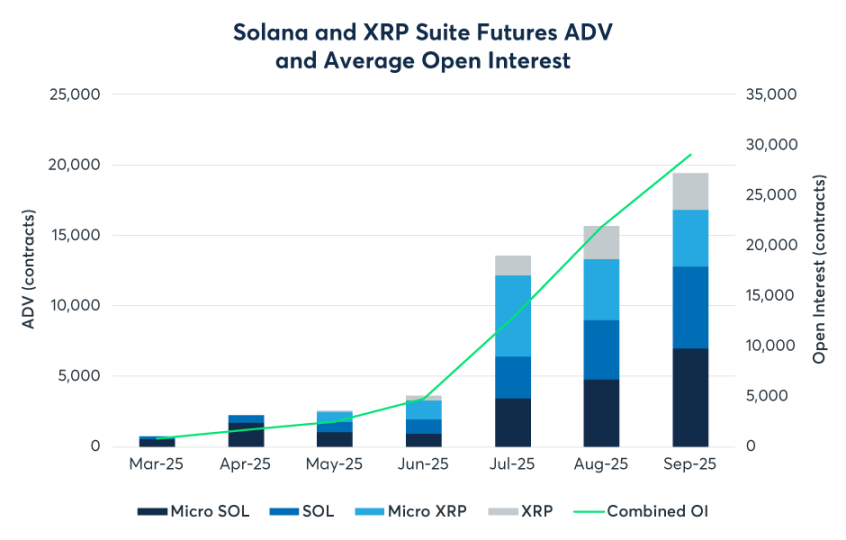
For a long time, CME was a dual oligopoly market for BTC and ETH. However, this pattern was broken in 2025. With the launch of SOL and XRP futures and options, CME officially entered the multi-asset era. As a strong competitor as the third-largest asset, SOL futures have performed impressively since their launch in March. By Q3, the cumulative trading volume reached 730,000 contracts, with a nominal value of $34 billion. More importantly, the open interest of SOL futures rapidly surpassed $2.1 billion in September, setting a record for the fastest doubling of new contract open interest. Meanwhile, XRP futures traded 476,000 contracts since their launch in May. The XRP options launched on October 13 became the first such product regulated by the CFTC, marking that institutional investors no longer equate cryptocurrencies solely with BTC. For assets like SOL and XRP, which have different risk-return characteristics, institutions began to seek compliant hedging channels, indicating that multi-strategy crypto hedge funds will be more active on CME in the future.
DAT
At the beginning of the 2025 fiscal year, the update ASU 2023-08 released by the Financial Accounting Standards Board (FASB) officially took effect, and this rule change is the cornerstone of the explosive growth in financial performance of the DAT sector this year. The new standard mandates that companies measure certain crypto assets at fair value and directly account for changes in fair value in the current net profit. Digital Asset Treasury (DAT) refers to publicly listed companies that systematically migrate a significant portion of their treasury reserves, far exceeding daily operational needs, from cash and short-term debt to digital assets like BTC, ETH, and SOL. They treat crypto assets as core allocations on the balance sheet rather than marginal speculative positions. Compared to spot ETFs, DAT is not a passive tracking tool but a corporate entity with full operational rights and capital management capabilities. Company management can continuously increase the number of digital assets per share through value-added financing methods such as convertible bonds and ATM issuances, creating what is known as the DAT flywheel effect. When the stock price has a premium relative to net asset value (NAV), the company issues more shares to purchase additional digital assets, diluting equity while increasing the per-share crypto amount, which in turn supports or even amplifies the premium.
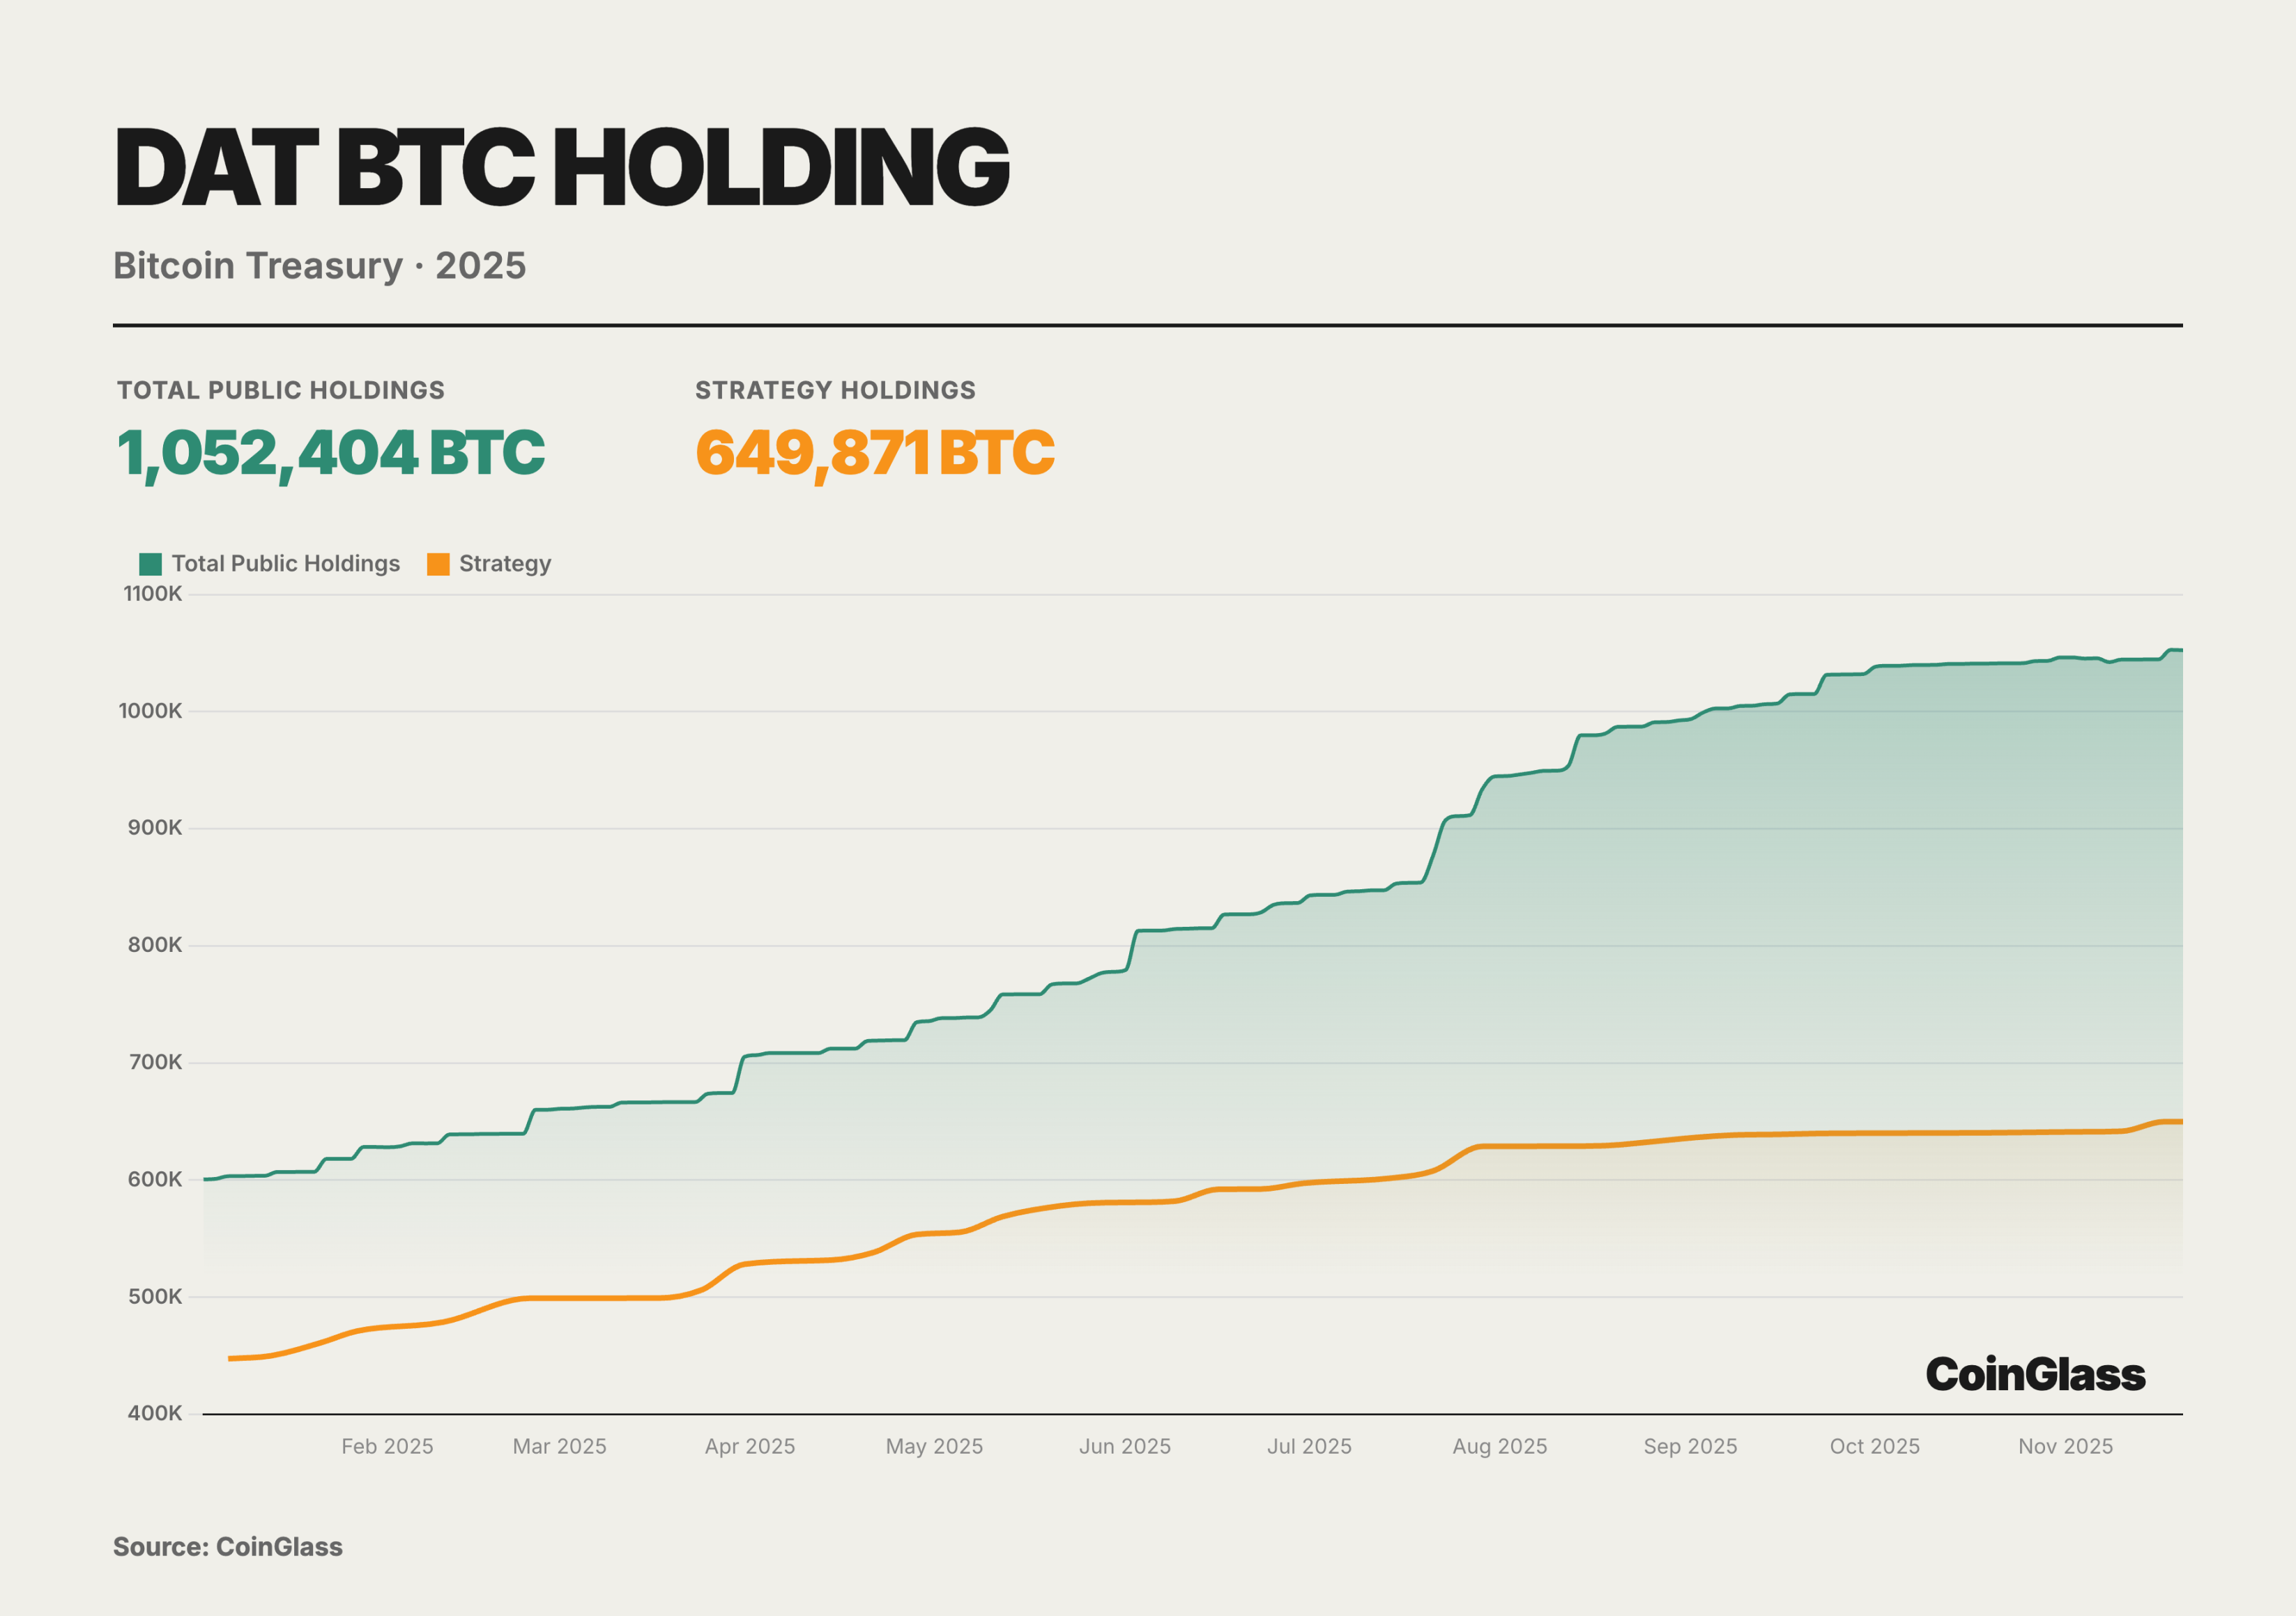
In 2025, the BTC holdings of listed companies in the DAT sector followed an almost monotonically increasing trajectory, rising from about 600,000 coins at the beginning of the year to about 1.05 million coins in November, accounting for approximately 5% of the theoretical total supply of BTC; among them, Strategy increased its holdings from about 447,000 coins to about 650,000 coins, remaining an irreplaceable core of the treasury in absolute terms, but its market share slipped from about 70% to just over 60%, with the incremental growth coming more from mid-sized and small DATs.
In the second and third quarters, various models of DAT collectively entered the market, pushing total BTC holdings over the one million coin threshold. By the fourth quarter, although net inflows of funds plummeted from their peak and DAT stock price premiums were significantly compressed, the curve only showed a slowdown in slope rather than a directional reversal, with no systemic deleveraging or forced liquidations occurring. The trend indicates that the so-called bubble burst is more about re-pricing at the equity level rather than the collapse of BTC positions on the asset side. DAT has transformed from a thematic trade into a structural buying layer within a regulatory framework, forming a BTC supply-side buffer locked in by corporate governance, accounting standards, and information disclosure systems. Meanwhile, the industry structure has evolved from "single whale dominance" to "whales + long-tail groups," with the risk focus shifting substantively from the price of the coin itself to the financing structures, corporate governance, and regulatory impacts of individual DATs. The key for the DAT sector is no longer to predict the short-term rise and fall of BTC but to understand the financing structures, derivatives exposures, and macro hedging logic behind these companies. In the upcoming 2026, as the MSCI index review approaches and global monetary policy potentially shifts, the volatility tests faced by DAT companies are just beginning.
Options Market
The core narrative of the options market this year is defined by two major milestone events, which together reshaped the logic of global digital asset pricing power. The first was the acquisition of offshore options giant Deribit by the largest compliant exchange in the U.S., Coinbase, for $2.9 billion. This merger not only marked the integration of traditional compliant exchanges with native crypto liquidity but also redefined the infrastructure landscape of global derivatives trading. The second was the rise of BlackRock's IBIT ETF options, which, by the end of Q3 2025, surpassed the long-dominant Deribit in open interest for the first time, marking that traditional financial capital has officially challenged crypto-native platforms in volatility pricing power. Prior to this, Deribit enjoyed an almost monopolistic advantage, controlling about 85% of the global crypto options market share by the end of 2024.
This year, the involvement of traditional financial institutions became a watershed moment for changes in the options market. With the evolution of the U.S. regulatory environment, several Wall Street institutions launched BTC ETFs and their options products. Notably, BlackRock's IBIT began offering options trading in November 2024 and quickly rose to become a new giant in the BTC options market in 2025. Overall, the market landscape in 2025 exhibited a dual-track characteristic: on one hand, crypto-native platforms represented by Deribit, and on the other hand, traditional financial channels represented by IBIT and other ETF options.
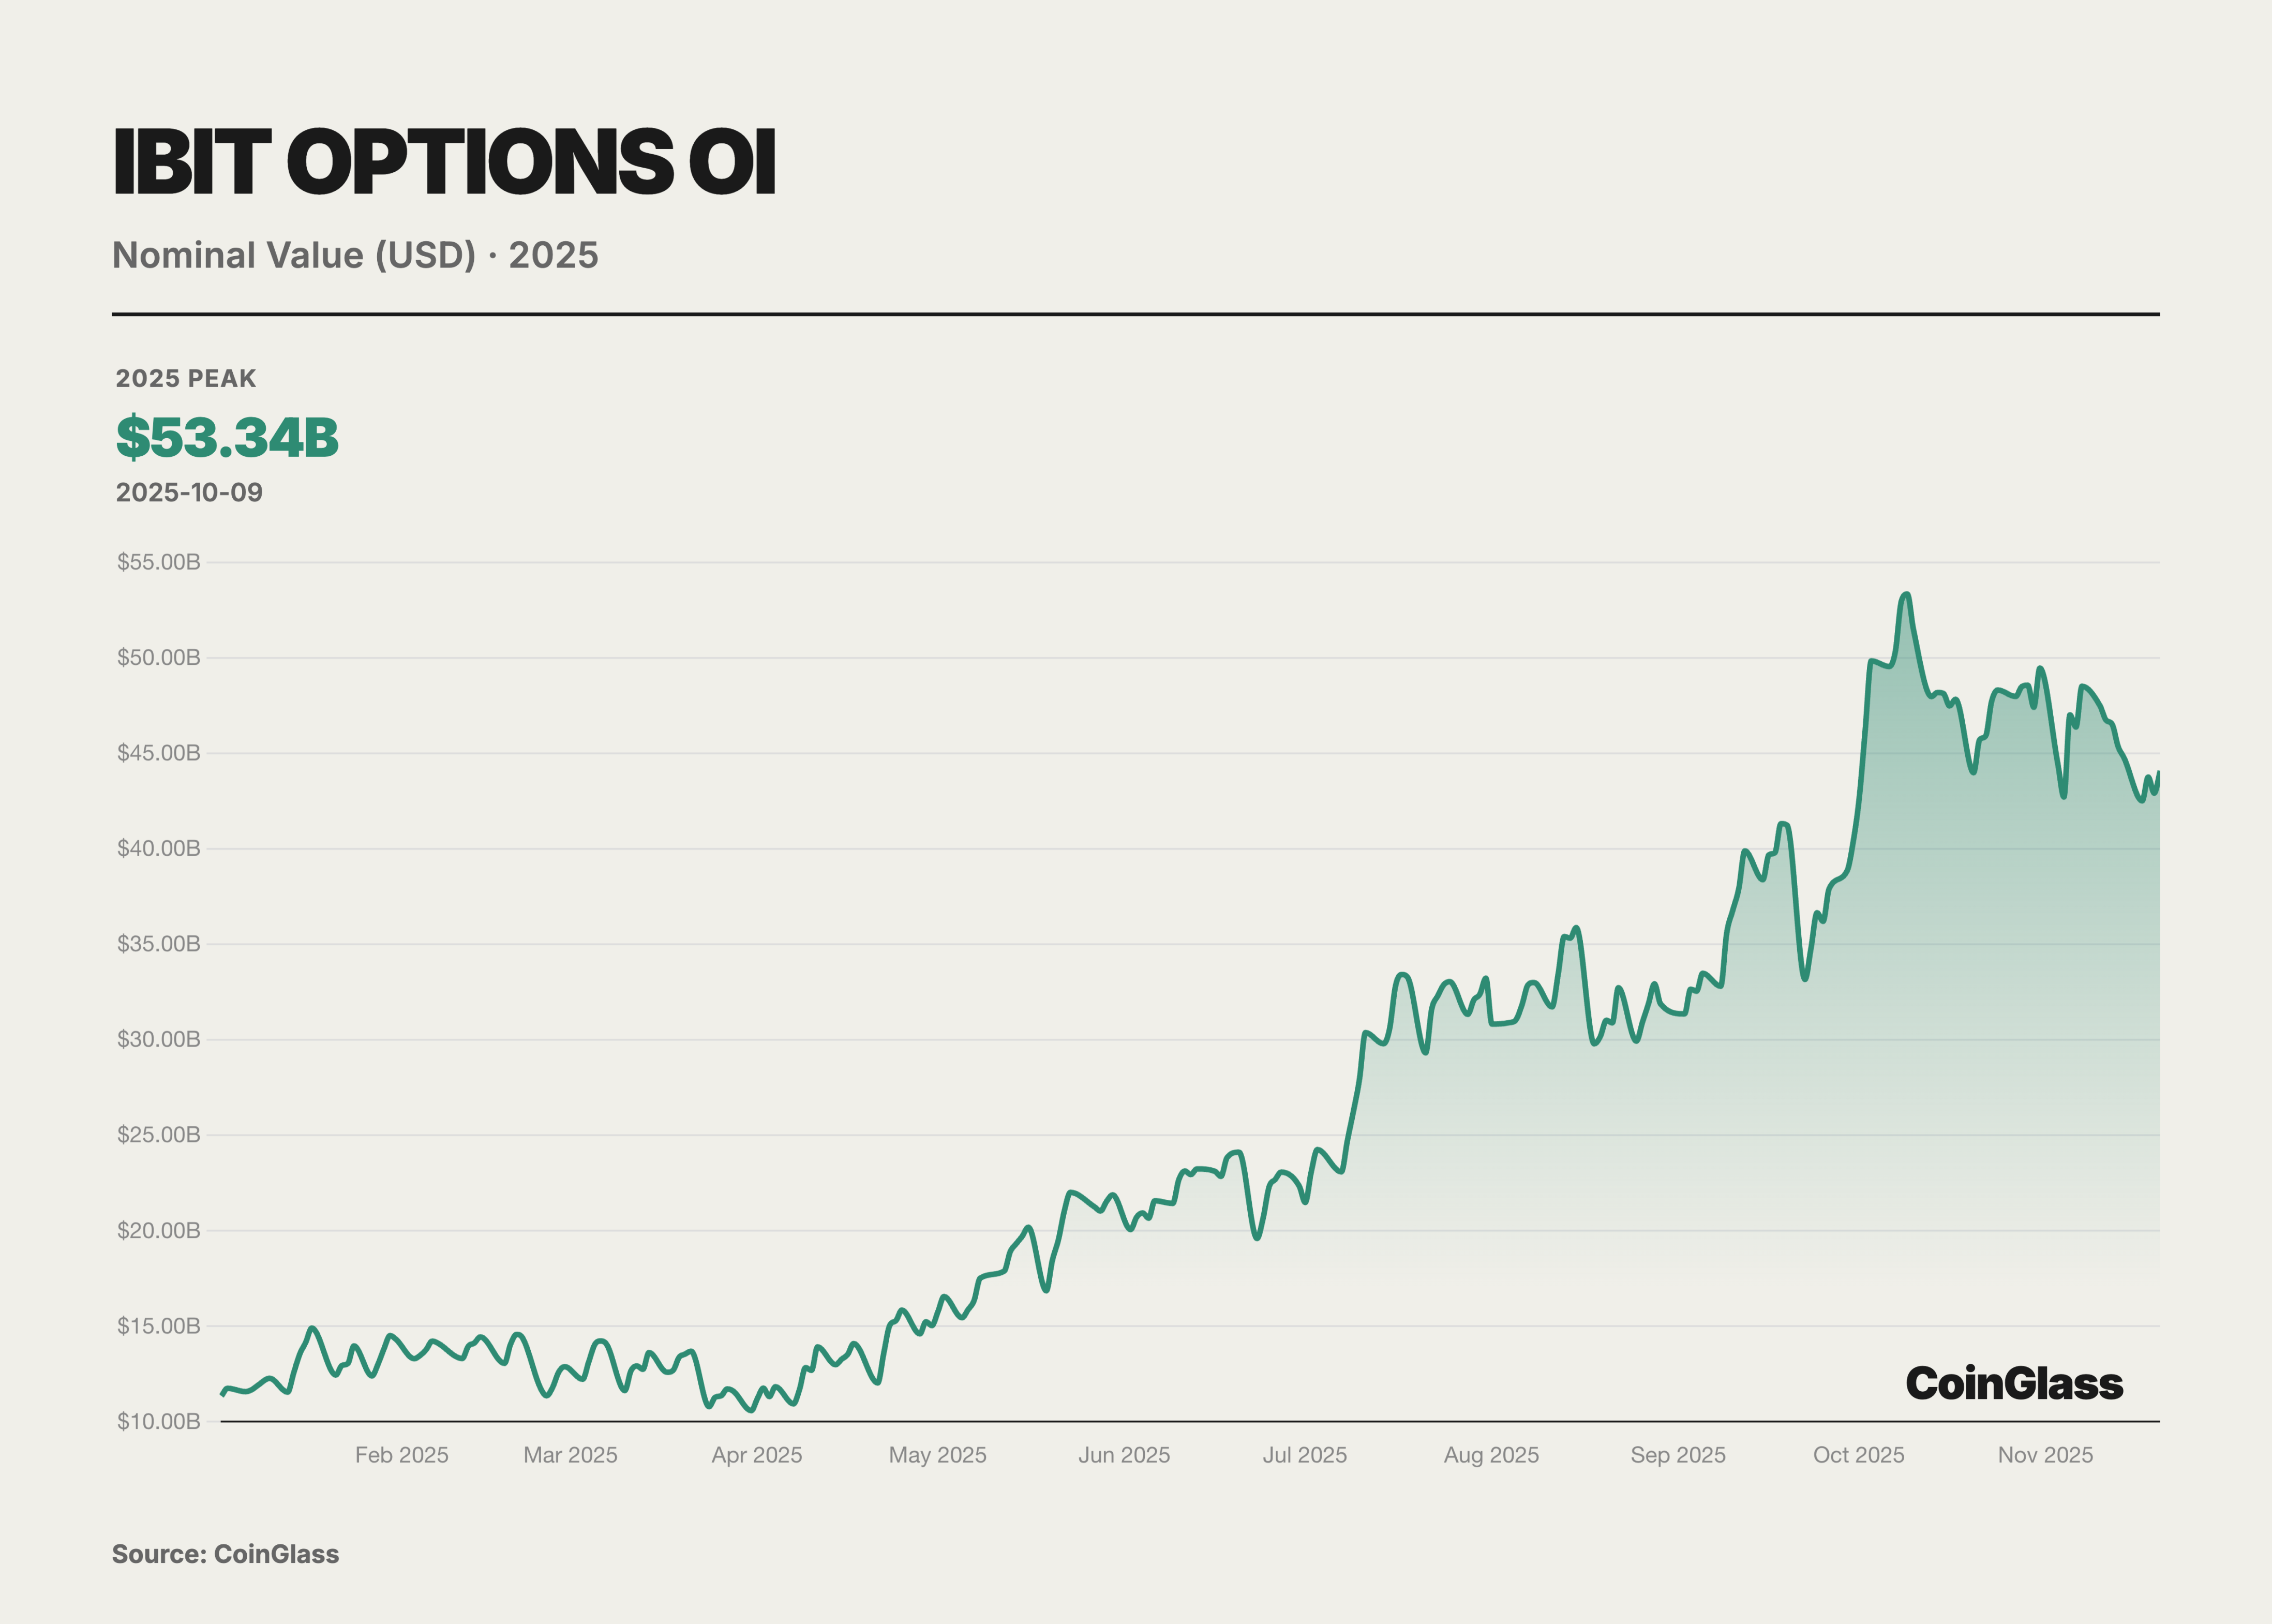
The strong rise of BlackRock's IBIT ETF options posed a direct challenge to Deribit. As a spot BTC ETF listed on the Nasdaq in the U.S., IBIT's options, launched at the end of 2024, saw a rapid increase in open interest within less than a year. By November 2025, IBIT had become the largest trading vehicle for BTC options globally, replacing Deribit's long-standing dominance. The success of IBIT options highlights the significant influence of traditional financial power—many institutional investors, previously restricted by regulations from participating in offshore platforms, entered the BTC options market through IBIT, bringing massive amounts of capital and demand. The credibility and compliance framework of large asset management companies like BlackRock behind IBIT also attracted more conservative institutions to use options for BTC risk exposure management. As of November 2025, IBIT, as the largest spot BTC ETF, had a management scale of $84 billion, providing ample spot support and liquidity for the options market, fully demonstrating the strong demand for spot ETF options.
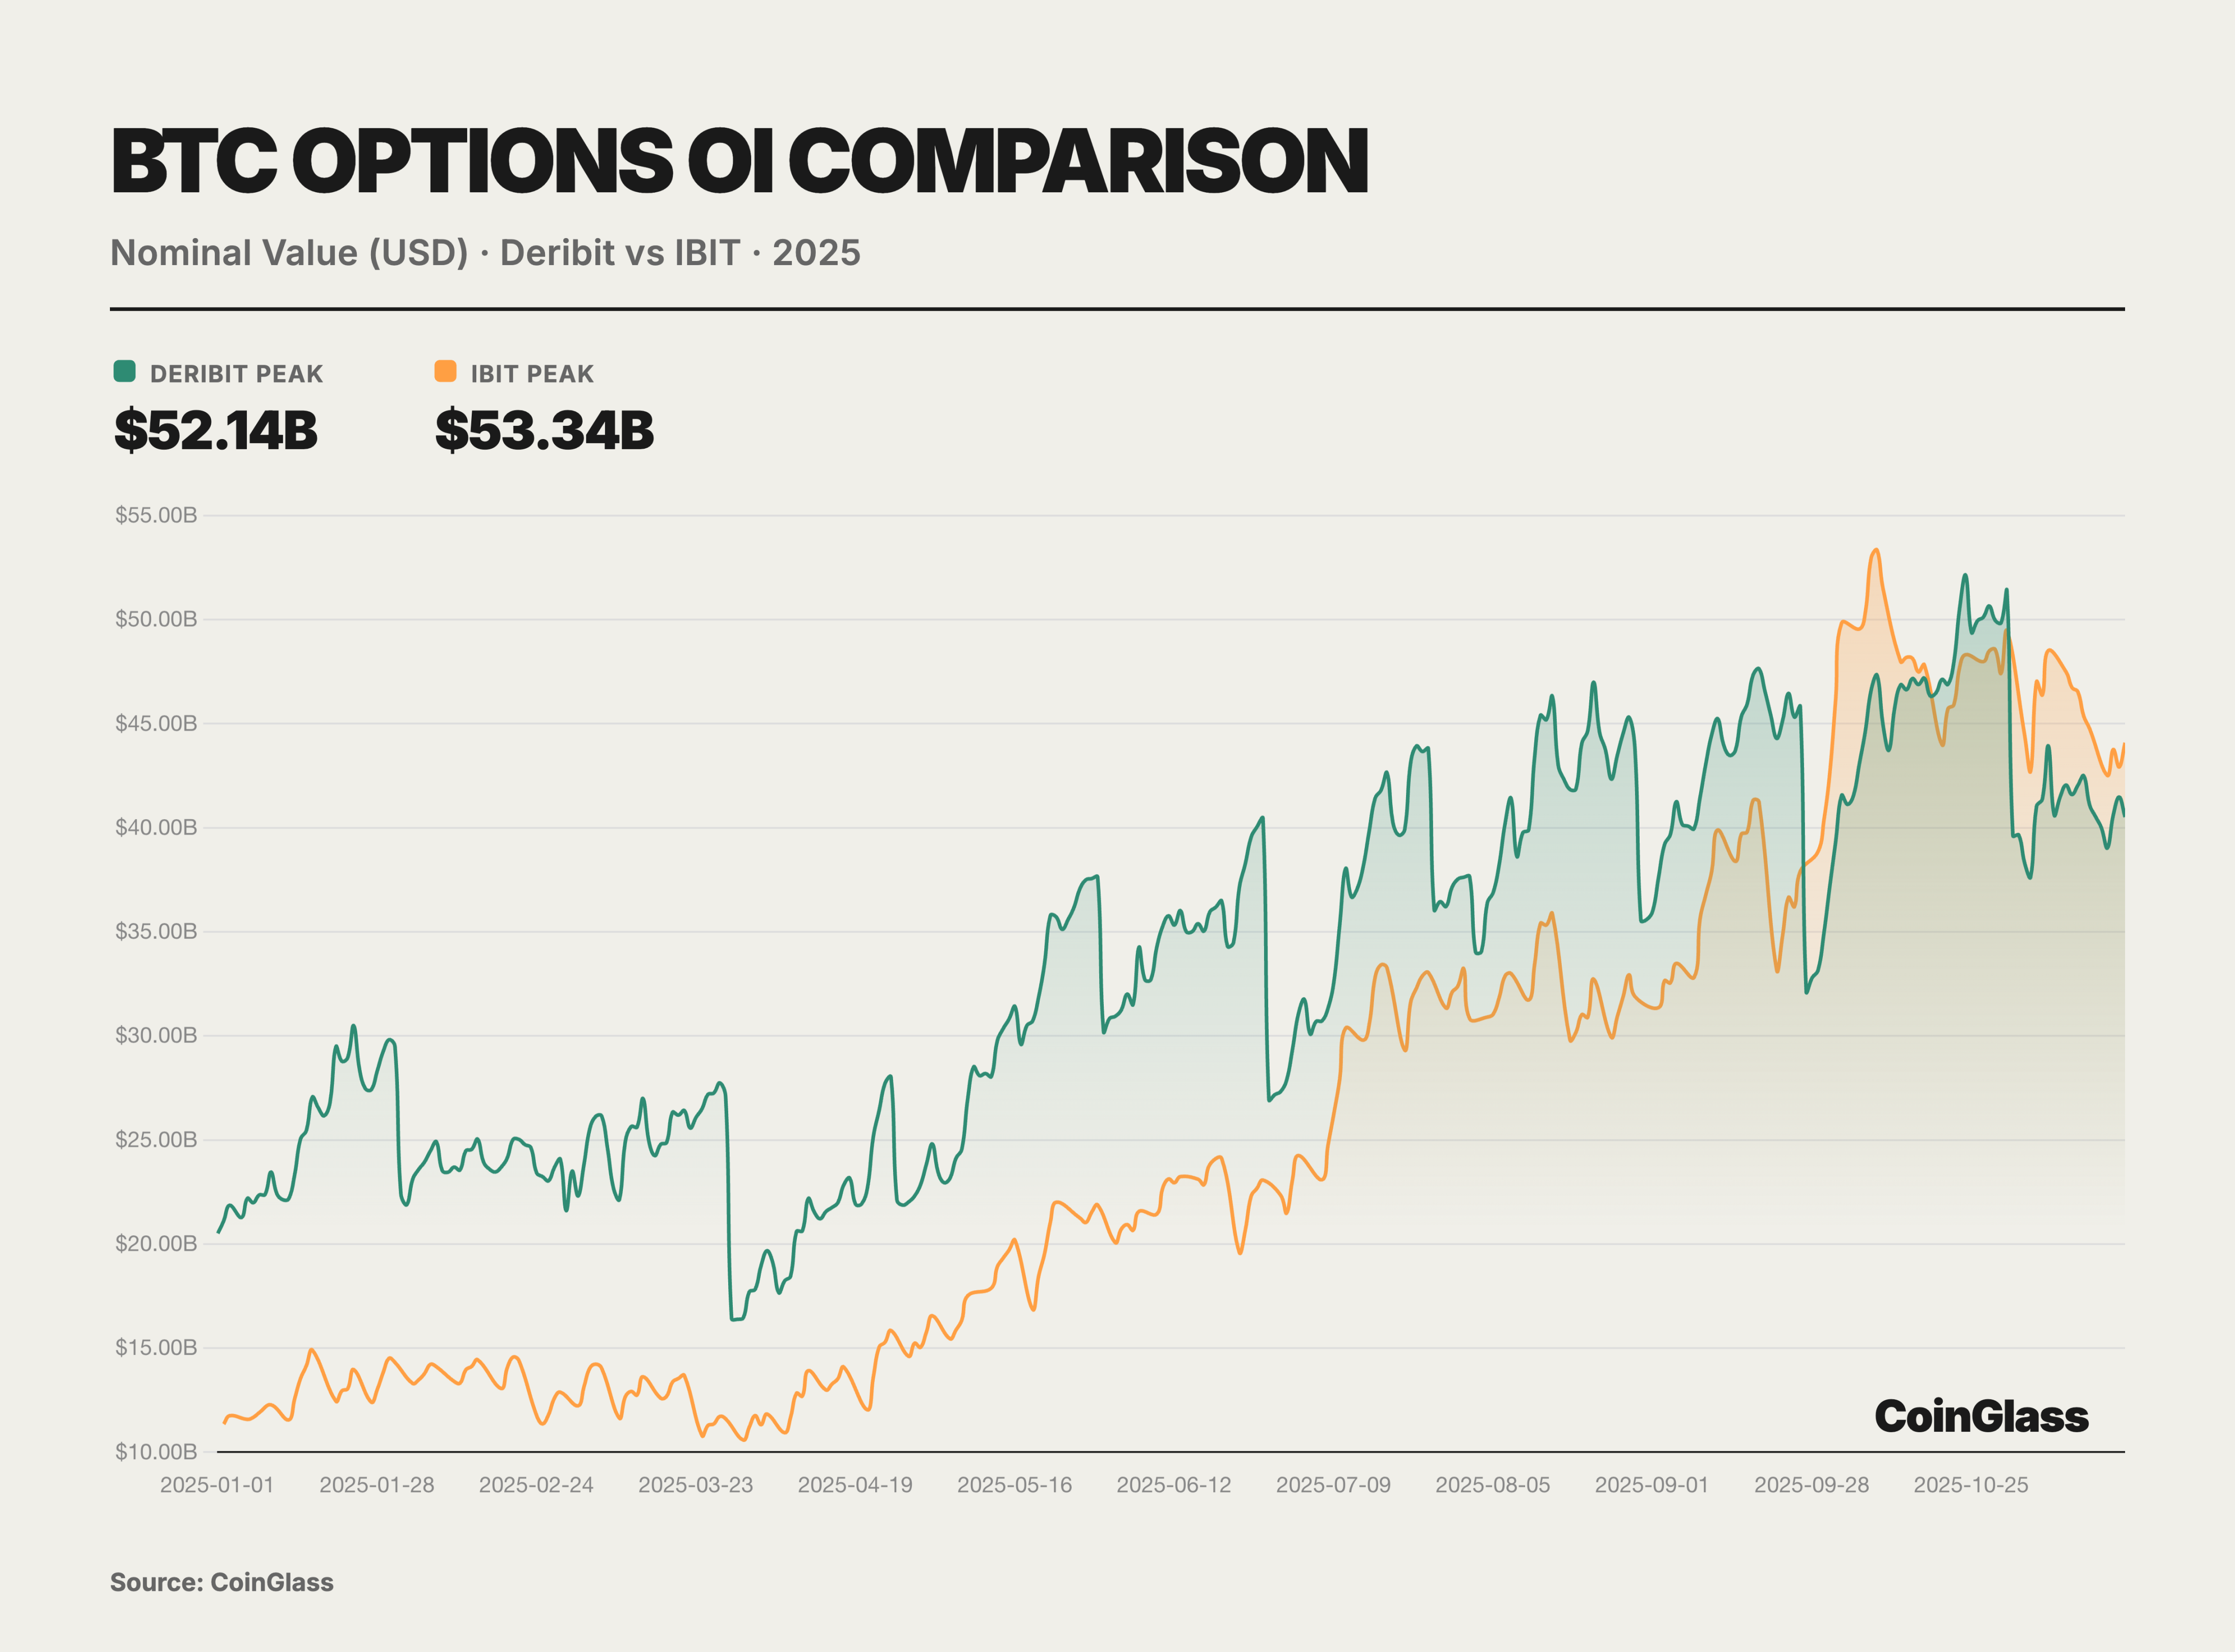
Aside from Deribit and IBIT, less than 10% of the BTC options market is divided among the CME and a few other crypto trading platforms. The Chicago Mercantile Exchange (CME), as a traditional regulated venue, offers options trading based on BTC and ETH futures. After several years of development, although CME's market share has increased, as of Q3 2025, its share of global BTC options open interest was only about 6%. This reflects the limited market appeal of futures-based options compared to more flexible crypto-native platforms and ETF options. Centralized exchanges like Binance and OKX have also attempted to launch BTC and ETH options products in recent years, but user participation has been relatively low. The trading volume of these exchanges' derivatives is mainly concentrated in perpetual contracts and futures, with options business accounting for only a small portion of their derivatives landscape. Platforms like Bybit also offer USDC-settled options trading, but their overall market share is similarly limited. Other exchanges represented by OKX and Binance contribute only about 7% of BTC options open interest in total. Overall, the crypto options market in 2025 presents a highly concentrated situation: crypto-native platforms (represented by Deribit) continue to dominate non-ETF varieties like ETH, while traditional financial platforms (represented by IBIT) have gained ground in BTC options, marginalizing the roles of other players under the dual oligopoly structure they have built. Notably, in the ETH options space, since there are no similar spot ETF options products like IBIT, Deribit remains almost the sole center of liquidity for ETH options, with its market share exceeding 90%. This means that Deribit's dominance in the ETH options market remained solid in 2025, while IBIT's impact was primarily felt in the BTC domain. Looking ahead, as ETH spot ETF options are approved for issuance in April 2025, it is possible that ETH ETF options will also be launched subsequently and gradually participate in the competition. However, as of November 2025, the ETH options market is still dominated by crypto-native exchanges, with no traditional institutional-level competitors like IBIT emerging.
DeFi
PerpDEX
2025 was an exceptionally brilliant year for PerpDEX. The entire market experienced explosive growth in trading activity, continuously breaking historical records. Monthly trading volume exceeded $1.2 trillion for the first time in October, with the cumulative on-chain derivatives trading volume reaching several trillion dollars for the year. The surge in trading volume and its increasing share were driven by multiple factors, including performance breakthroughs, rising user demand, and changes in the regulatory environment. Retail investors, institutional trading departments, and venture capital funds all turned their attention to this thriving sector in 2025.

Hyperliquid emerged as the undisputed leader in the PerpDEX market in 2025. In the first half of the year, the platform dominated the entire sector, with market share reaching as high as 70-80%. In May, Hyperliquid's on-chain perpetual contract trading volume peaked at approximately 71%. This astonishing volume made Hyperliquid almost synonymous with the PerpDEX market in the first half of 2025.
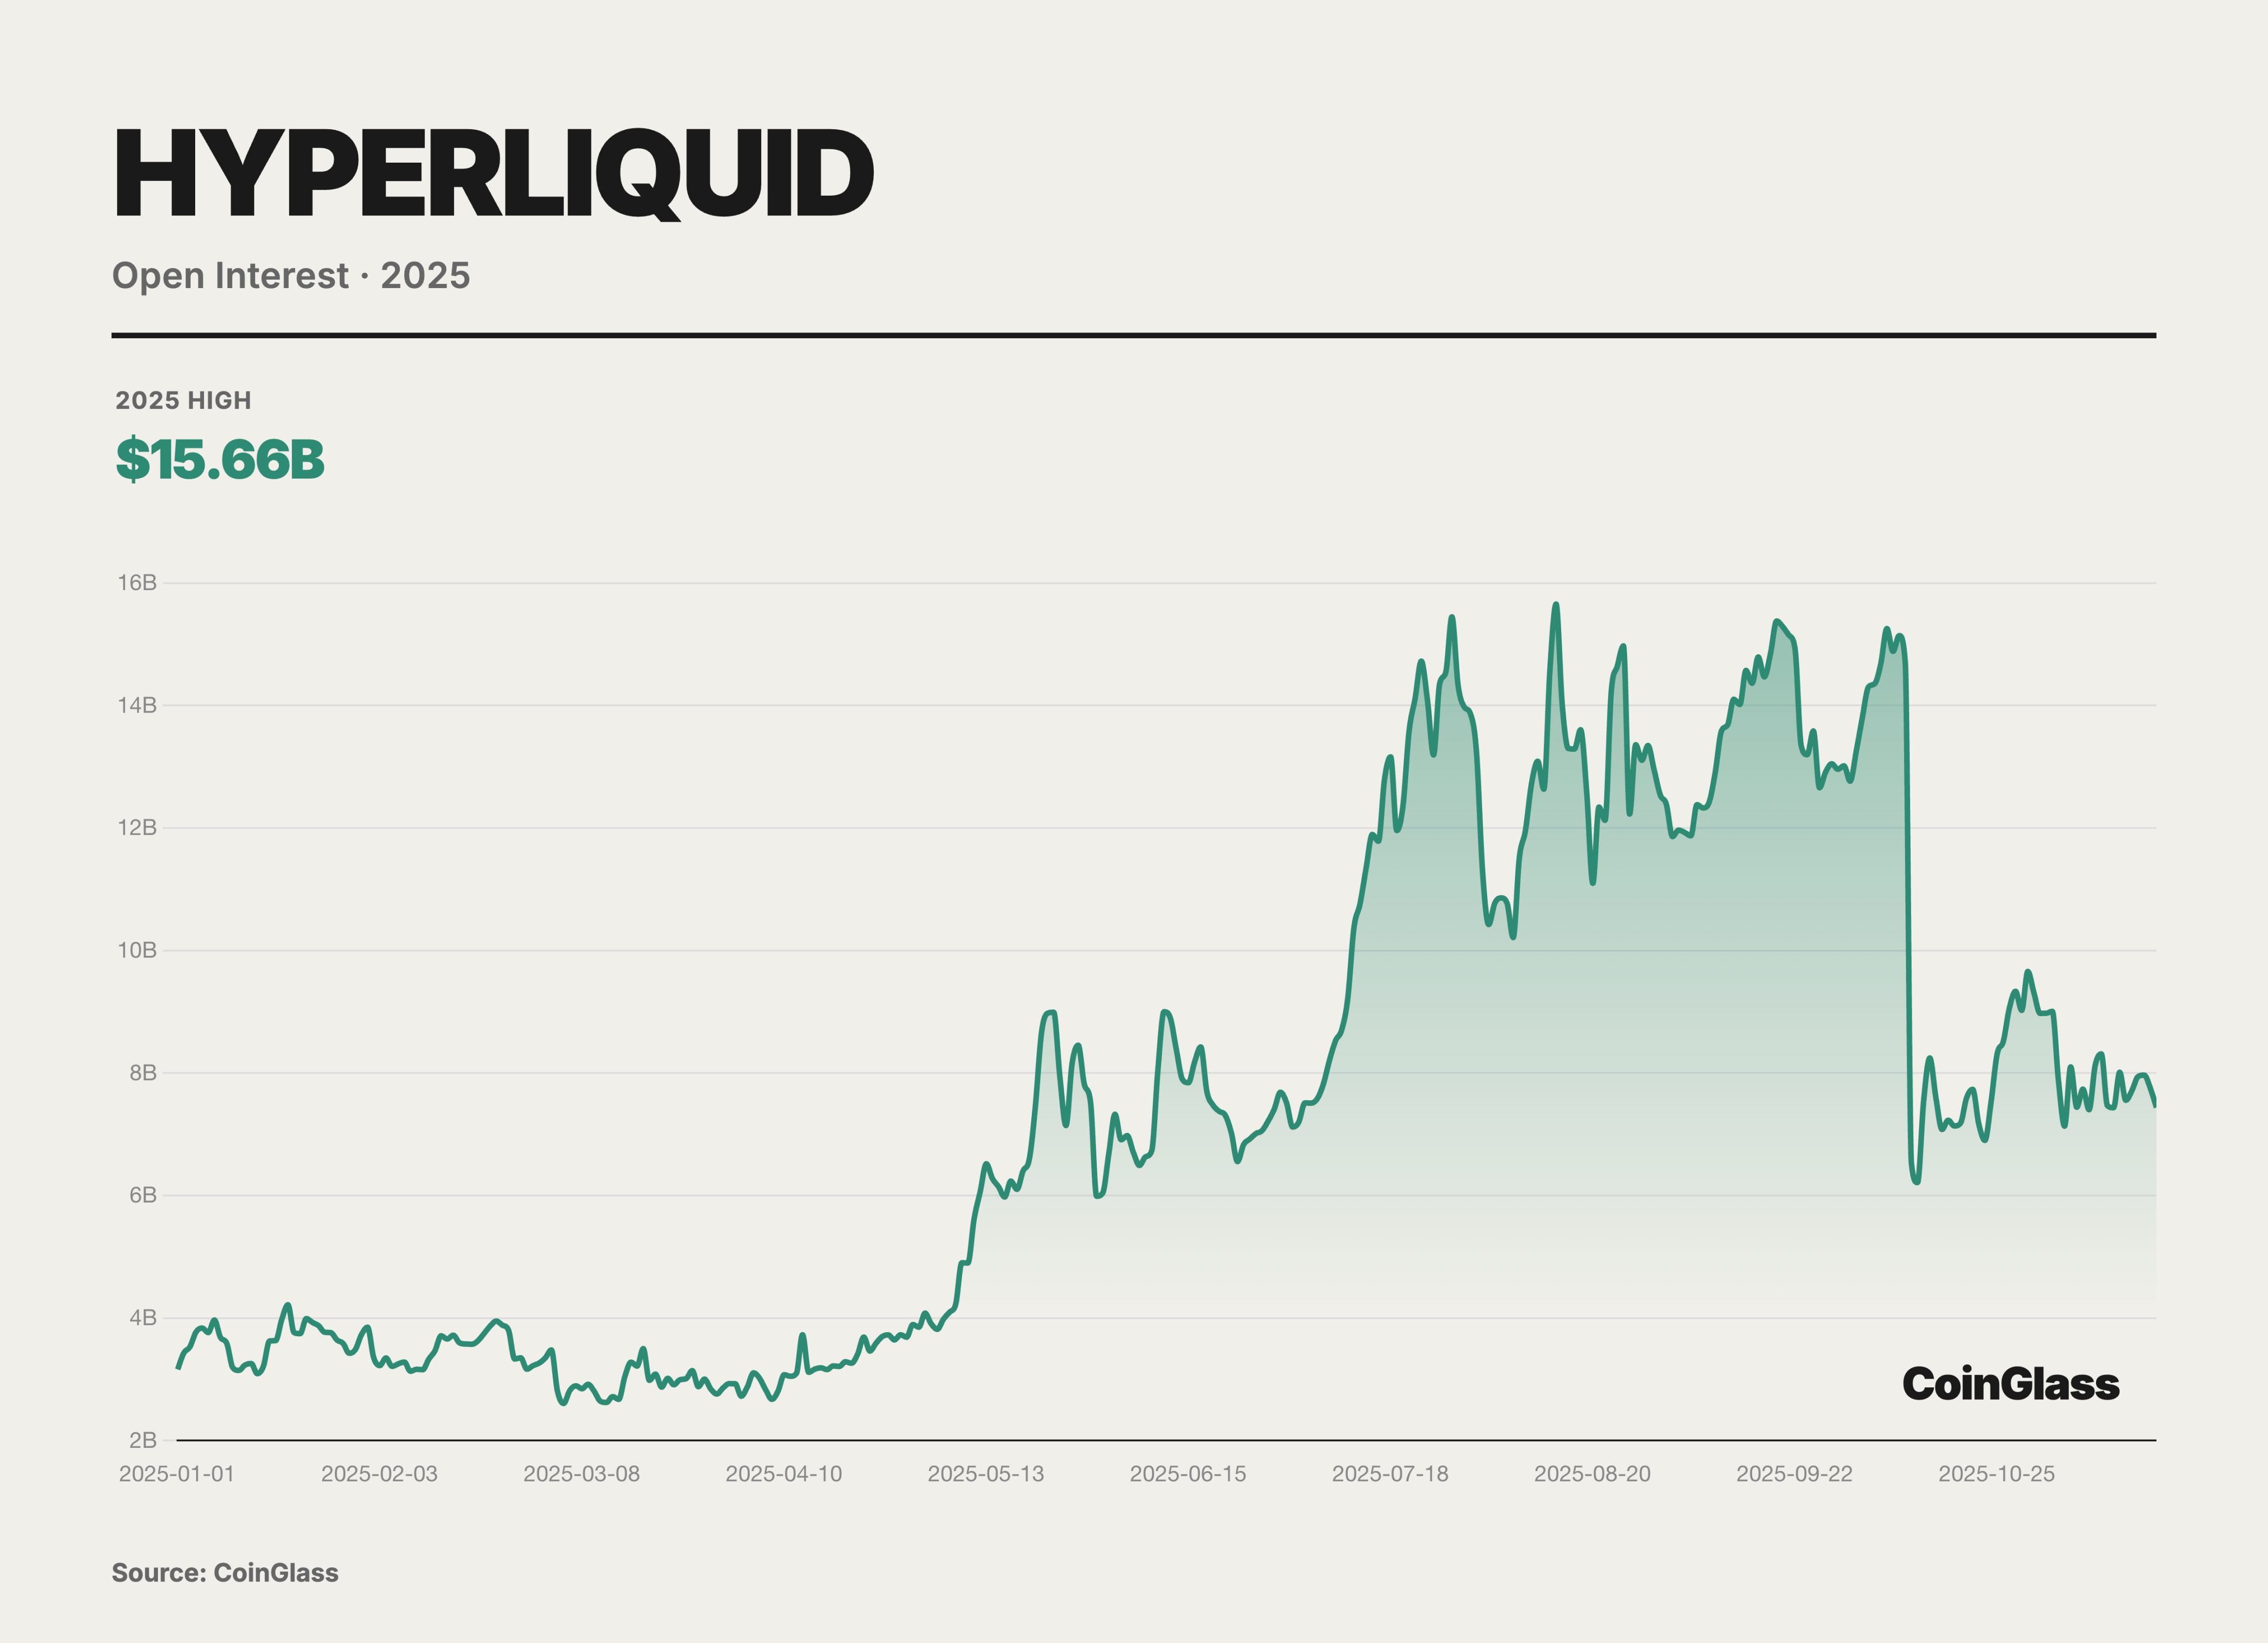
Hyperliquid not only attracted massive trading volume but also accumulated a substantial open interest in contracts. Data from October 2025 indicated that its perpetual contract open interest value reached $15 billion, accounting for about 63% of the total open interest on major decentralized perpetual platforms. This metric indicates that a significant amount of capital chose to remain long-term on Hyperliquid, reflecting traders' high trust in the platform's liquidity and stability.
Unlike traditional ETH L1 or general-purpose public chains, Hyperliquid built a custom Layer 1 blockchain specifically for high-frequency derivatives trading. This chain employs a self-developed HyperBFT consensus mechanism, capable of supporting 200,000 orders per second, with transaction confirmation delays as low as 0.2 seconds. This performance even surpasses many centralized exchanges, making Hyperliquid the first exchange to achieve speeds and liquidity close to that of CEXs on-chain. The platform uses a fully on-chain order book (Central Limit Order Book) model, ensuring depth and quote quality, allowing professional traders to enjoy a matching experience comparable to traditional exchanges.
Although Hyperliquid dominated in the first half of 2025, the market landscape shifted from a single leader to multiple strong players with the strong entry of new participants in the second half. Entering the third and fourth quarters, Hyperliquid's market share saw a significant decline—from around 70-80% at mid-year to 30-40% by year-end. According to on-chain data, Hyperliquid's trading volume share dropped to about 20% in November, while new stars like Lighter and Aster rapidly rose: Lighter accounted for approximately 27.7%, Aster for 19.3%, and another dark horse, EdgeX, reached 14.6%. This indicates that the market, once dominated by Hyperliquid, evolved into a competitive landscape with multiple strong players in just a few months. High trading incentives, differentiated product strategies, and capital support drove the rise of these challengers, pushing the competition in the entire PerpDEX field into a heated phase in the second half of 2025.
Prediction Market

The crypto prediction market experienced explosive growth in 2025, with total trading volume from January to November reaching approximately $5.2 billion, significantly surpassing the peak levels during the 2024 U.S. elections.
As the largest prediction market platform by trading volume globally, Polymarket's cumulative trading volume in 2025 exceeded $2.3 billion. The platform's daily active users approached 60,000, nearly tripling since the beginning of the year; monthly active user peaks are estimated to have exceeded 450,000, indicating a significant increase in public participation. Currently, the total number of registered trading users on the Polymarket platform is about 1.35 million, reflecting the rapid expansion of its user base over the past year. The large user group and abundant liquidity allowed several popular markets to accumulate individual contract trading volumes in the hundreds of millions of dollars, with highly liquid markets capable of accommodating tens of millions of dollars in and out without severe slippage. In high liquidity, liquidatable, and clearly defined event scenarios, prediction market prices are often used as supplementary indicators. Reports indicate that during the U.S. elections in November 2024, Polymarket's daily trading volume reached nearly $400 million, accurately predicting the election results, in contrast to traditional polls that showed discrepancies. This example highlights the information aggregation capability and pricing accuracy of decentralized prediction markets during significant events, laying the groundwork for further mainstream adoption in 2025.
Web3 Wallet
Web3 wallets, as the first touchpoint connecting users to decentralized networks, experienced a fundamental leap in strategic importance in 2025. Wallets are no longer merely containers for private keys or simple transfer tools; they have evolved into on-chain traffic gateways that integrate digital identity (DID), asset management, decentralized application (DApp) operating systems, and social graphs.

Looking back over the past five years, the form of Web3 wallets has undergone dramatic evolution. Early wallets required users to have a high level of technical understanding, needing to manage mnemonic phrases, comprehend gas fee mechanisms, and manually configure networks. This high barrier led to a significant user drop-off rate; data shows that over 50% of users abandoned the wallet setup process due to its complexity. The most notable industry feature this year is the large-scale implementation of account abstraction and the standardization of chain abstraction technologies. The integration of these two technologies has enabled Web3 wallets to provide user experiences that can compete with Web2 financial applications for the first time. Complex private key management, obscure gas fee mechanisms, and fragmented multi-chain liquidity are being encapsulated by intelligent protocols in the background, reducing user friction to historical lows.
At the same time, the entry of institutional-level capital has forced upgrades to wallet security architectures, with the combination of multi-party computation (MPC) technology and trusted execution environments (TEE) becoming standard for leading wallets, fundamentally changing the fragile security model where the private key is everything.

In the competitive market landscape of 2025, the OKX Web3 wallet, with its combination of technological innovation and comprehensive ecosystem, leads the industry in usability and functional integration, being recognized as the comprehensive leader in the sector. As a super aggregator for Web3 entry, the OKX wallet boasts over 5 million monthly active users, with its core design philosophy focused on encapsulating complex on-chain logic behind a minimalist interface. Through a unified dashboard, users can easily manage assets spread across more than 100 public chains without needing to manually add contracts.
Additionally, the OKX Web3 wallet is one of the first products in the industry to deeply integrate DEX aggregators. While many other wallets still support only single-chain swap functions, the OKX wallet has already integrated multi-chain trading within the wallet itself. Its built-in OKX DEX aggregator covers over 100 public chains, automatically finding the best trading paths for users through smart routing. After initiating a swap request within the wallet, the aggregator simultaneously calls multiple DEX quotes and splits the routing to ensure execution at the best price with the lowest slippage.
In addition to long-standing industry-leading wallets like OKX Wallet, 2025 also saw the rise of many newcomers, such as Binance Wallet. The core of Binance Wallet's emergence in 2025 lies in the growth strategy of Binance Alpha: embedding early project discovery and trading directly into the wallet, allowing users to participate in early projects, airdrops, and TGEs through a path close to centralized products. The official positioning of Alpha is closer to "a discovery and screening pool for pre-listing projects," enhancing transparency and participation in the process, and converting on-chain participation into more frequent trading behaviors and retention through task-based and equity-based mechanisms. This Alpha-driven wallet growth is reflected very directly in the data.
In 2025, Bitget Wallet bet on PayFi, bridging on-chain finance and real-world consumption, and promoting Wallet Card. Gasfree's GetGas covers multi-chain gas payments and supports Google/Apple/email social logins. It natively integrates RWA like Ondo, allowing for trading tokenized U.S. stocks, while also providing QR code and card payments, as well as stablecoin finance Plus, targeting the Everyday finance app.
Summary
The main storyline of the crypto derivatives market in 2025 is a re-pricing shift from high-leverage retail speculation to the parallel evolution of institutional capital, compliant infrastructure, and on-chain technology. Macro liquidity determines trends, with crypto amplifying volatility in high Beta during interest rate cut expectations and risk preference switches, while geopolitical and policy factors provide triggers; throughout the year, the deleveraging phase saw an external shock in October combined with crowded leverage in the third quarter, causing the total open interest across the network to retract over $70 billion from its peak within two days and resulting in a peak of over $10 billion in liquidations.
Under the approximately $85.7 trillion trading volume on the CEX side for the year, open interest, depth, and custody have highly concentrated towards the leading platforms. These top platforms enhance price discovery and execution efficiency, while also amplifying compliance, operational, and technical events into systemic risks. In a declining inventory and thinning order book, this centralization simultaneously magnifies the marginal thrust during upward movements and creates liquidity vacuums during downturns. Extreme liquidations expose the fragility of the margin—liquidation—insurance fund—ADL chain: when the insurance fund is under pressure and cross-platform transfers are congested, the non-transparent execution of ADL and deviation from market prices in reducing positions can dismantle hedging legs, causing neutral positions to passively turn into directional risks. Risk control needs to redo stress testing around the liquidation mechanism and fund accessibility. Institutionalization is more concentrated in on-exchange derivatives and DAT: CME has introduced compliant innovations such as spot quoting futures, promoting the normalization of basis trading, connecting ETF spot demand with futures hedging into a replicable arbitrage chain; DAT has formed a balance sheet-type configuration/funding flywheel driven by accounting and financing tools, with buying pressure becoming more "locked in," but the risk focus has shifted from coin prices to financing structures, corporate governance, and regulatory impacts. The pricing power in the options market is also migrating, with the merger and integration of compliant exchanges and the rise of ETF options concentrating BTC volatility flow towards traditional financial channels.
On the DeFi side, PerpDEX relies on high-performance application chains and intent-centric architecture to approach CEX experiences and move towards a multi-strong competition, while the account/chain abstraction of prediction markets and wallets shifts discovery, trading, and distribution to the application layer.
In summary, the current derivatives market presents distinct structural opportunities and asymmetric risks: opportunities mainly exist in the low-risk basis arbitrage space emerging from the integration of compliant spot and derivatives tools (such as ETF options), as well as the functional replacement of traditional centralized liquidity by high-performance on-chain infrastructure (PerpDEX); while risks are highly concentrated in the potential dual kill of equity and coin prices triggered by reversals in DAT sector financing logic, and the systemic risk of liquidation due to mismatched liquidity in the highly concentrated CEX clearing system. Looking ahead to 2026, as the global regulatory framework accelerates convergence and the liquidity environment potentially shifts, the core competitiveness of the market will focus on whether trading infrastructure can maintain clearing resilience within extremely crowded leverage chains, and whether capital can find the most efficient flow paths between compliance and decentralization.
免责声明:本文章仅代表作者个人观点,不代表本平台的立场和观点。本文章仅供信息分享,不构成对任何人的任何投资建议。用户与作者之间的任何争议,与本平台无关。如网页中刊载的文章或图片涉及侵权,请提供相关的权利证明和身份证明发送邮件到support@aicoin.com,本平台相关工作人员将会进行核查。


