A few days ago, I was out and did not update in time. After this week's weekly K update, the K-line once again shows a multi-empty arrangement and fluctuates. The MACD and KDJ indicators exhibit a divergent sentiment, while the MA5 and 10-day moving averages and the BOLL band overall trend still lean towards divergence, indicating that the bears are in a dominant position. The 90,000 mark is a dividing line between bulls and bears in the short term. Only if the weekly K can stabilize is there hope for a reversal; otherwise, if Bitcoin cannot hold the 90,000 mark before the end of the month, it is expected that the price will test the bottom support of 84,000-80,000 again.
On the daily line, yesterday's K-line formed a doji with an upper shadow that quickly faced pressure after reaching above the middle track of the BOLL band. The MA5 and 10-day moving averages are currently diverging, and the overall BOLL band continues to press down towards the MA30-day moving average, indicating that there is strong resistance to a short-term rebound. Therefore, from a short-term daily perspective, the price cannot break through the middle track resistance and should be viewed as maintaining a high short position.
On the 4-hour line, due to the high opening and low closing during the day, the current price is running near the lower track of the BOLL band. The MACD and KDJ show a divergent sentiment, while the MA5 and 10-day moving averages tend to fluctuate and decline. Additionally, the TD indicator has reached a downward TD6, suggesting that the price will first decline and then initiate a rebound trend in the evening and early morning. The high point resistance is referenced around 88,300-89,000, and the low point support is around 84,500-84,000. Therefore, regarding the early morning trend, my personal view is to maintain a short-term wave, focusing on the rebound high while supporting the low.
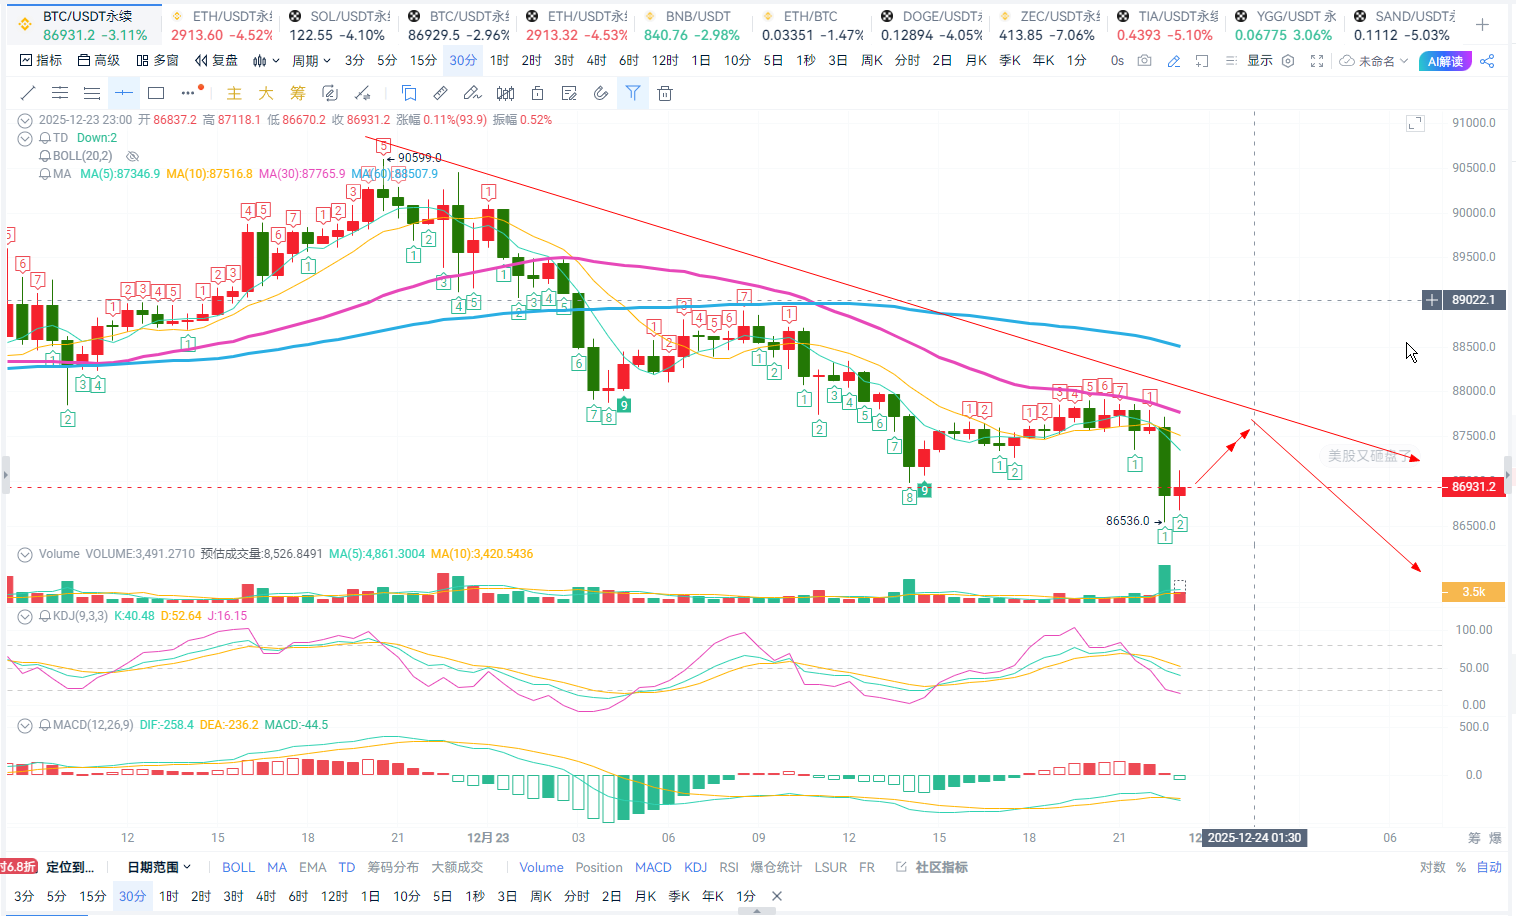
Operation strategy: Around 87,500-88,000 for short positions. Target: 86,000-85,000. Stop loss: 88,500. Long positions are referenced near the support level.
The short-term trend of Ethereum is basically synchronized with Bitcoin, with overall liquidity and trend being much weaker. The current high point resistance is referenced around 2,970-3,000. If it cannot stabilize effectively, there is not much rebound space for the price. The low point support is referenced around 2,870-2,830. Therefore, regarding the early morning trend, my personal view is still to maintain a short-term wave, focusing on the rebound high while supporting the low.
Operation strategy: Short positions at 2,950-2,980. Target: 2,900-2,850. Stop loss: 3,015.
Long position reference at the 2,850 level.
For the current trend, it is expected to be sufficient, and I will continue to follow up.
My personal views are for reference only. There may be delays in article review and push notifications, and the market changes rapidly. Specific entry and exit points should be based on real-time guidance. Please be cautious when entering the market. Analysis is not easy; everyone is welcome to like and follow the public account for surprises!

免责声明:本文章仅代表作者个人观点,不代表本平台的立场和观点。本文章仅供信息分享,不构成对任何人的任何投资建议。用户与作者之间的任何争议,与本平台无关。如网页中刊载的文章或图片涉及侵权,请提供相关的权利证明和身份证明发送邮件到support@aicoin.com,本平台相关工作人员将会进行核查。