The Hidden Tendencies of Bitcoin: Why the Pain of 2025 Will Focus on the Bottom of 2026
Author: Bitcoin Magazine Pro
Translation: Baihua Blockchain

Despite the promising price performance in 2025, Bitcoin still possesses considerable macroeconomic tailwinds as it enters 2026. While the upcoming year remains fraught with uncertainty, specific indicators suggest that the worst selling phase may have already passed. The capitulation of long-term holders has reached historically extreme levels, and on-chain metrics indicate a potential stabilization in early 2026.
2025 Review
While Bitcoin achieved a historic new high in USD terms in 2025, it actually peaked in December 2024 when measured against gold (which better represents real purchasing power), after which it declined by over 50%. This divergence explains why many investors felt psychological pain despite record nominal prices. This year was characterized by extreme whale activity, with the long-term holder "whale shadow" indicator reaching historical highs, indicating that a large amount of Bitcoin from long-term holders is flowing into the market.
 Figure 1: In 2025, an astonishing number of significant long-term holders transferred BTC.
The implication is that long-term holders released approximately 7 to 8 million Bitcoins during 2025, while corporate treasuries and ETF cumulative inflows totaled only about 2 million. This means that about 75% of what appears to be bearish is, in fact, a significant bullish signal: this chip distribution represents a shift from "early adopters who bought at extreme lows" to "recent long-term holders," who are more resistant to rapid relief or panic selling.
 Figure 2: Since the cycle began, Bitcoin ETF holdings have decreased by less than 5%.
This extreme level of long-term holder selling, combined with Bitcoin's price psychology and the fact that ETFs have only sold about 4-5% of their holdings in a liquid environment, indicates that the fundamental demand structure remains solid. In any previous bull market context, a 35% pullback from historical highs would be considered a standard bull market correction.
Macroeconomic Indicators
The federal funds target rate continues to decline amid expectations of further market rate cuts. The 2-year U.S. Treasury yield is indeed lower than implied rate expectations, and Federal Reserve Chairman Powell may be replaced by a more aggressive and crypto-friendly candidate, representing a significant policy shift. Quantitative tightening (QT) ended on December 1, 2025, marking the third time in Bitcoin's history that QT has stopped. The previous two instances occurred in 2010, 2012, and 2019, all of which saw significant Bitcoin increases (although the 2019 surge was preceded by the COVID-19 crisis).
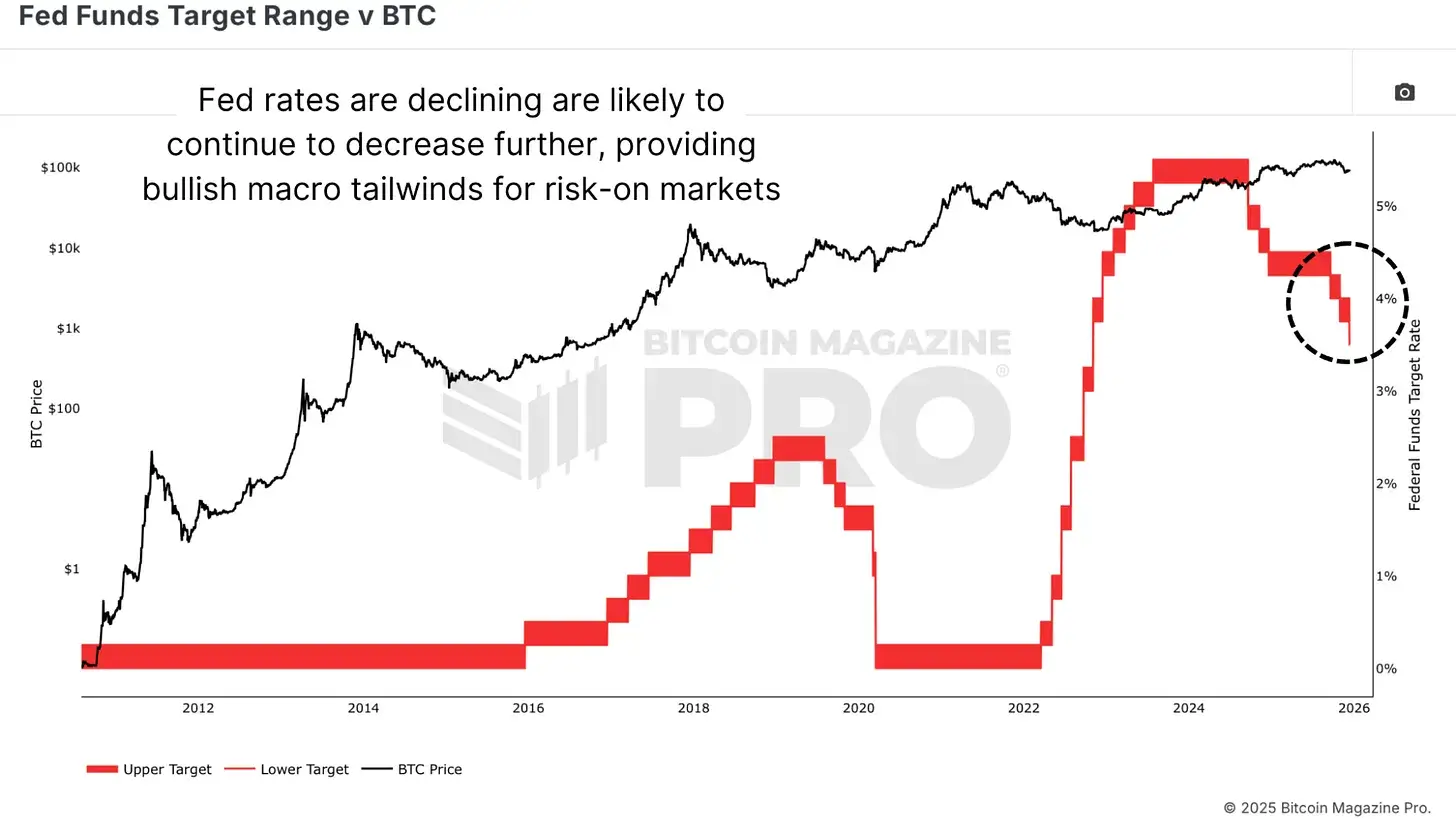 Figure 3: The decline in the federal funds target rate may reignite demand for risk markets.
Global Liquidity Signals
The global M2 money supply, calculated with a 100-day offset, has historically provided nearly perfect predictions for Bitcoin prices. This indicator peaked near the October 2025 Bitcoin market cycle edge and has now begun to expand again, pointing to a potential bottom forming in early 2026.
 Figure 4: The offset global M2 money supply's correlation suggests a recovery in Bitcoin market share starting in early 2026.
2026 Probability-Weighted Scenario Forecasts
A clear main scenario emerges for 2026:
Bearish Scenario (25% probability): Further capitulation could push Bitcoin to the 15.44 Fibonacci retracement level, corresponding to a current valuation of about $66,000. If gold also retraces, prices could fall further to $60,000 or lower. This scenario may involve severe risk aversion, potential correlations, or significant black swan events.
Baseline Scenario (50% probability): Before stabilizing and rebounding at the end of 2025 or early 2026, there may be a further dip to $70,000–$75,000 in the short term. Additionally, Bitcoin could rebound to $100,000 and the 365-day moving average, potentially reaching the peak of the 2021 bull market when priced in gold. This scenario reflects a "mild bear market" that aligns with the UAE's "flat bull market," ending 2026 with moderate gains.
Bullish Scenario (25% probability): Bitcoin could accelerate towards the target of 52.55 ounces of gold, potentially exceeding $200,000 in USD terms (higher if gold prices rise). This would require significant liquidity injections and a shift of funds from other risk assets to Bitcoin.
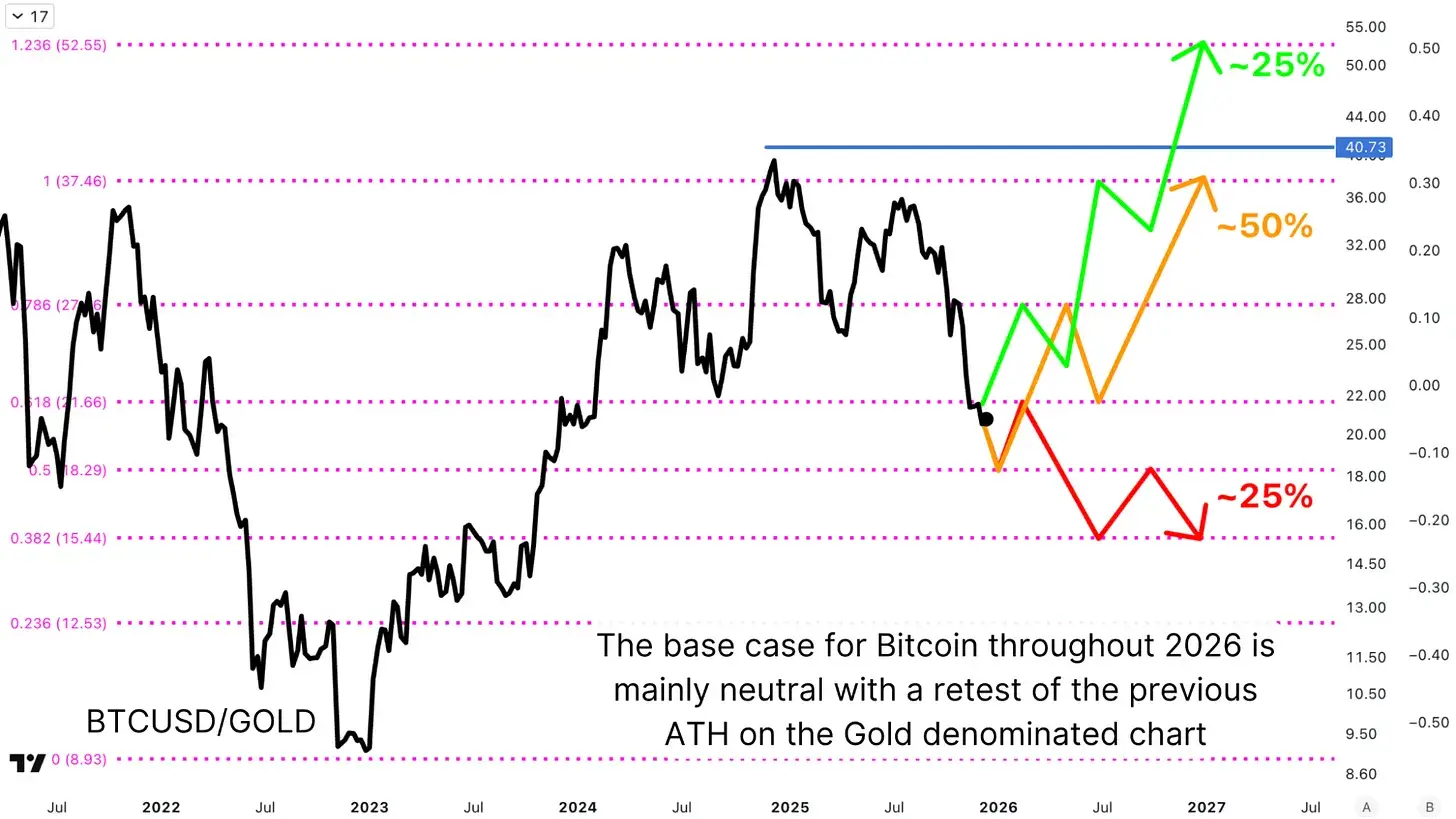 Figure 5: Using clearly weighted probability scenarios to forecast Bitcoin price trends in 2026.
Conclusion
Bitcoin's performance in 2025 was lackluster (despite new highs in USD), and it should be positioned within a long-term trend. The large-scale transfer of 7 to 8 million Bitcoins from early investors to more committed recent investors, combined with historic whale and long-term holder capitulation, represents the structural maturation of the Bitcoin market. The recognition by institutional investors, corporate treasuries, and ETFs indicates that Bitcoin is transitioning from extreme cycles to more normalized price volatility.
Although 2026 inherently remains uncertain, current data suggests that the worst price actions for Bitcoin may be behind us. Macroeconomic tailwinds, including potential rate cuts, the end of QT, and pressures from currency depreciation, create structurally favorable conditions. The historic capitulation of long-term holders, retail absorption of financing codes, and the steadfast belief in ETFs all indicate that the market has digested expectations of significant declines.
Article link: https://www.hellobtc.com/kp/du/12/6169.html
Source: https://bmpro.substack.com/p/bitcoins-2026-data-driven-outlook
免责声明:本文章仅代表作者个人观点,不代表本平台的立场和观点。本文章仅供信息分享,不构成对任何人的任何投资建议。用户与作者之间的任何争议,与本平台无关。如网页中刊载的文章或图片涉及侵权,请提供相关的权利证明和身份证明发送邮件到support@aicoin.com,本平台相关工作人员将会进行核查。


