By the end of 2025, the cryptocurrency market is at a critical juncture. Bitcoin (BTC) hovers around $90,000, the Fear & Greed Index has dropped to 25 (extreme fear), and the capitulation of short-term holders has reached its second-highest historical point, only behind the bottom of the 2024 yen arbitrage collapse. The FOMC meeting on December 10 has concluded, with the Federal Reserve (Fed) lowering interest rates by 25 basis points as expected, bringing the federal funds rate down to 3.50%-3.75%. However, the forward guidance has turned hawkish—only one rate cut is expected in 2026. This led to BTC briefly falling below the $90,000 mark, with the market reacting tepidly, resulting in a "buy the expectation, sell the fact" pullback.
However, the Fed simultaneously launched the "Reserve Management Purchase" (RMP) program, injecting $40 billion in short-term Treasury liquidity each month, which is seen as a mild easing signal that is "non-QE" and may reshape market dynamics in 2026. In this "year-end exam," should one "hold coins for the holiday" in anticipation of a potential rebound, or "cash out" to lock in profits? This article explores allocation strategies and looks ahead to 2026 by combining the impact of the FOMC, on-chain data, institutional movements, and historical patterns.
Interpretation of the FOMC Decision
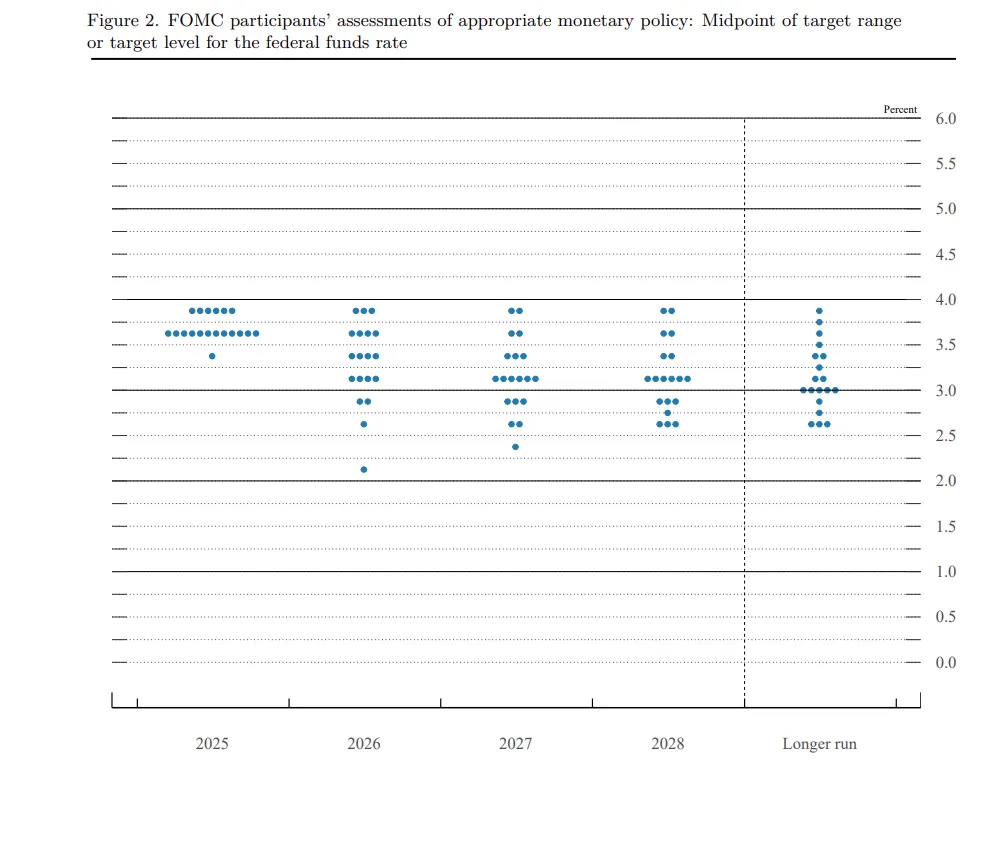
The liquidity turning point under hawkish rate cuts: The FOMC meeting is the last monetary policy decision of 2025, with a 9:3 split in favor of the rate cut. However, the "dot plot" indicates a slowdown in the rate cut path for 2026, with only one remaining 25 basis point space.
This reinforces the narrative of "hawkish rate cuts": the Fed is concerned about inflation rebounding and a soft landing in the job market, unwilling to overly ease in the short term. The market has priced in an 89% probability of a rate cut, leading to only slight fluctuations in BTC after the event, while ETH consolidated around $3,000.
Dual impact on crypto:
- Short-term pressure: The hawkish guidance exacerbates risk aversion, with BTC not rebounding to the expected $94,000 high, instead triggering billions of dollars in leveraged liquidations. Year-end liquidity is thin (with perpetual contract positions down 40%-50% from October), compounded by the Bank of Japan's (BOJ) decisions, making the market prone to "pump and dump" scenarios.
- Long-term benefits: QT (quantitative tightening) officially ended on December 1, with the Fed's balance sheet starting to recover from $9 trillion to $6.5 trillion. The RMP program is equivalent to "invisible QE," expected to inject trillions of dollars in liquidity in 2026, driving a revaluation of risk assets. Historical data shows that liquidity turning points often trigger crypto rebounds (e.g., BTC surged after the Fed's pivot in 2024). Additionally, the explosive growth of global M2 money supply, a weakening DXY dollar index, and stimulus policies from China/EU will further tilt funds towards risk assets.
The FOMC has reinforced the "macro-dominant" narrative, with crypto no longer solely driven by cycles but linked to stocks/AI assets. Short-term volatility is heightened, but liquidity injections pave the way for 2026.
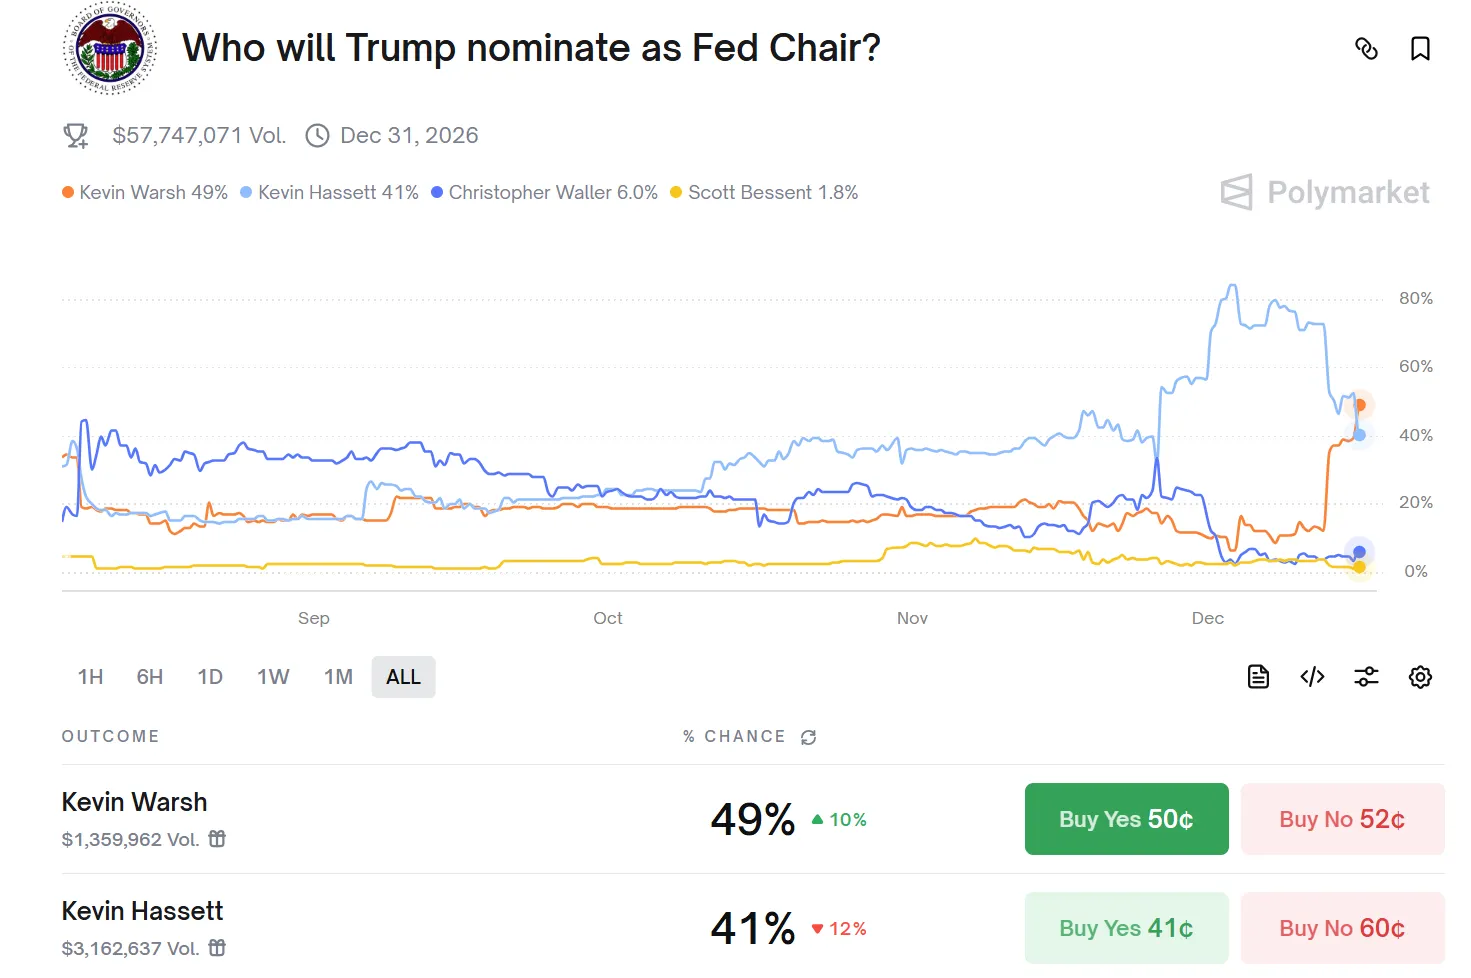
The appointment of a new Fed chair will also be a key variable in the liquidity environment of 2026. Jerome Powell's term as chair will officially end in May 2026 (his term as a governor lasts until January 2028). President Trump has indicated he will announce his successor's nomination in early 2026, with current popular candidates focusing on "two Kevins": Kevin Hassett, director of the National Economic Council (advocating for more aggressive rate cuts), and former Fed governor Kevin Warsh (who recently visited the White House, emphasizing consulting the president on interest rate views).
A chair who is more pro-Trump and leans towards easing policies may strengthen the rate cut path in 2026 and accelerate liquidity injections, resonating with policies like the RMP program and national Bitcoin reserves, further boosting confidence in risk assets.
Institutional Trends: 2026 Layout—From "Defensive" to "Structural Participation"
2025 is seen as the "year of crypto mainstreaming," with institutional entry no longer a marginal experiment but a systematic transformation. According to a16z's "2025 Crypto State Report," traditional financial institutions like Visa, BlackRock, Fidelity, and JPMorgan Chase have fully launched crypto products, while tech-native players like PayPal and Stripe are doubling down on payment infrastructure.
This marks a shift from a "retail-led" to an "institution-led" paradigm: A joint survey by EY-Parthenon and Coinbase shows that 83% of institutional investors plan to expand their crypto allocations in 2025, with DeFi exposure expected to jump from 24% to 75%, focusing on derivatives, lending, and yield opportunities.
Institutional Allocation Trends: From BTC Single Allocation to Multi-Asset Portfolios
- BTC remains core, but its proportion is declining: BTC continues to dominate institutional positions as "digital gold" (ETF AUM has exceeded $168 billion, accounting for 60-80% of institutional crypto exposure), but institutions view it as a low-correlation diversification tool rather than a single speculative asset.
- Expanding into ETH, Altcoins, and Emerging Assets: Institutions are increasing their allocations to ETH (attractive staking yields), Solana (high TPS and institutional partnerships), stablecoins (payment infrastructure), and RWA (real-world asset tokenization). A Coinbase report indicates that 76% of institutions plan to invest in tokenized assets in 2026, focusing on tokenized Treasuries, private equity, and bonds, providing instant settlement and fractional ownership.
- Pension funds and sovereign wealth funds are testing the waters: While many have indirect exposure (e.g., the Norwegian fund holding BTC through MicroStrategy), more direct allocations of 0.5-3% are expected in 2026 (via ETFs or tokenized tools). Reports from BlackRock and others indicate that sovereign funds and pension funds are viewing crypto as a long-term diversification hedge, with increasing allocation ratios.
Historical Patterns: BTC's Year-End "Spring Festival Effect"

Drivers of the "Christmas Low - Spring Festival Rebound" Model
Western liquidity exhaustion: From December 20 to early January, European and American institutions enter holiday mode, leading to a sharp drop in trading volume. In a low liquidity environment, any selling pressure amplifies volatility, creating a technical low.
Asian capital inflow: Around the Spring Festival (from late January to mid-February), year-end bonuses and red envelopes are distributed in mainland China, Hong Kong, and Singapore, leading retail and high-net-worth individuals to increase their allocation to risk assets. Historical data shows that in the two weeks before the Lunar New Year, BTC buying volume on Asian exchanges (like Binance and OKX) typically rises.
Institutional rebalancing: January marks the start of the new fiscal year for institutions, with pension funds and hedge funds reassessing asset allocations. If BTC performs relatively well in December (e.g., only pulling back 5-10% in 2025), institutions tend to increase their positions in January to catch up with benchmark returns.
On-Chain Data: Frequent Appearance of Bottom Signals
After the hawkish rate cut from the FOMC, the crypto market has entered a typical "year-end low liquidity" phase, with Bitcoin (BTC) fluctuating repeatedly in the $88,000-$92,000 range, and the Fear & Greed Index dropping to 25 (extreme fear). On the surface, this appears to be a "sell the fact" pullback. However, on-chain data reveals more structural signals: deep capitulation of short-term holders, continued accumulation by long-term holders, accelerated outflows from exchanges, and bottom characteristics in medium- to long-term indicators. These data suggest that the current situation is not a simple bear market but rather a "mid-term adjustment + washout" phase within a bull market cycle.
1. Short-Term Holder (STH) Capitulation: Pain Nearing Its End
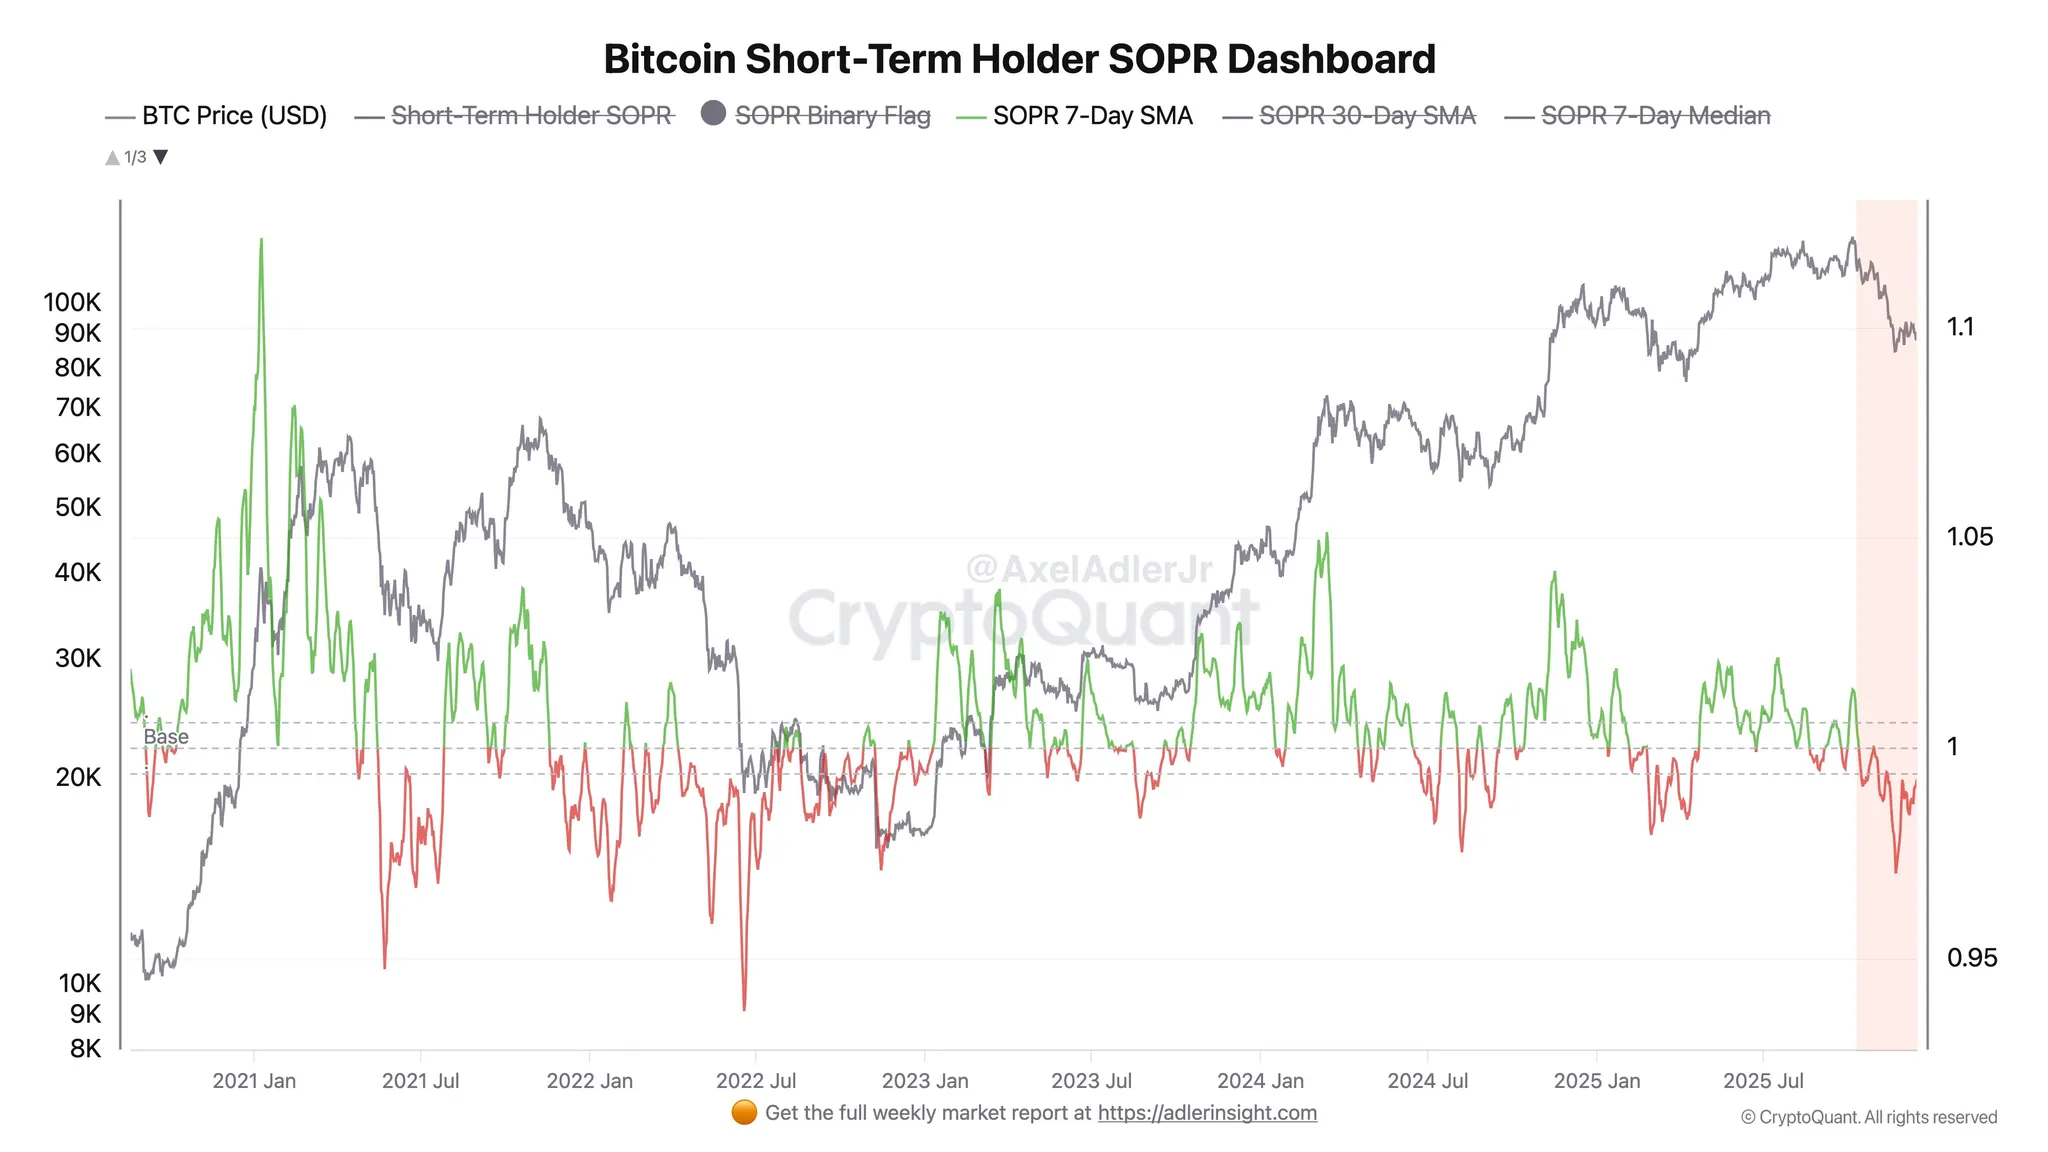
- Realized loss scale: In the past 30 days, short-term holders (holding for 155 days) have realized losses exceeding $4.5 billion, second only to the $5.2 billion during the yen arbitrage collapse in August 2024 (Glassnode data). This indicates that leveraged players and chasing retail investors have largely capitulated.
- SOPR indicator: The short-term holder SOPR (Spent Output Profit Ratio) has remained below 1 (average selling at a loss) for over three weeks, and historical data shows that after such deep capitulation, BTC often finds a phase bottom within 1-3 months.
2. Exchange Reserves and Withdrawals: Strengthening Trend of Fund Disintermediation
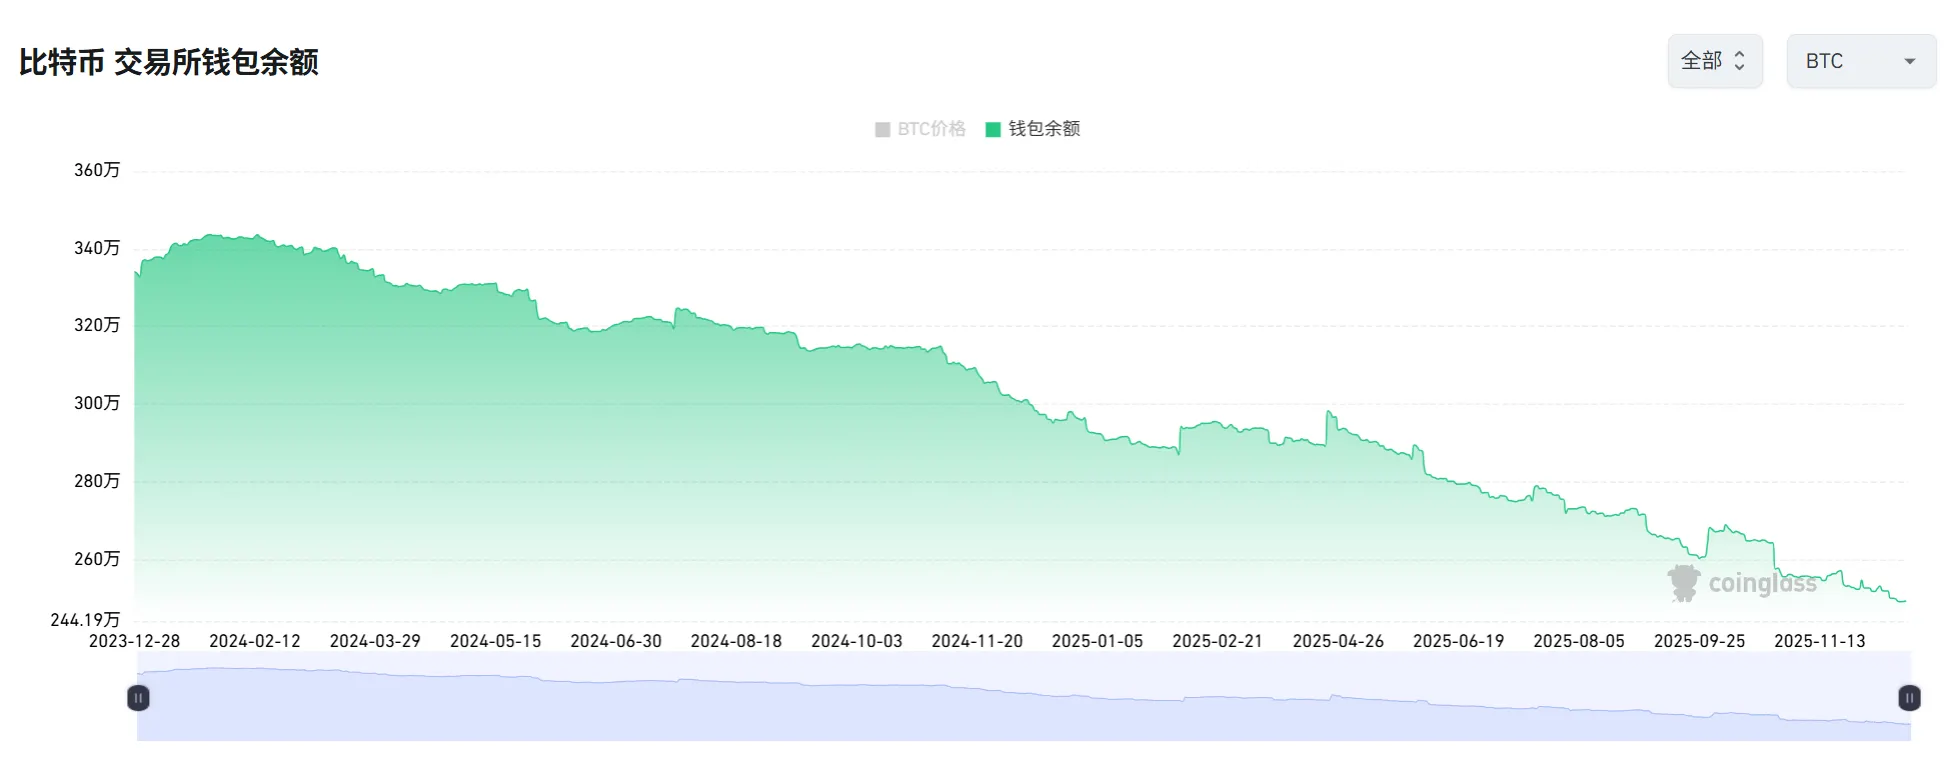
- Exchange BTC balance: In the past 30 days, the total exchange BTC reserves have decreased by about 120,000 BTC (approximately 2.5%), falling below 2.6 million BTC (CryptoQuant), marking the lowest level since 2018.
- ETH exchange reserves: During the same period, approximately 1.2 million ETH were withdrawn, with withdrawal speeds reaching a new high for 2025, reflecting strong demand for staking and self-custody.
- Stablecoin reserves: Although the exchange USDT/USDC balances have seasonal declines, the number of active addresses and transaction volumes on-chain remain stable, indicating that funds have not exited the market but have shifted to cold storage in anticipation of re-entry.
Funds flowing out of exchanges typically signal a price bottom, reducing selling pressure while building momentum for subsequent rebounds.
3. Medium- to Long-Term Indicators: Frequent Bottom Signals
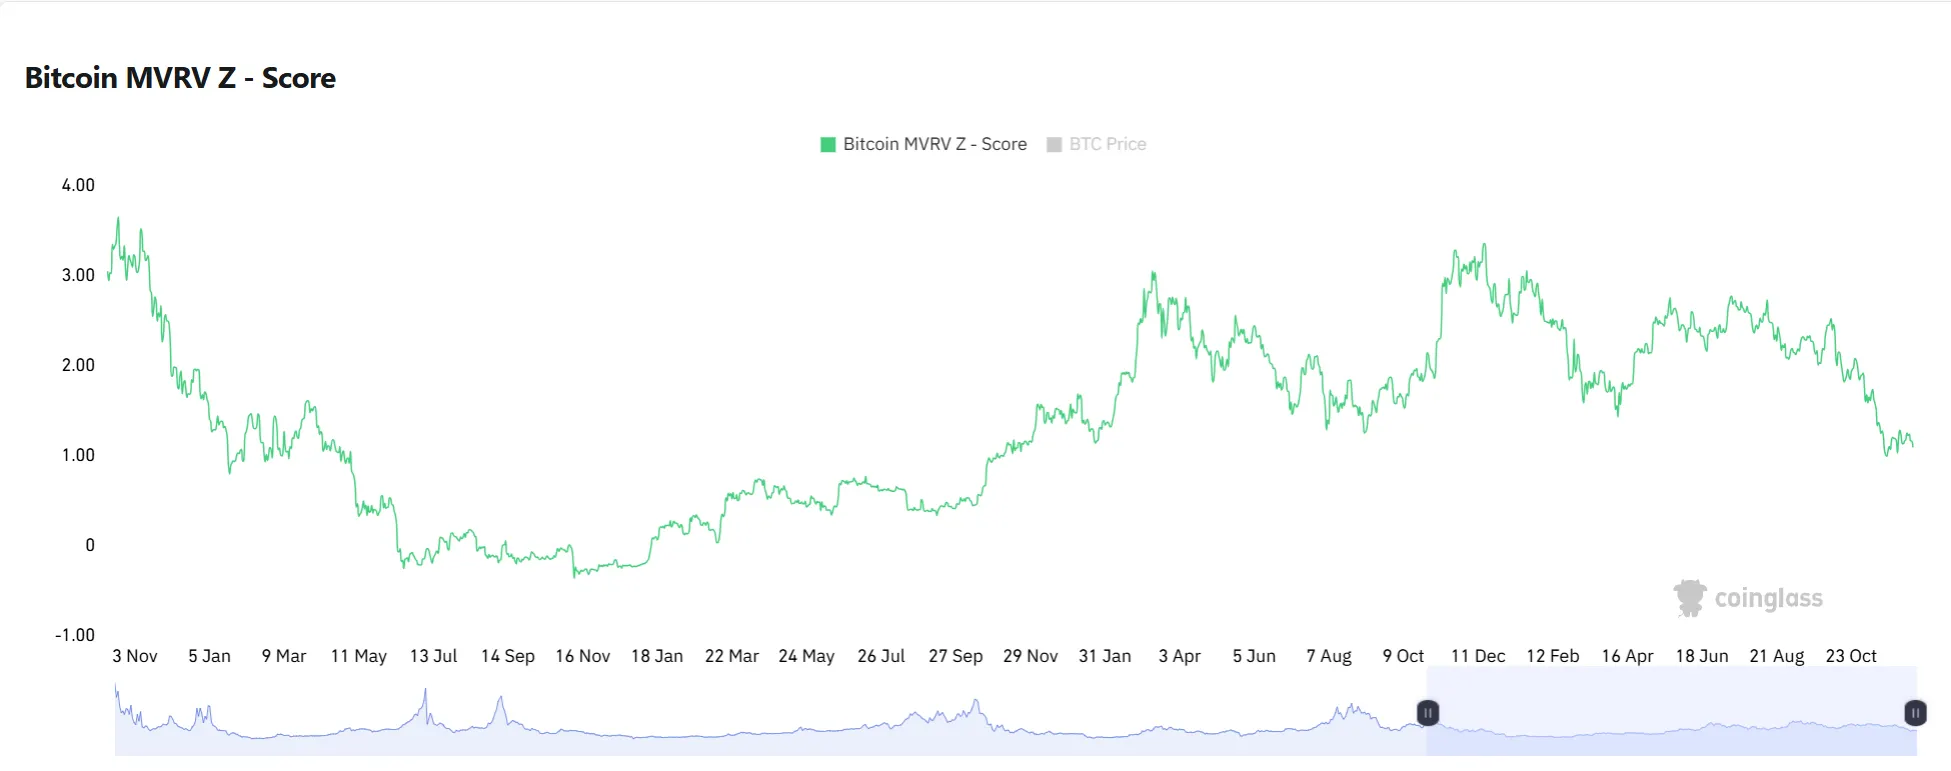
- MVRV Z-Score: Currently at 1.1, entering the historical "green buy zone."
- RHODL Ratio: Has dropped to levels seen at the bottom of the 2022 bear market, indicating that market enthusiasm has completely cooled.
- Puell Multiple: The miner income indicator has fallen to 0.6, with historical lows often accompanying price reversals after mining capitulation.
- Active addresses and transaction volume: Although temporarily sluggish, the 30-day MA has not shown a cliff-like drop, unlike the "activity exhaustion" seen at the 2021 bull peak.
Allocation Strategy: Seeking Certainty Amid Uncertainty
The market is at a rare intersection:
- Short-term sentiment is extremely fearful (Fear & Greed Index 25), but on-chain data shows frequent appearances of bottom characteristics.
- The historical "Christmas low - Spring Festival rebound" pattern provides seasonal support, successfully validated three times in the past five years.
- Macro liquidity is about to shift (QT ending, RMP starting), but in the short term, it is still suppressed by hawkish guidance.
- The institutionalization process is accelerating, with the market structure transitioning from "speculation-driven" to "allocation-driven."
For long-term value-seeking investors, the current environment offers a relatively clear risk-return framework: the deep capitulation of short-term holders, accelerated outflows from exchanges, continued accumulation by long-term holders, and valuation indicators like MVRV and RHODL entering historical buy zones—these signals have marked the opening of medium- to long-term allocation windows every time they have appeared in the past. For traders focused on liquidity management, the liquidity exhaustion period in December presents both risks and opportunities. Maintaining sufficient flexibility, preserving ammunition during market panic, and acting in accordance with the Spring Festival effect may prove wiser than chasing short-term volatility.
This report's data is edited and organized by WolfDAO. For any questions, please contact us for updates.
Written by: Nikka / WolfDAO (X: @10xWolfdao)
免责声明:本文章仅代表作者个人观点,不代表本平台的立场和观点。本文章仅供信息分享,不构成对任何人的任何投资建议。用户与作者之间的任何争议,与本平台无关。如网页中刊载的文章或图片涉及侵权,请提供相关的权利证明和身份证明发送邮件到support@aicoin.com,本平台相关工作人员将会进行核查。


