On Saturday, I predicted that the rebound market was basically at its peak, and the high short strategy also yielded good profits.
Today, after the updates of the monthly and weekly K charts, with the speech of the Bank of Japan's governor, the market speculated that the Bank of Japan would suddenly raise interest rates, as Governor Ueda expressed his intention to adopt a hawkish stance again. This led to Bitcoin dropping as much as 6% during the day. The news was merely a trigger; from a technical perspective, the monthly K indicators MACD and KDJ showed a downward trend in resonance. Currently, the coin price has broken below the middle line of the BOLL band, and the 5-day and 10-day moving averages are trending downwards, indicating that the bear market is coming and cannot be influenced by just a few news events. The current monthly K direction is still dominated by bears.
On the weekly K chart, with the update of the new week, the 5-day moving average continues to press down, and all indicators show a downward resonance. The TD indicator has reached TD6, indicating that the current K-line downward trend has not ended, and it is only a matter of time before it enters the TD789 downward sentiment.
On the daily line, with a large bearish candle today, the MACD bullish sentiment has shrunk, and the KDJ has turned down three times from a high position. Coupled with the overall trend of the BOLL band and the continuous downward pressure of the 30-day moving average, it also indicates that the current daily line sentiment is heavily bearish.
On the 4-hour line, three bearish candles have caused the current coin price to break and operate below the lower track of the BOLL band. All indicators show a bearish sentiment divergence, which has also led to a gap of over 3000 points between the current coin price and the 5-day moving average. Combining with the hourly line, the current market trend still leans towards a volatile downward movement. During the day, it is crucial to pay attention to the resistance breakthrough situation at the upper level of 87500-88200, with support at the lower level of 84000-80000. Personally, I still maintain the main idea of a rebound high short.
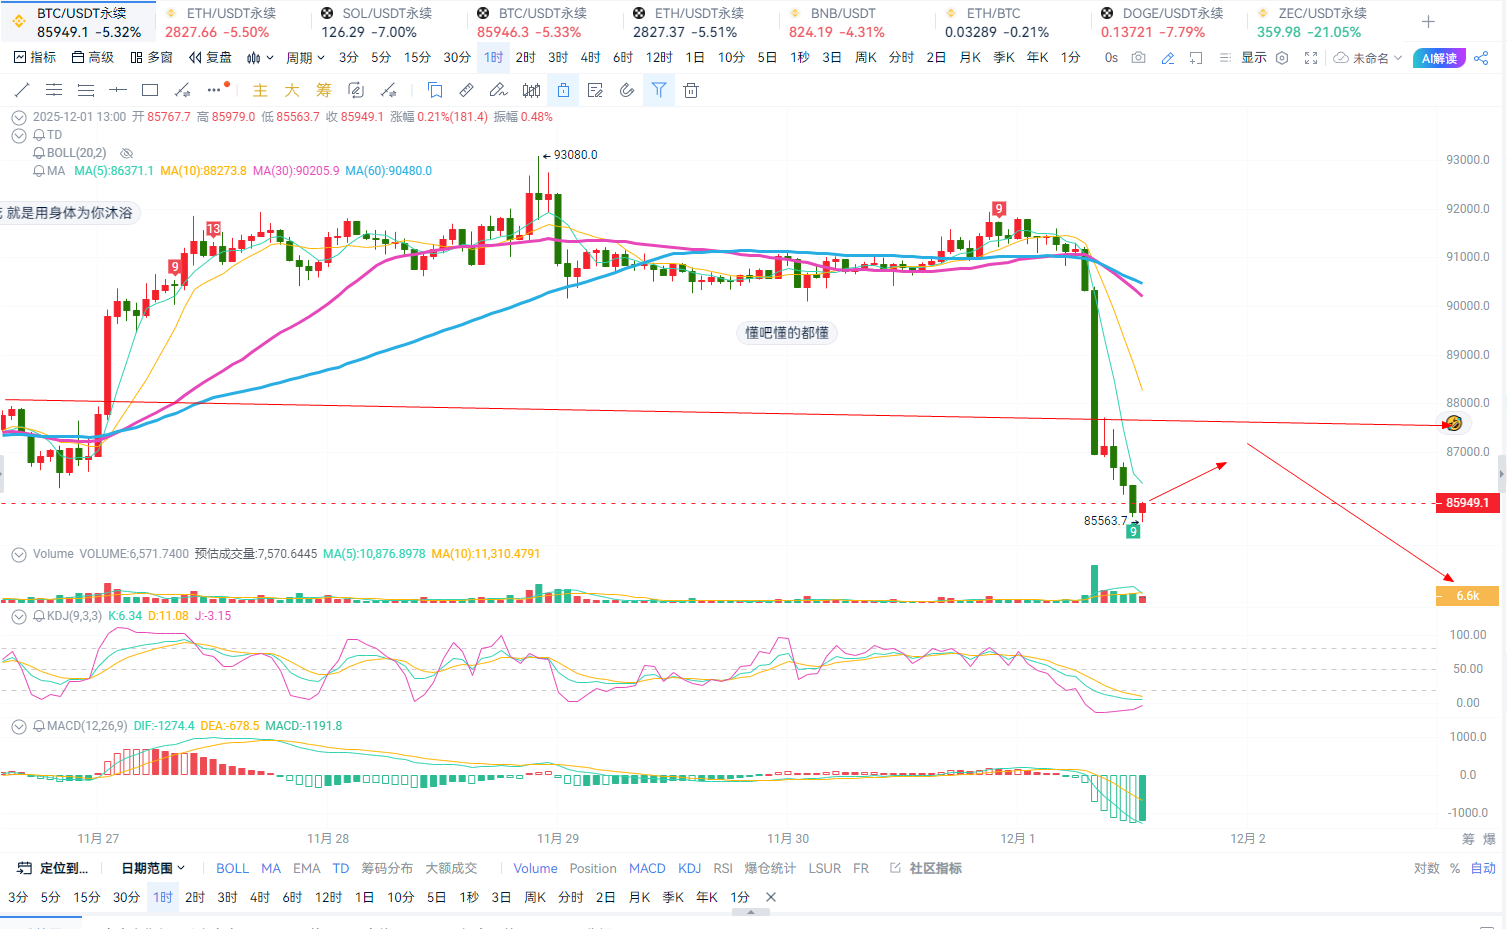
Operation strategy: Short in batches at 87000-88000. Target: 84000-80500. Stop loss: 88500.
No reference for going long at the moment.
Ethereum's short-term trend is basically in sync with Bitcoin. As the highs continue to decline, its resistance level is around 2870-2900, with support at 2770-2620. If the daily rebound cannot effectively break through any upper resistance, I still maintain the main idea of a rebound high short.
Operation strategy: Short in batches at 2850-2900. Target: 2770-2650. Stop loss: 2920.
No reference for going long at the moment. The current trend is expected to be sufficient, and I will continue to follow up.
Personal views are for reference only. There may be delays in article review and push notifications; the market changes rapidly. Specific entry and exit points should be based on real-time guidance. Please be cautious when entering the market. Analysis is not easy; feel free to like and follow the public account for surprises!

免责声明:本文章仅代表作者个人观点,不代表本平台的立场和观点。本文章仅供信息分享,不构成对任何人的任何投资建议。用户与作者之间的任何争议,与本平台无关。如网页中刊载的文章或图片涉及侵权,请提供相关的权利证明和身份证明发送邮件到support@aicoin.com,本平台相关工作人员将会进行核查。