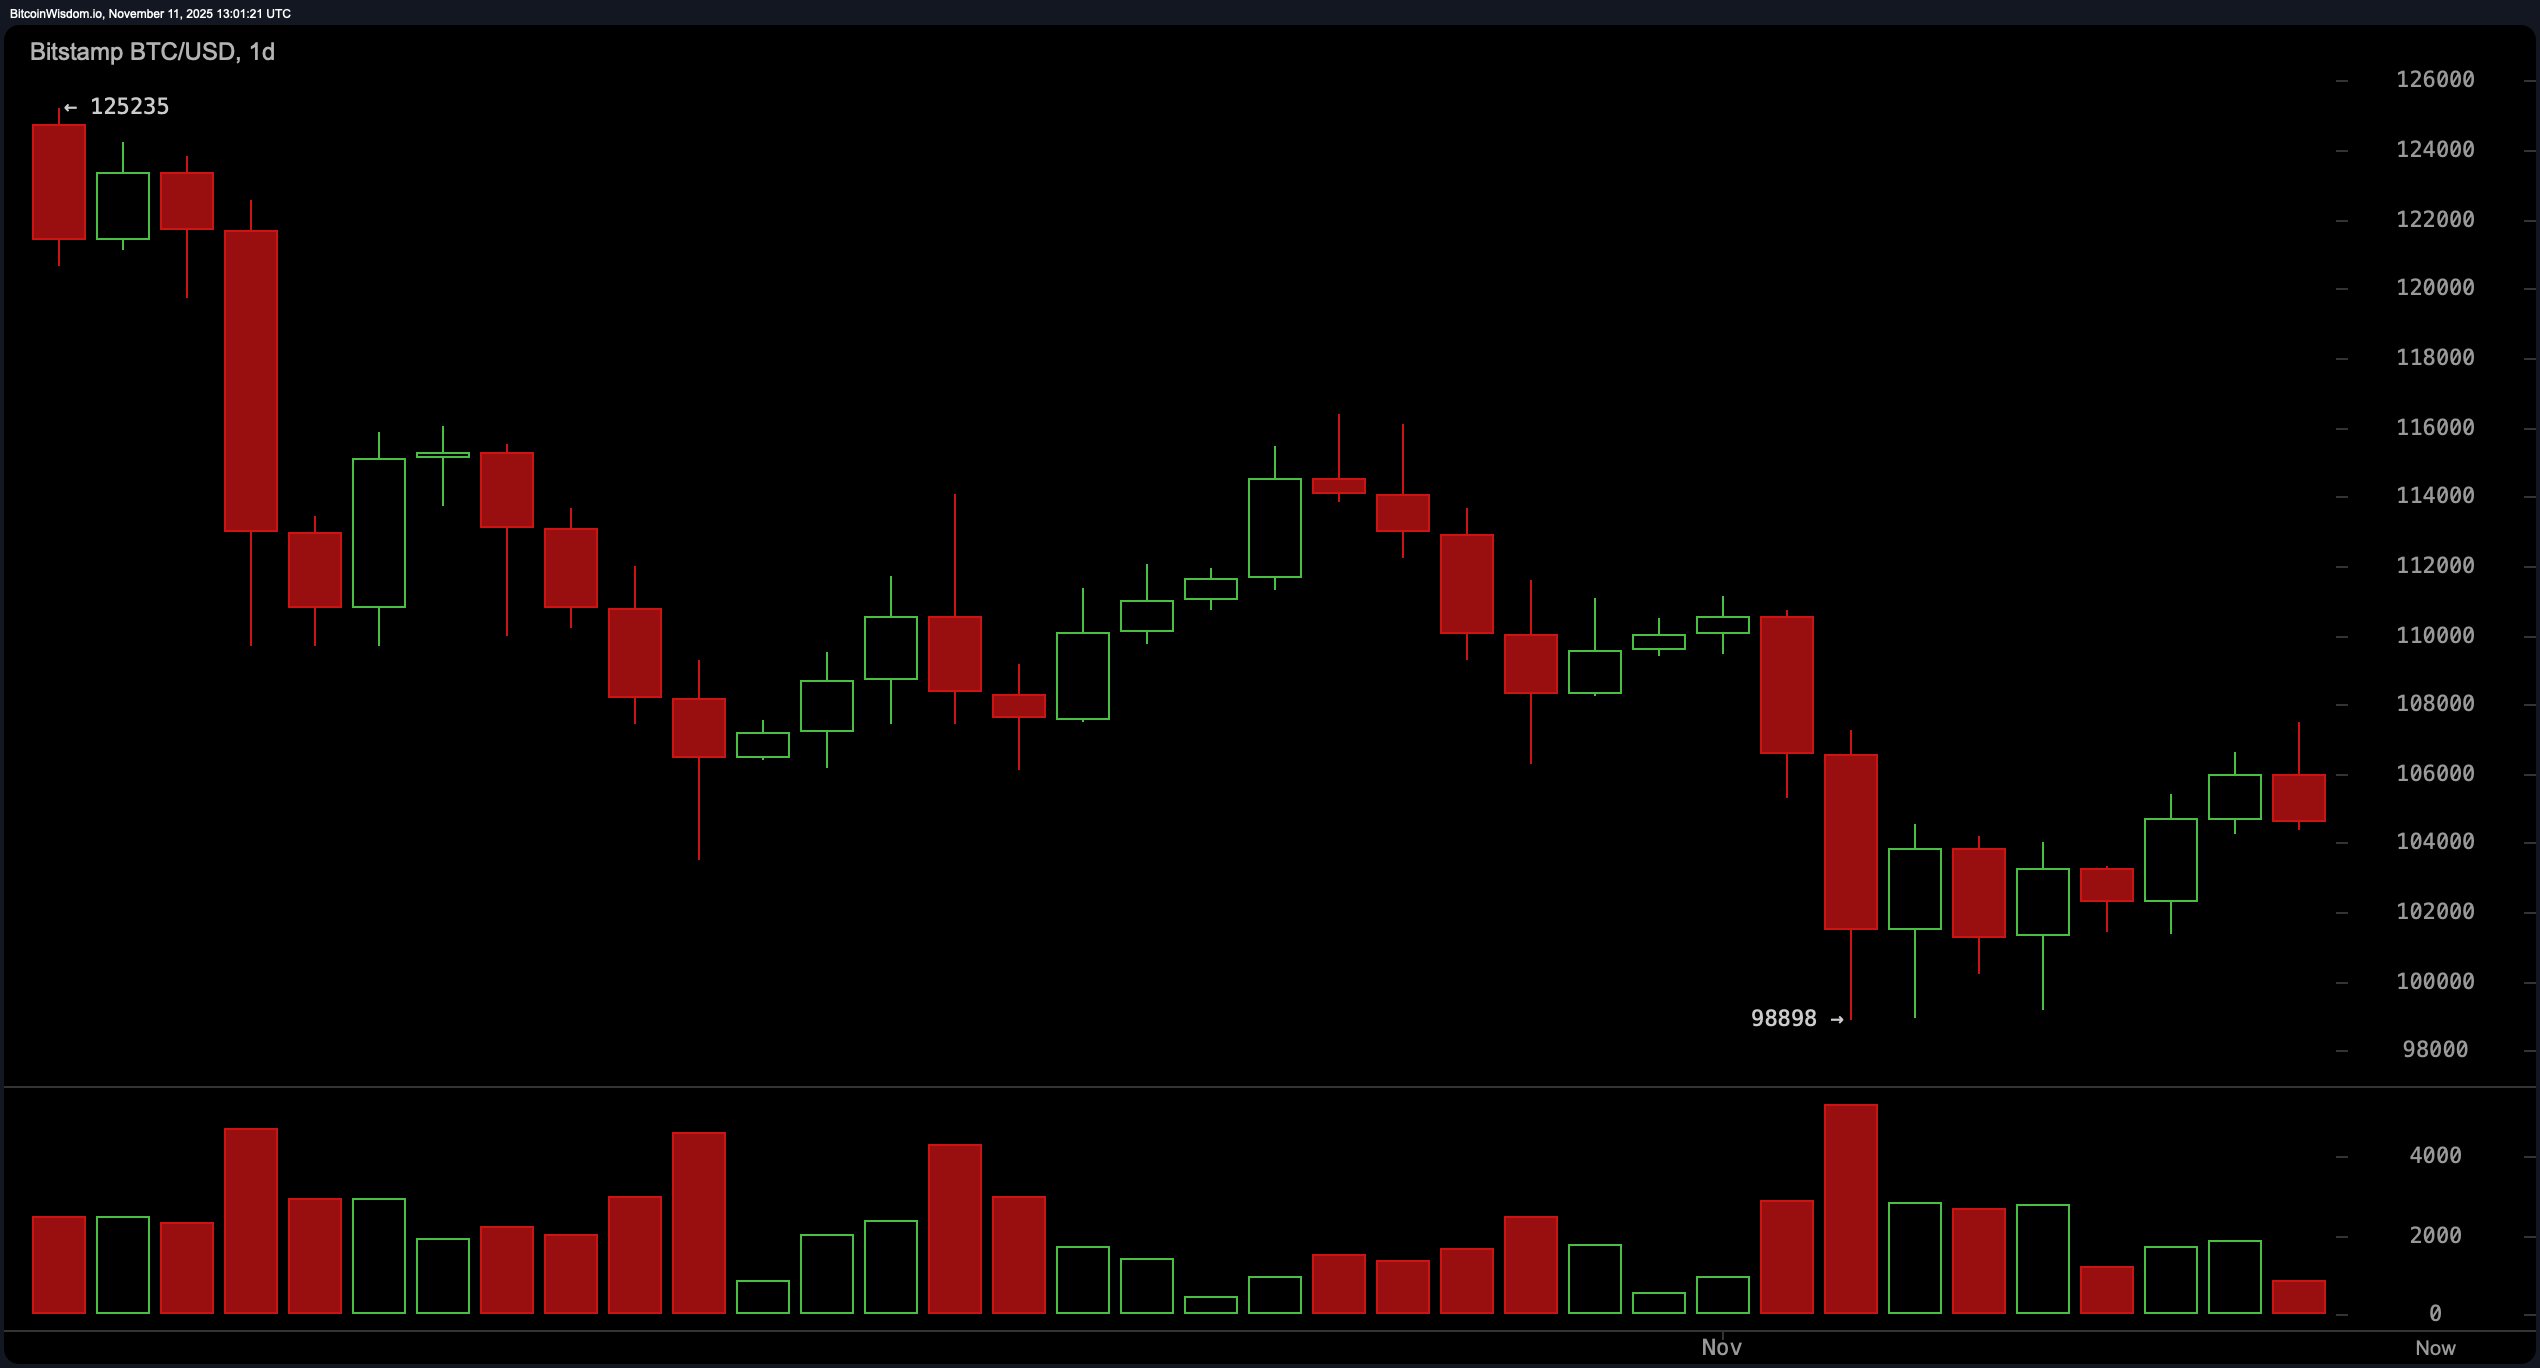
On the daily chart, bitcoin is clearly struggling to shake off its downward slouch. The trend remains bearish, having formed a classic lower-high, lower-low pattern since peaking near $125,235. Volume tells no lies—those recent green candles have been whisper-thin compared to the hearty red ones, betraying a lack of buying muscle.
The $98,898 support is holding firm for now, but another limp back below $102,000 could pull prices into a pitfall toward fresh lows. To the upside, $108,000–$110,000 looms like a velvet rope—cross it with confidence, and the bears might finally step aside.

BTC/USD 1-day chart via Bitstamp on Nov. 11, 2025.
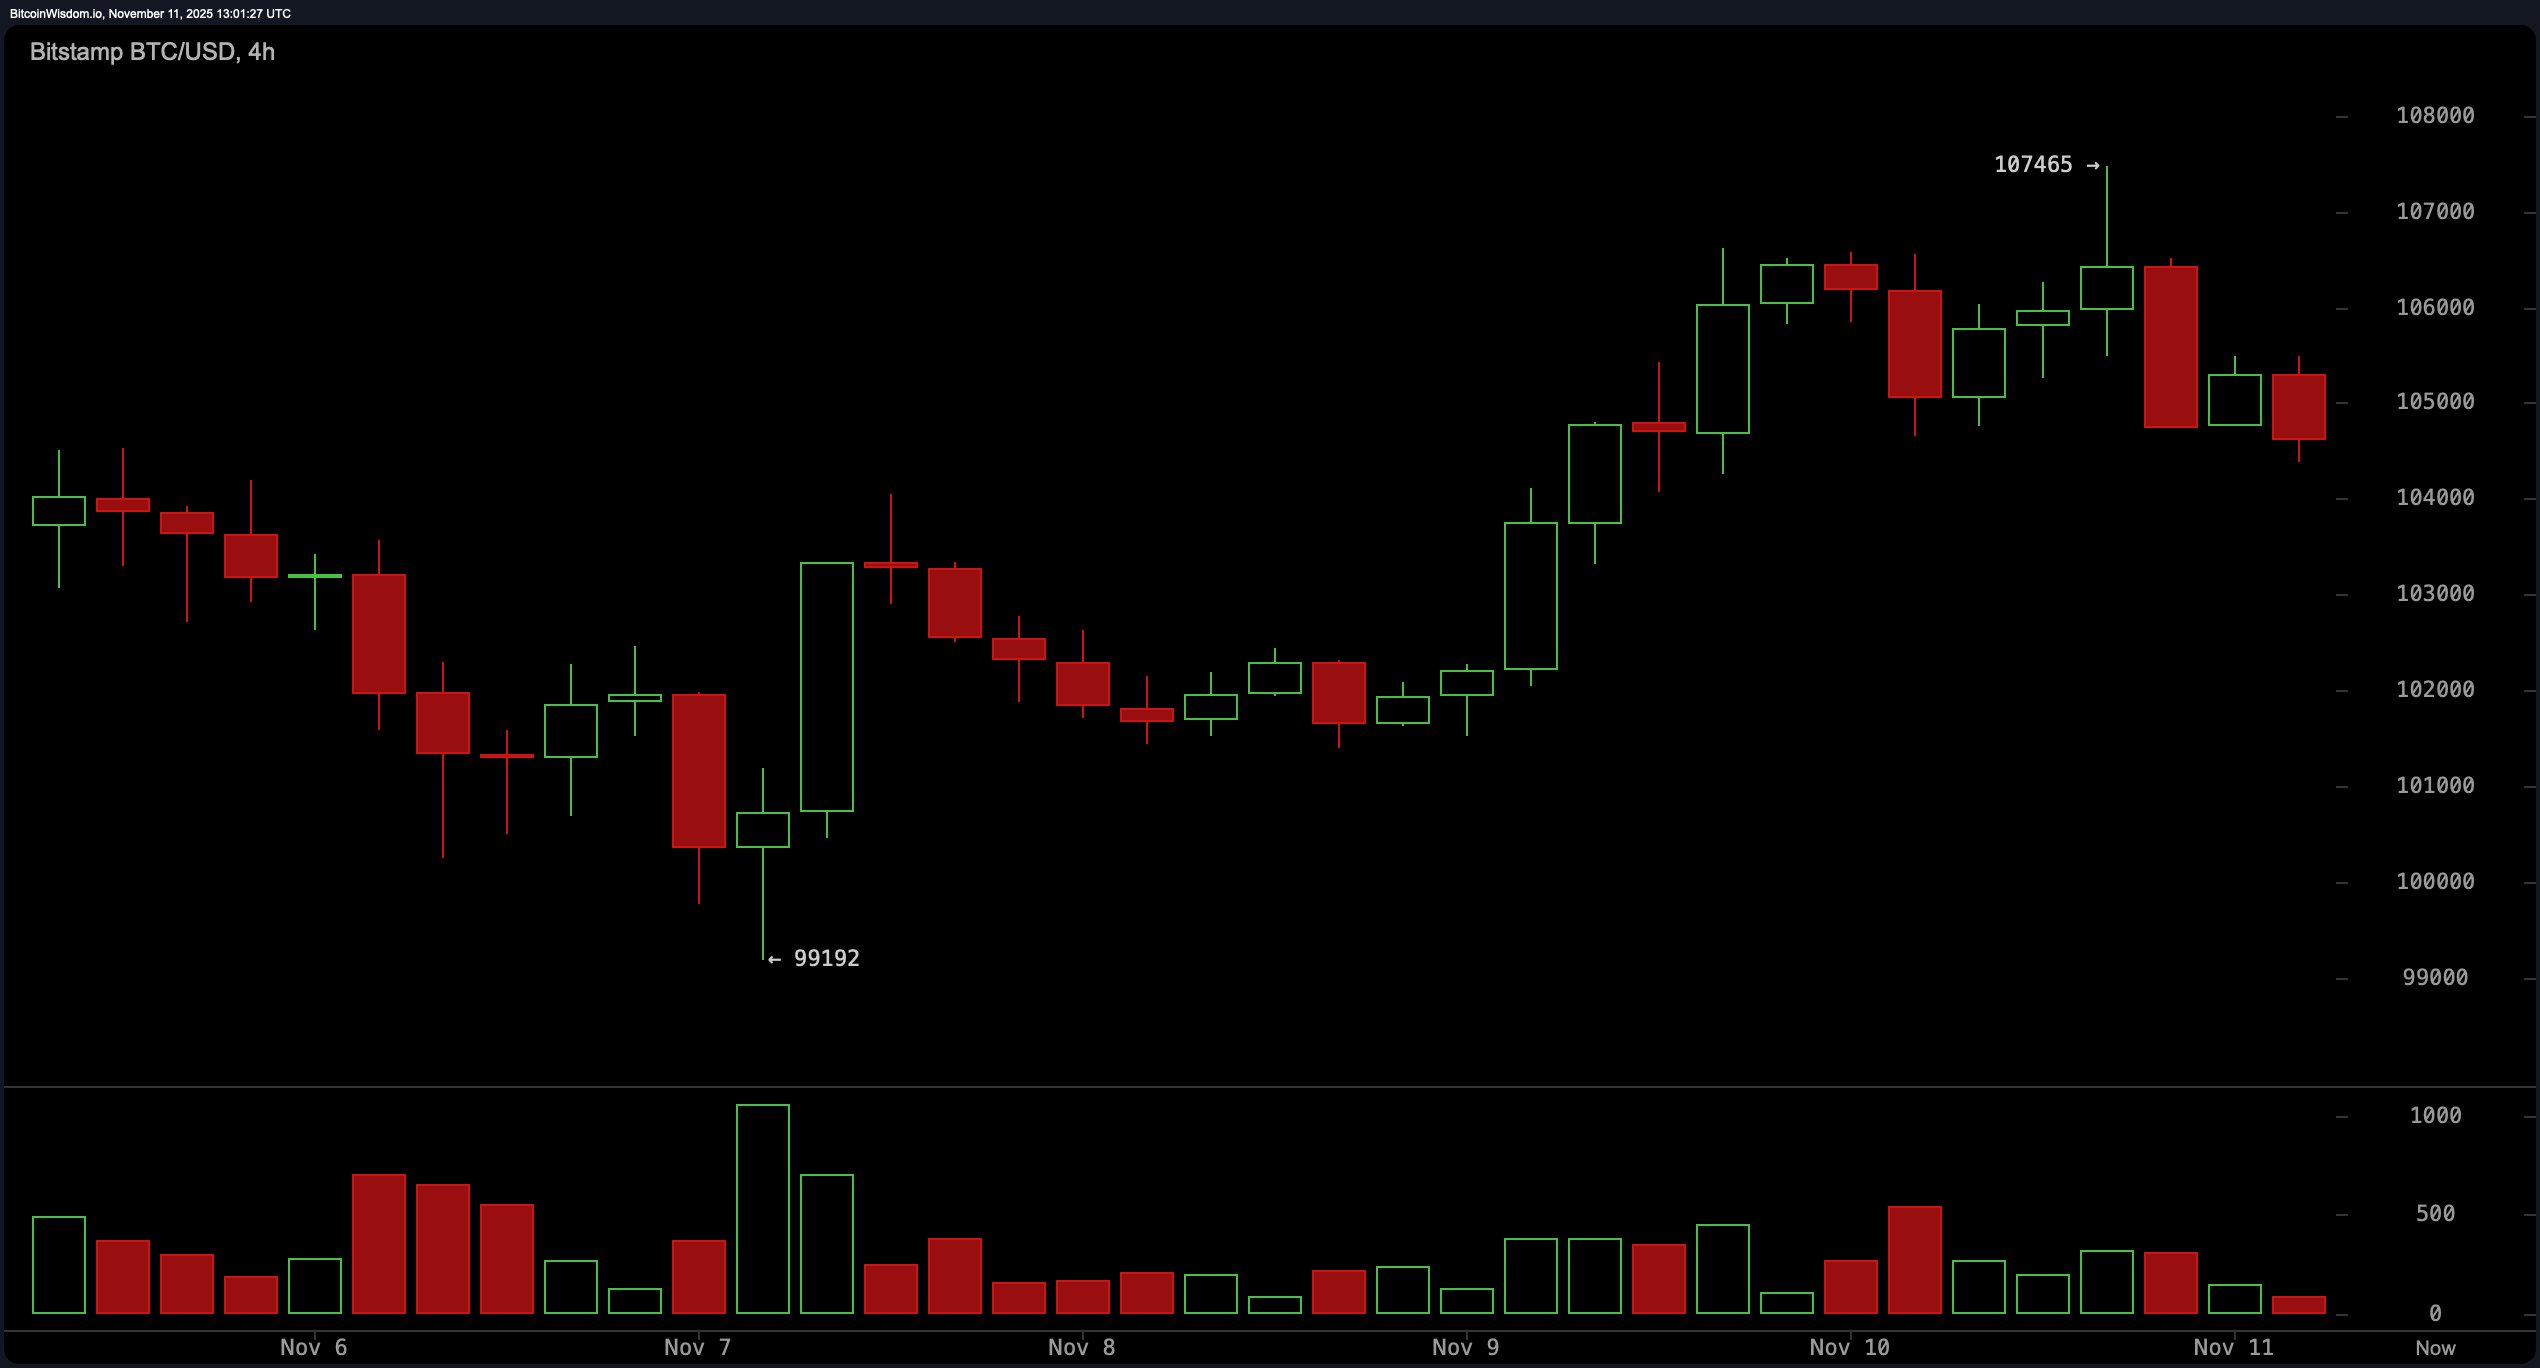
The four-hour chart paints a short-term recovery that’s already hit a ceiling. After rebounding from $99,192 to the day’s high of $107,465, bitcoin was promptly swatted down by resistance at the top of the range. That 107,465 level is acting like an exclusive VIP lounge—no easy entry. However, the $99,000 support zone isn’t budging either, now reinforced by two successful defenses. Holding above $106,000 with some volume weight could swing sentiment, but dropping below $103,000 could trigger another fall toward that trusty $99,000 level.

BTC/USD 4-hour chart via Bitstamp on Nov. 11, 2025.
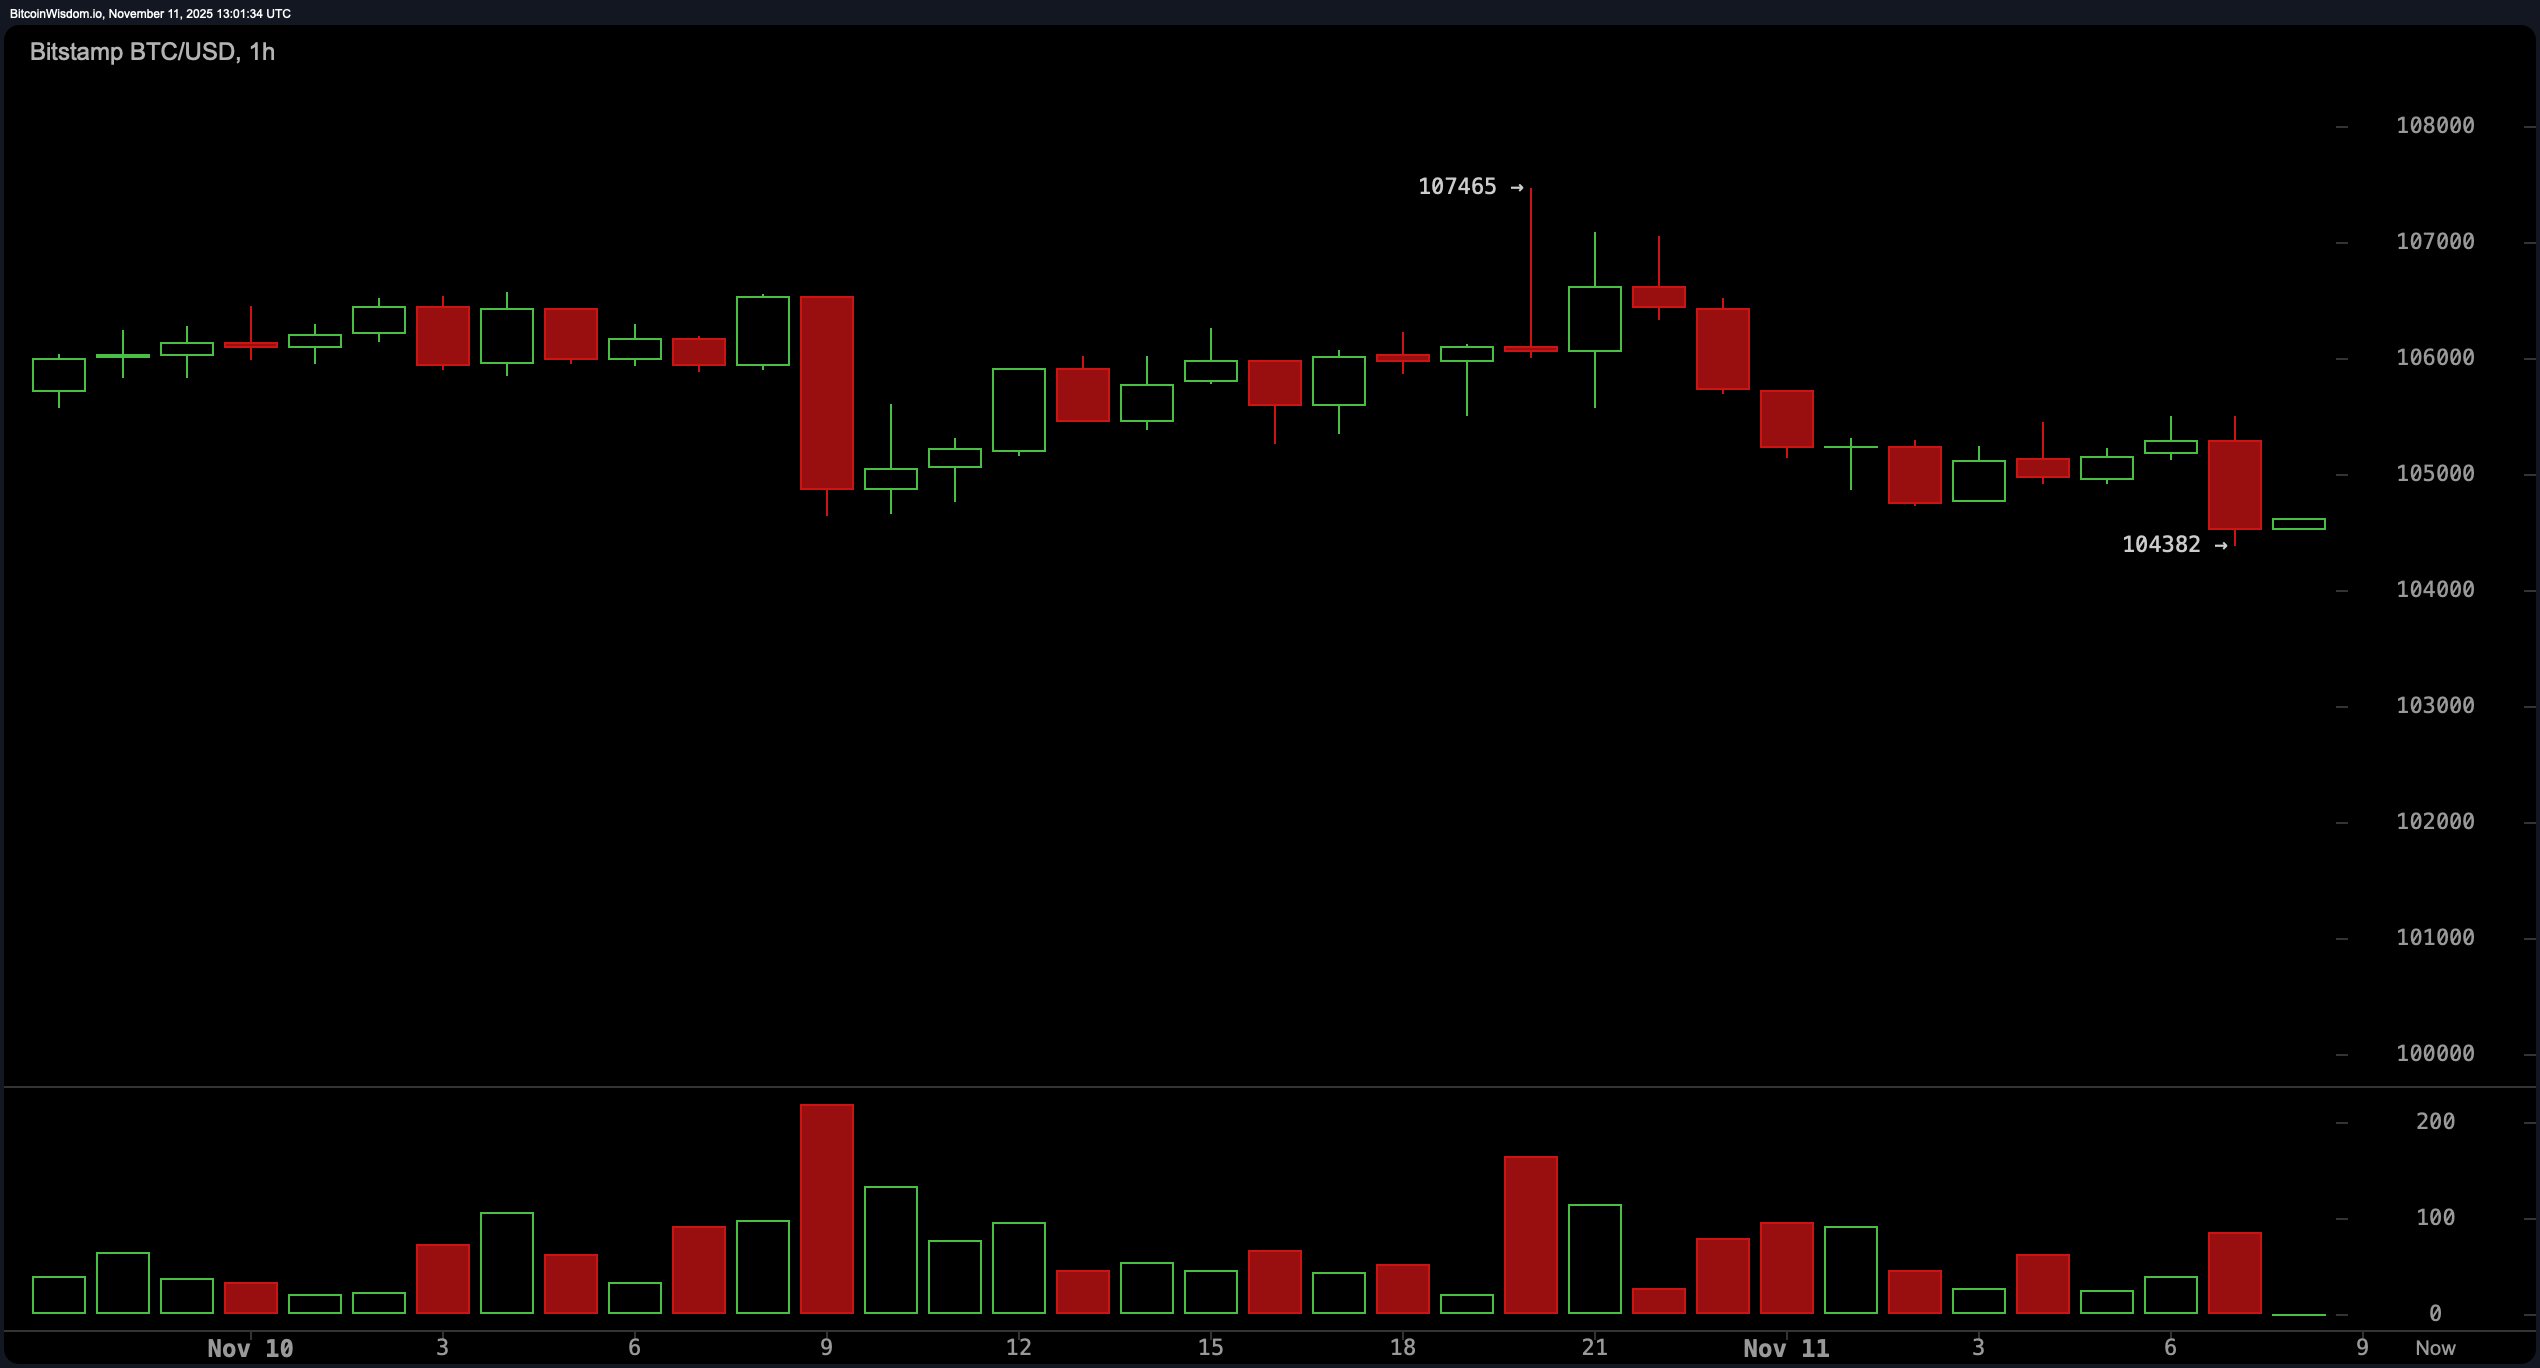
Zooming into the one-hour chart, bitcoin’s microstructure is as jittery as a caffeine-fueled day trader. It poked at 107,465, but retreated quickly, with 104,382 now serving as a makeshift safety net. Volume signals are murky—there’s pressure on red candles, but not enough conviction to declare a trend. If bitcoin stays bouncy above $104,400, a dash to 106,500–107,000 could be on the cards. But if it tumbles under $104,000, expect the market to revisit 102,500–103,000 faster than you can say “volatility.”

BTC/USD 1-hour chart via Bitstamp on Nov. 11, 2025.
Oscillators aren’t exactly throwing a party either. The relative strength index (RSI) at 43, stochastic at 37, and commodity channel index (CCI) at −44 are all humming a neutral tune. The average directional index (ADX) is at a modest 25, showing no strong directional grasp. The awesome oscillator reads −5,630, and the momentum indicator is limping at −5,538, both lacking enthusiasm. And the moving average convergence divergence (MACD) isn’t doing any favors either, clocking in at −2,314—adding to the case that this market lacks a clear spark.
Moving averages are mostly lined up against any sustained move upward. The exponential moving averages (EMAs) from 10 to 200 periods and simple moving averages (SMAs) from 20 onward are all pointing downward, with only the 10-period simple moving average suggesting a sliver of upward bias. The 50-, 100-, and 200-period EMAs and SMAs, all well above the current price, confirm that bitcoin remains in a corrective phase, with resistance stacked like an angry wall of hodlers.
Bull Verdict:
If bitcoin can reclaim the $106,000 level with conviction and volume to match, a push toward $108,000 or even $110,000 isn’t out of reach. A firm breakout above this range could signal a momentum shift and awaken sidelined buyers.
Bear Verdict:
Failure to hold above $104,000, especially with growing downside volume, opens the trapdoor toward $102,000 and potentially back to the critical $98,898 support. Continued rejection at resistance and sluggish oscillator momentum make a deeper correction a strong possibility.
- What is bitcoin’s current price?
Bitcoin is trading at $104,547 as of Nov. 11, 2025. - What’s the key support zone to watch?
The $98,898 level is a major support, with interim support around $104,000. - Where is the nearest resistance?
Resistance sits between $106,000 and $110,000, with $107,465 already rejected. - Is bitcoin trending up or down today?
The broader trend remains bearish, despite short-term fluctuations.
免责声明:本文章仅代表作者个人观点,不代表本平台的立场和观点。本文章仅供信息分享,不构成对任何人的任何投资建议。用户与作者之间的任何争议,与本平台无关。如网页中刊载的文章或图片涉及侵权,请提供相关的权利证明和身份证明发送邮件到support@aicoin.com,本平台相关工作人员将会进行核查。


