If the price falls back to the $55,000-$70,000 range, it will be a normal manifestation of cyclical movement, rather than a signal of systemic collapse.
Written by: Matt Crosby
Translated by: AididiaoJP, Foresight News
While the current market is more focused on how high Bitcoin can rise in this bull market, it is equally important to prepare for the upcoming market changes. This article will estimate the next bear market bottom based on historical cycles, on-chain valuation indicators, and Bitcoin fundamentals, using data and mathematical models. This is not a specific prediction, but rather the establishment of an analytical framework.
Cyclical Model: Analyzing Historical Price Bottom Patterns
The "Bitcoin Cycle Model" is currently one of the most reliable tools for determining bottoms, as it integrates multiple on-chain indicators to construct a price valuation range.
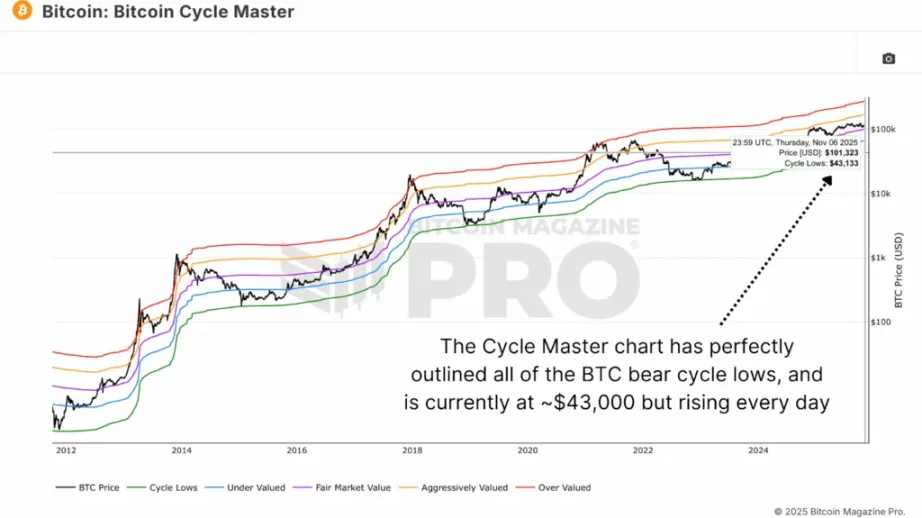
Figure 1: The model's "cyclical low" indicator has accurately captured the bottoms of past bear markets.
This green "cyclical low" line has consistently marked macro bottoms: $160 in 2015, $3,200 in 2018, and $15,500 at the end of 2022. Currently, this indicator is at $43,000 and continues to rise, providing a reference benchmark for estimating the next cyclical bottom.
Decreasing Trend: Why Bear Market Retracements Are Gradually Weaker
Through the MVRV ratio (market value to realized value ratio), it can be observed that when the market enters a deep bear market, Bitcoin's price typically falls to 0.75 times the realized price, which is 25% lower than the average holding cost across the network.
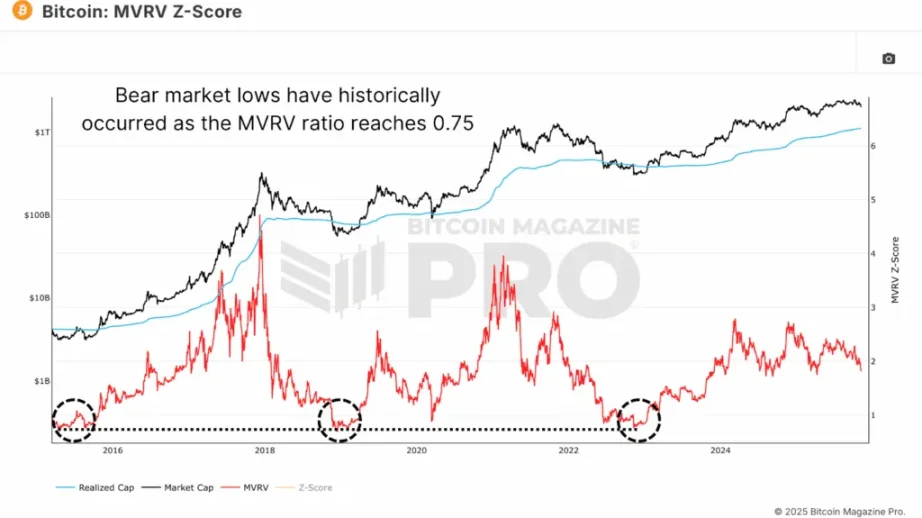
Figure 2: The bottoms of past bear markets have all occurred when the MVRV ratio fell to 0.75.
Combining the analysis of the decreasing trend in declines: the maximum decline in early cycles reached 88%, compressed to 80% in 2018, and further reduced to 75% in 2022. Based on this trend, the maximum retracement in the next bear market may be controlled around 70%.
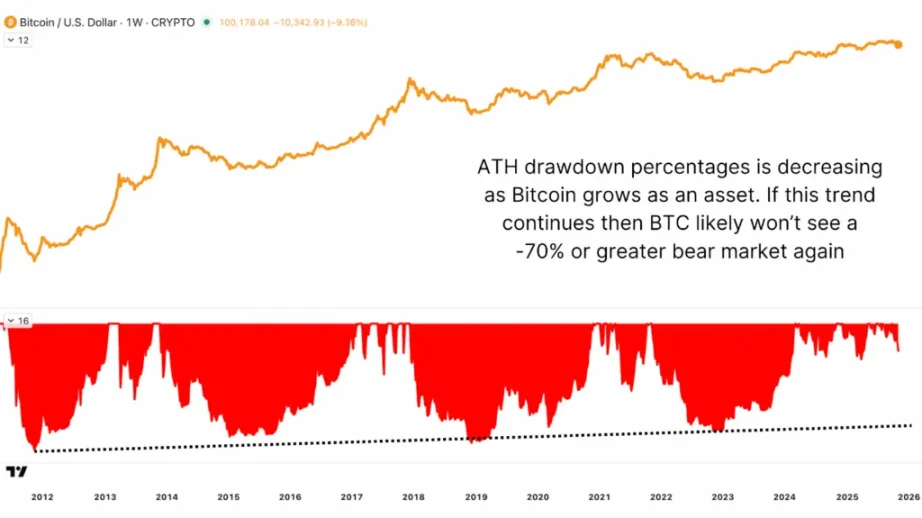
Figure 3: The decreasing trend of bear market declines suggests that the next retracement will not exceed 70%.
Predicting the Next Bull-Bear Turning Point
Before estimating the bottom, it is necessary to first determine the peak of this bull market. Historical data shows that Bitcoin tops usually occur around 2.5 times the realized price. If this pattern continues, it is expected to reach a high of $180,000 by the end of 2025.
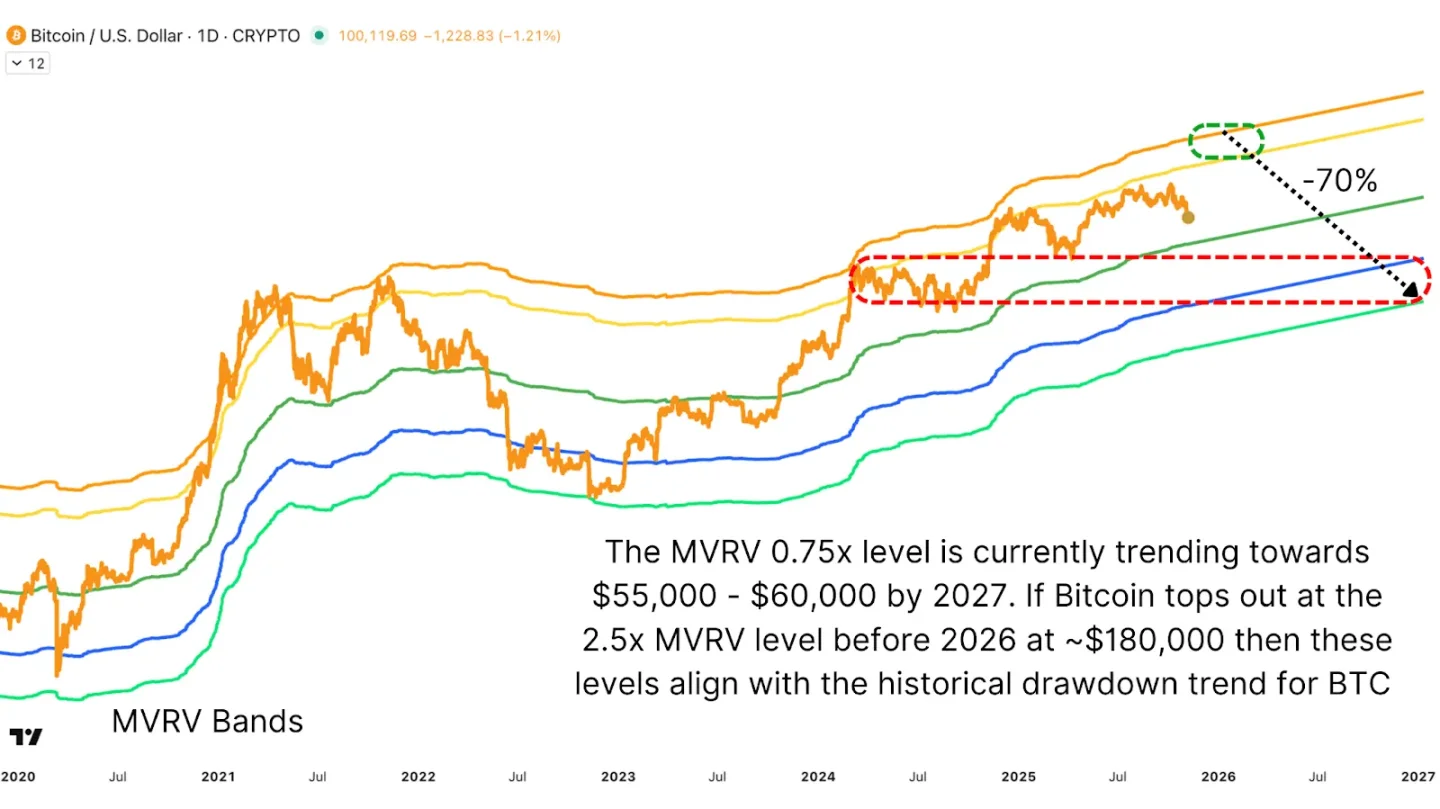
Figure 4: The comprehensive model prediction indicates that the cyclical top may reach $180,000, with the bear market bottom range in 2027 being $55,000-$60,000.
If Bitcoin continues the pattern of "peaking one year before bottoming," a 70% retracement from the peak in 2027 would place the bottom range at $55,000-$60,000. This range coincides with the technical resonance formed by last year's consolidation platform.
The Supportive Role of Production Costs on Price
The production cost of Bitcoin (the electricity cost of mining one coin) is an important anchor for long-term value and has historically aligned closely with bear market bottoms. Each halving doubles the cost, creating a continuously rising price floor.
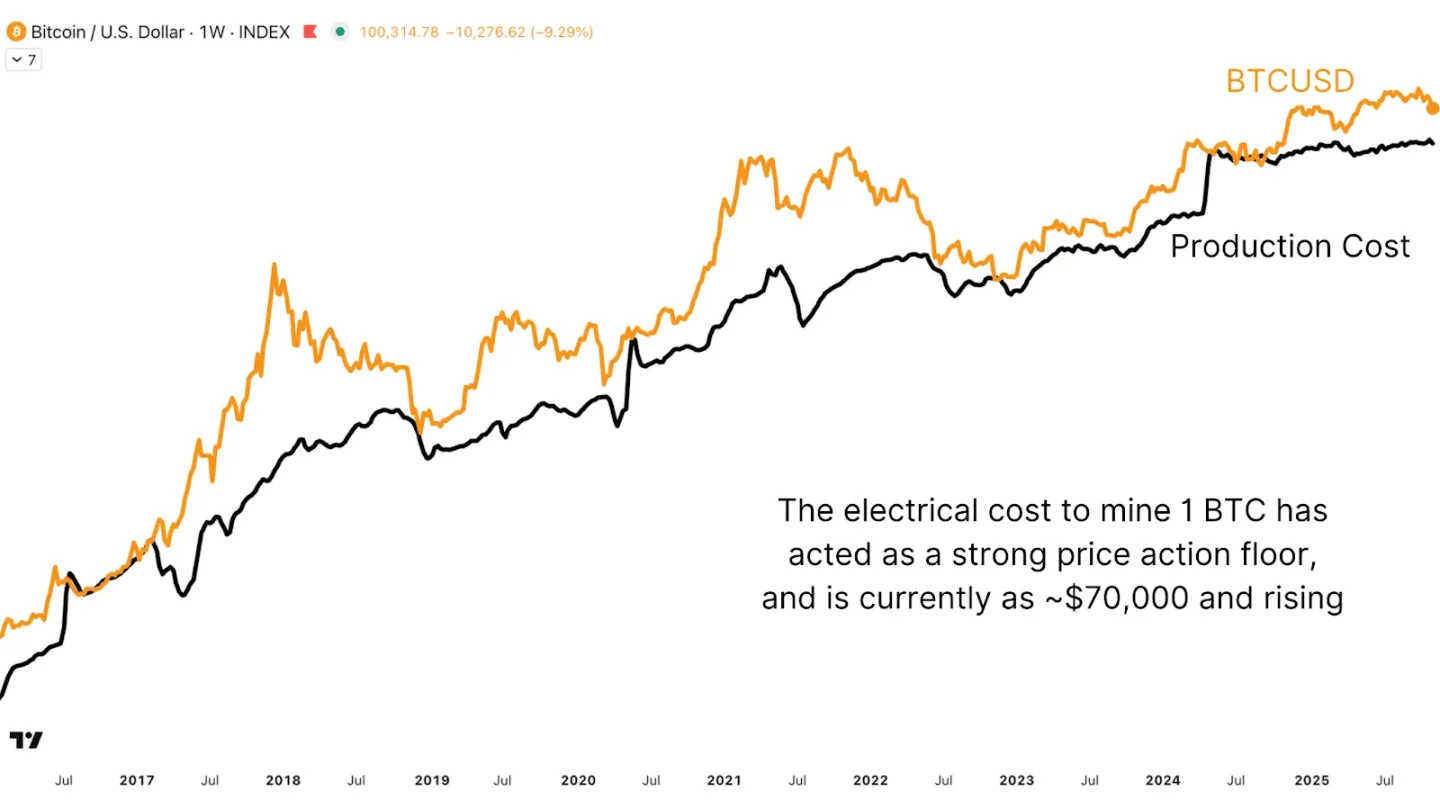
Figure 5: The current production cost of about $70,000 per coin constitutes strong price support.
When the coin price falls below the production cost, it often triggers miners to reduce output and creates historically significant buying opportunities. After the halving in April 2024, the cost line has significantly risen, and each recent approach to this position has triggered strong rebounds. The current value anchor is approximately $70,000.
Conclusion: The New Cycle Will Be More Gradual
In every cycle, there are always those who proclaim "this time is different," but the data consistently reveals underlying patterns. Although institutional entry and the process of financialization have changed market structures, they have not eliminated cyclical characteristics.
All signs indicate that the next bear market will be milder, reflecting a maturing market and deepening liquidity. If the price falls back to the $55,000-$70,000 range, it will be a normal manifestation of cyclical movement, rather than a signal of systemic collapse.
免责声明:本文章仅代表作者个人观点,不代表本平台的立场和观点。本文章仅供信息分享,不构成对任何人的任何投资建议。用户与作者之间的任何争议,与本平台无关。如网页中刊载的文章或图片涉及侵权,请提供相关的权利证明和身份证明发送邮件到support@aicoin.com,本平台相关工作人员将会进行核查。


