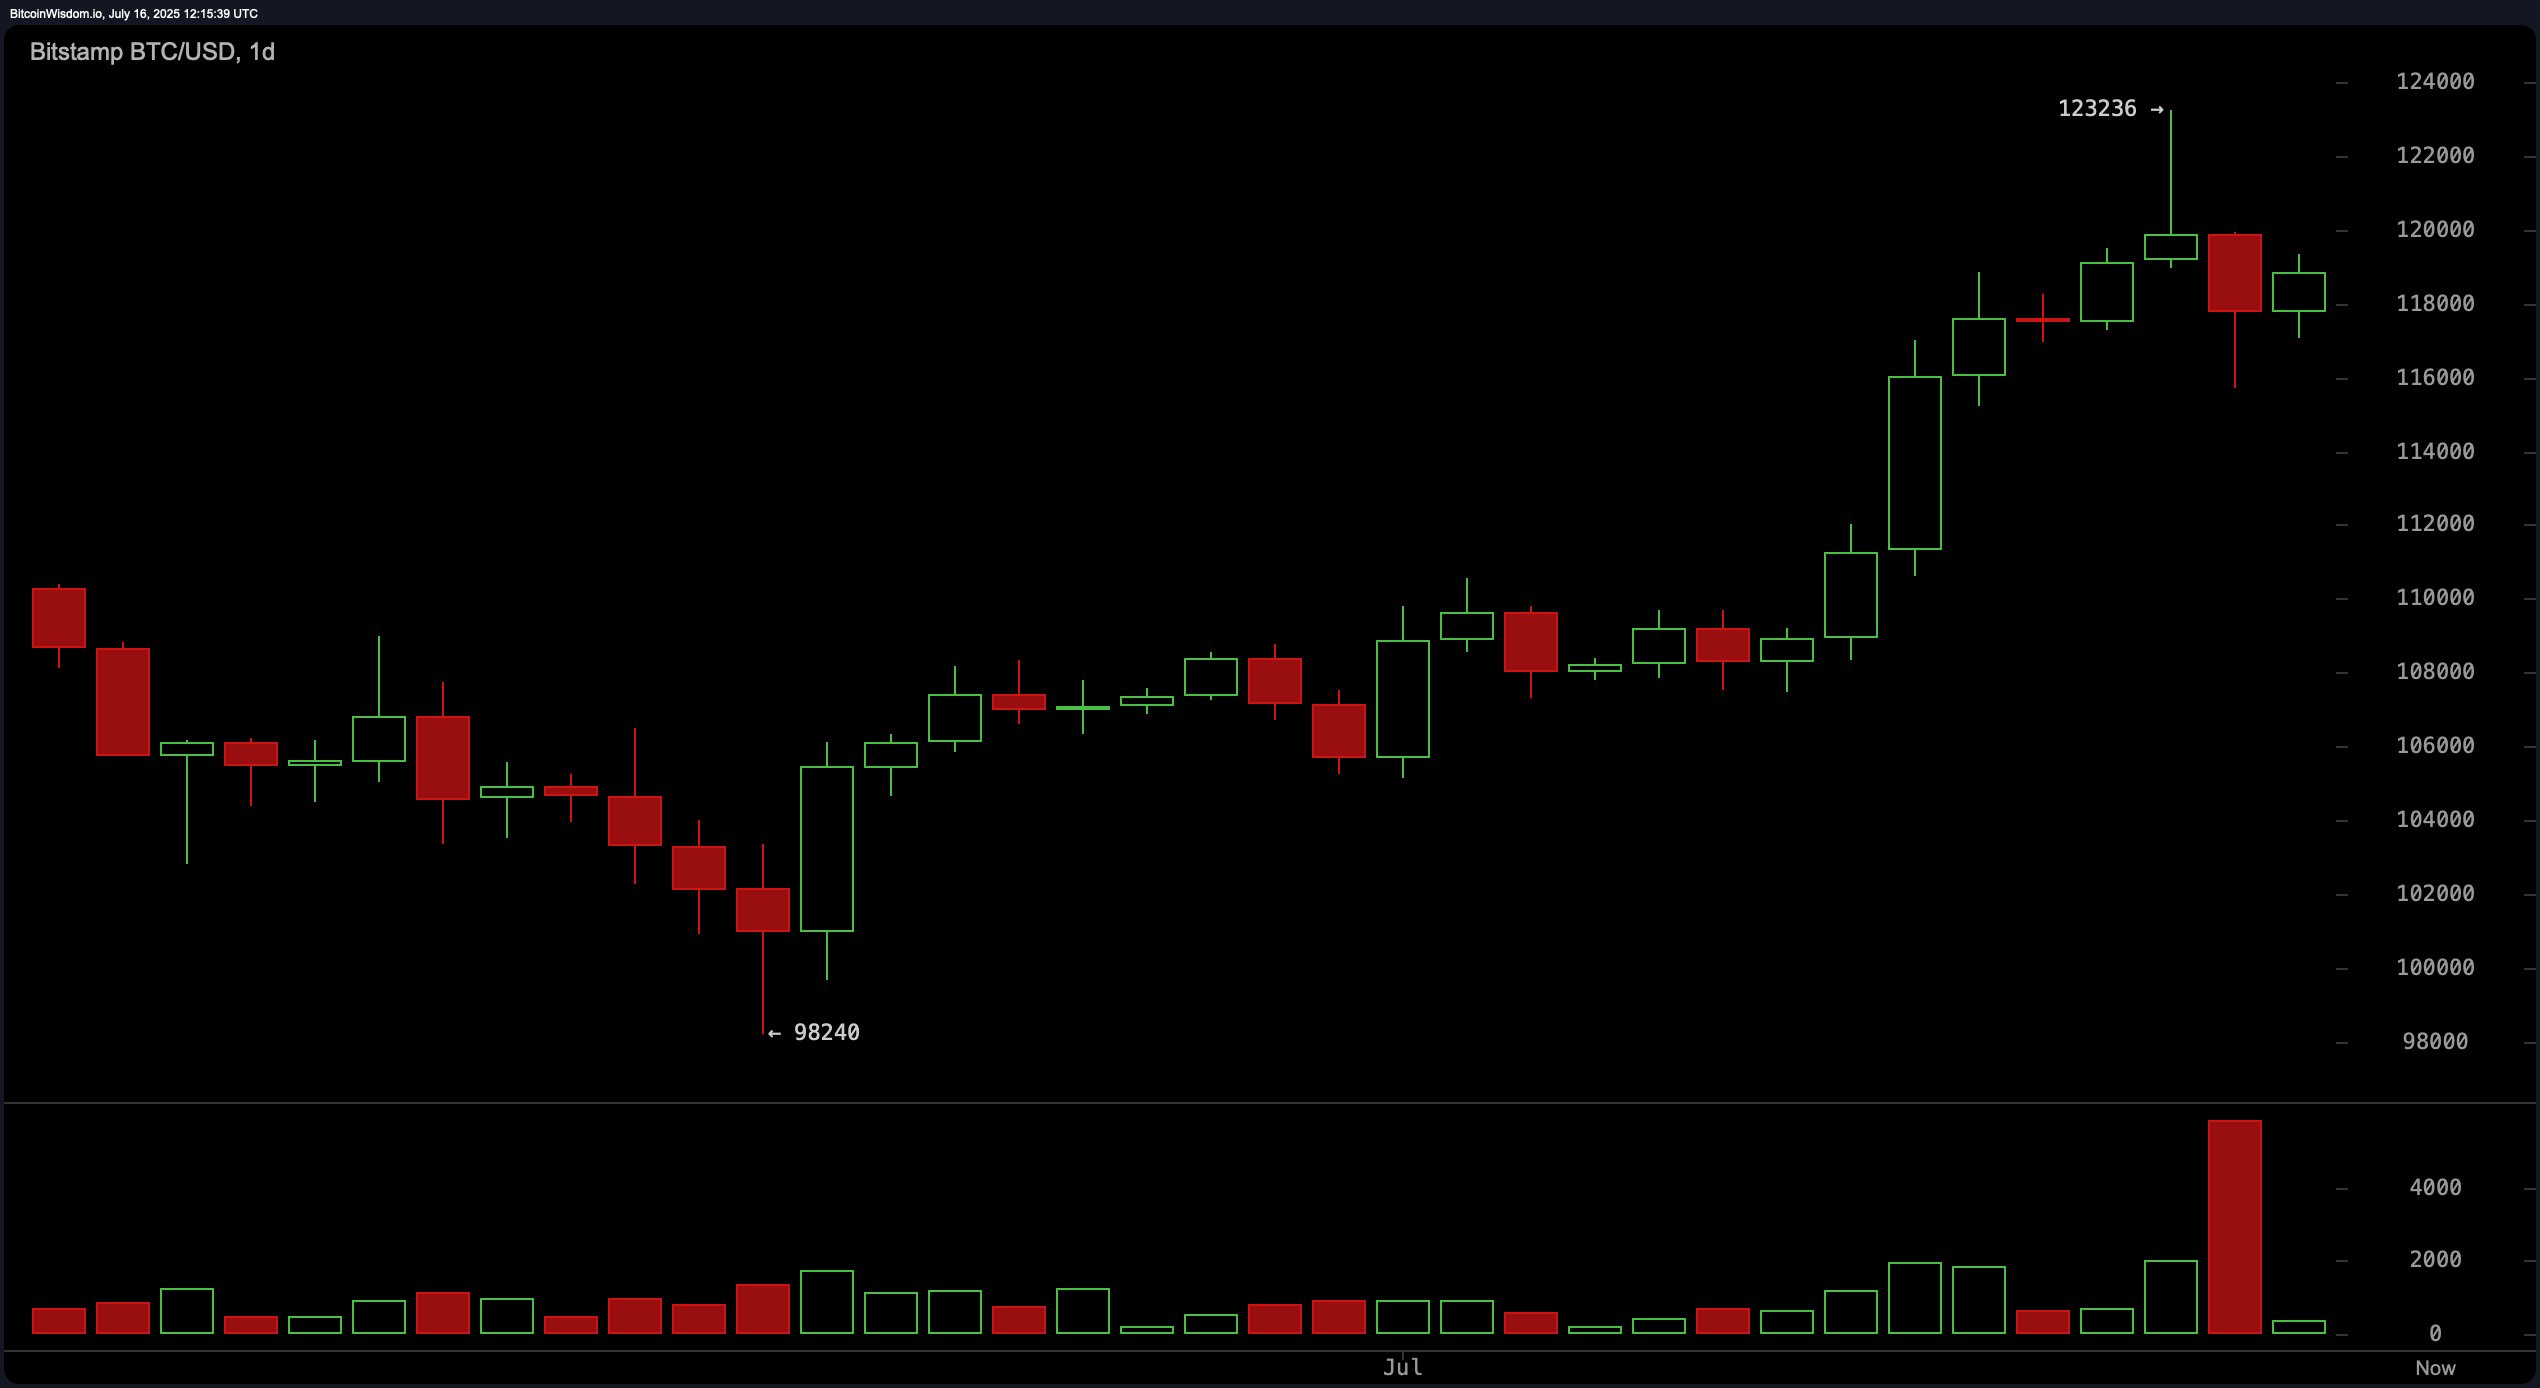
The daily bitcoin chart indicates a bullish breakout from a low of $98,240 toward a peak near $123,236 before consolidating back to the $118,000 level. This suggests that while the primary uptrend remains intact, profit-taking near resistance has led to a temporary pause. The presence of strong support at $98,240 and resistance at $123,236 outlines a defined range, with potential long positions favorable on dips near the $115,000–$116,000 zone. A lack of high buy volume accompanying the pullback implies subdued bullish conviction, making volume a critical metric in the coming sessions. The next upward push must breach the $122,000–$123,000 area on solid volume to confirm trend continuation.

BTC/USD via Bitstamp on July 16, 2025, 1-day chart.
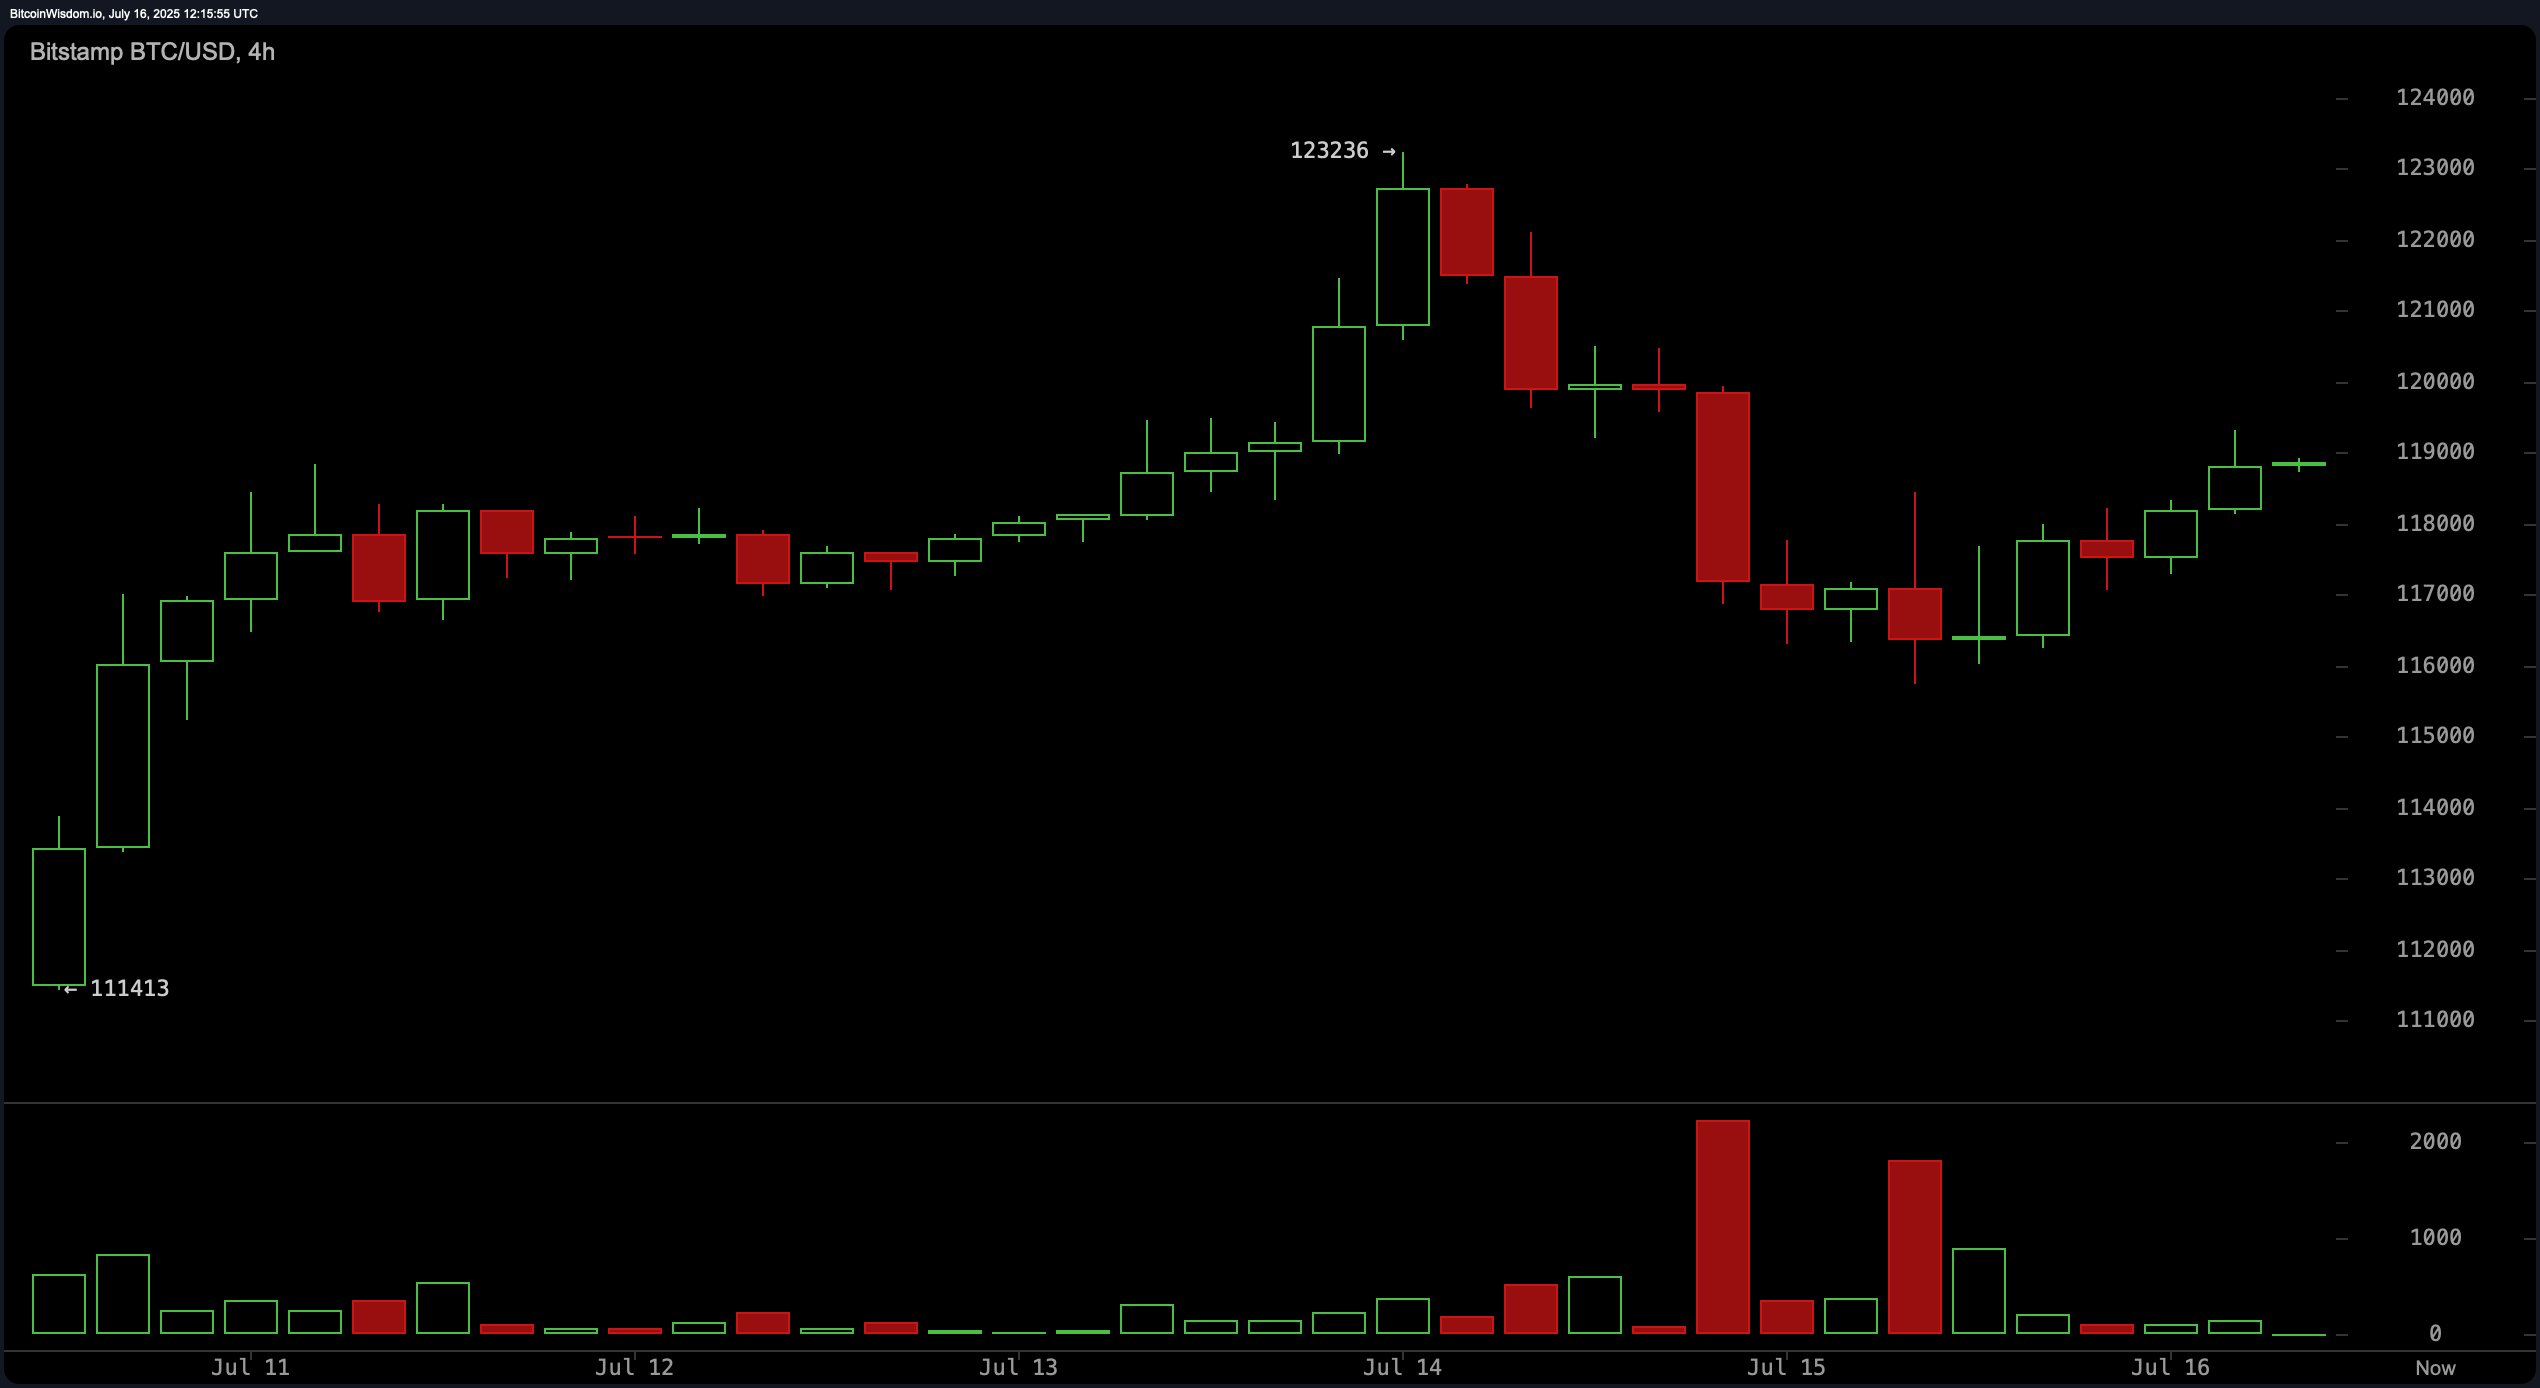
On the 4-hour bitcoin chart, a sharp correction brought bitcoin down to a local low of $111,413 before a V-shaped recovery began. The bounce, while technically promising, occurred on declining volume, raising flags about follow-through strength. Price action between $116,000–$117,000 may offer a tactical buy zone, provided the pullback is not accompanied by heavy selling. Traders should remain cautious, especially if bitcoin struggles to maintain price levels above $119,000. A failure to clear $120,000 convincingly could prompt short-term exits in the $119,000–$120,000 range.

BTC/USD via Bitstamp on July 16, 2025, 4-hour chart.
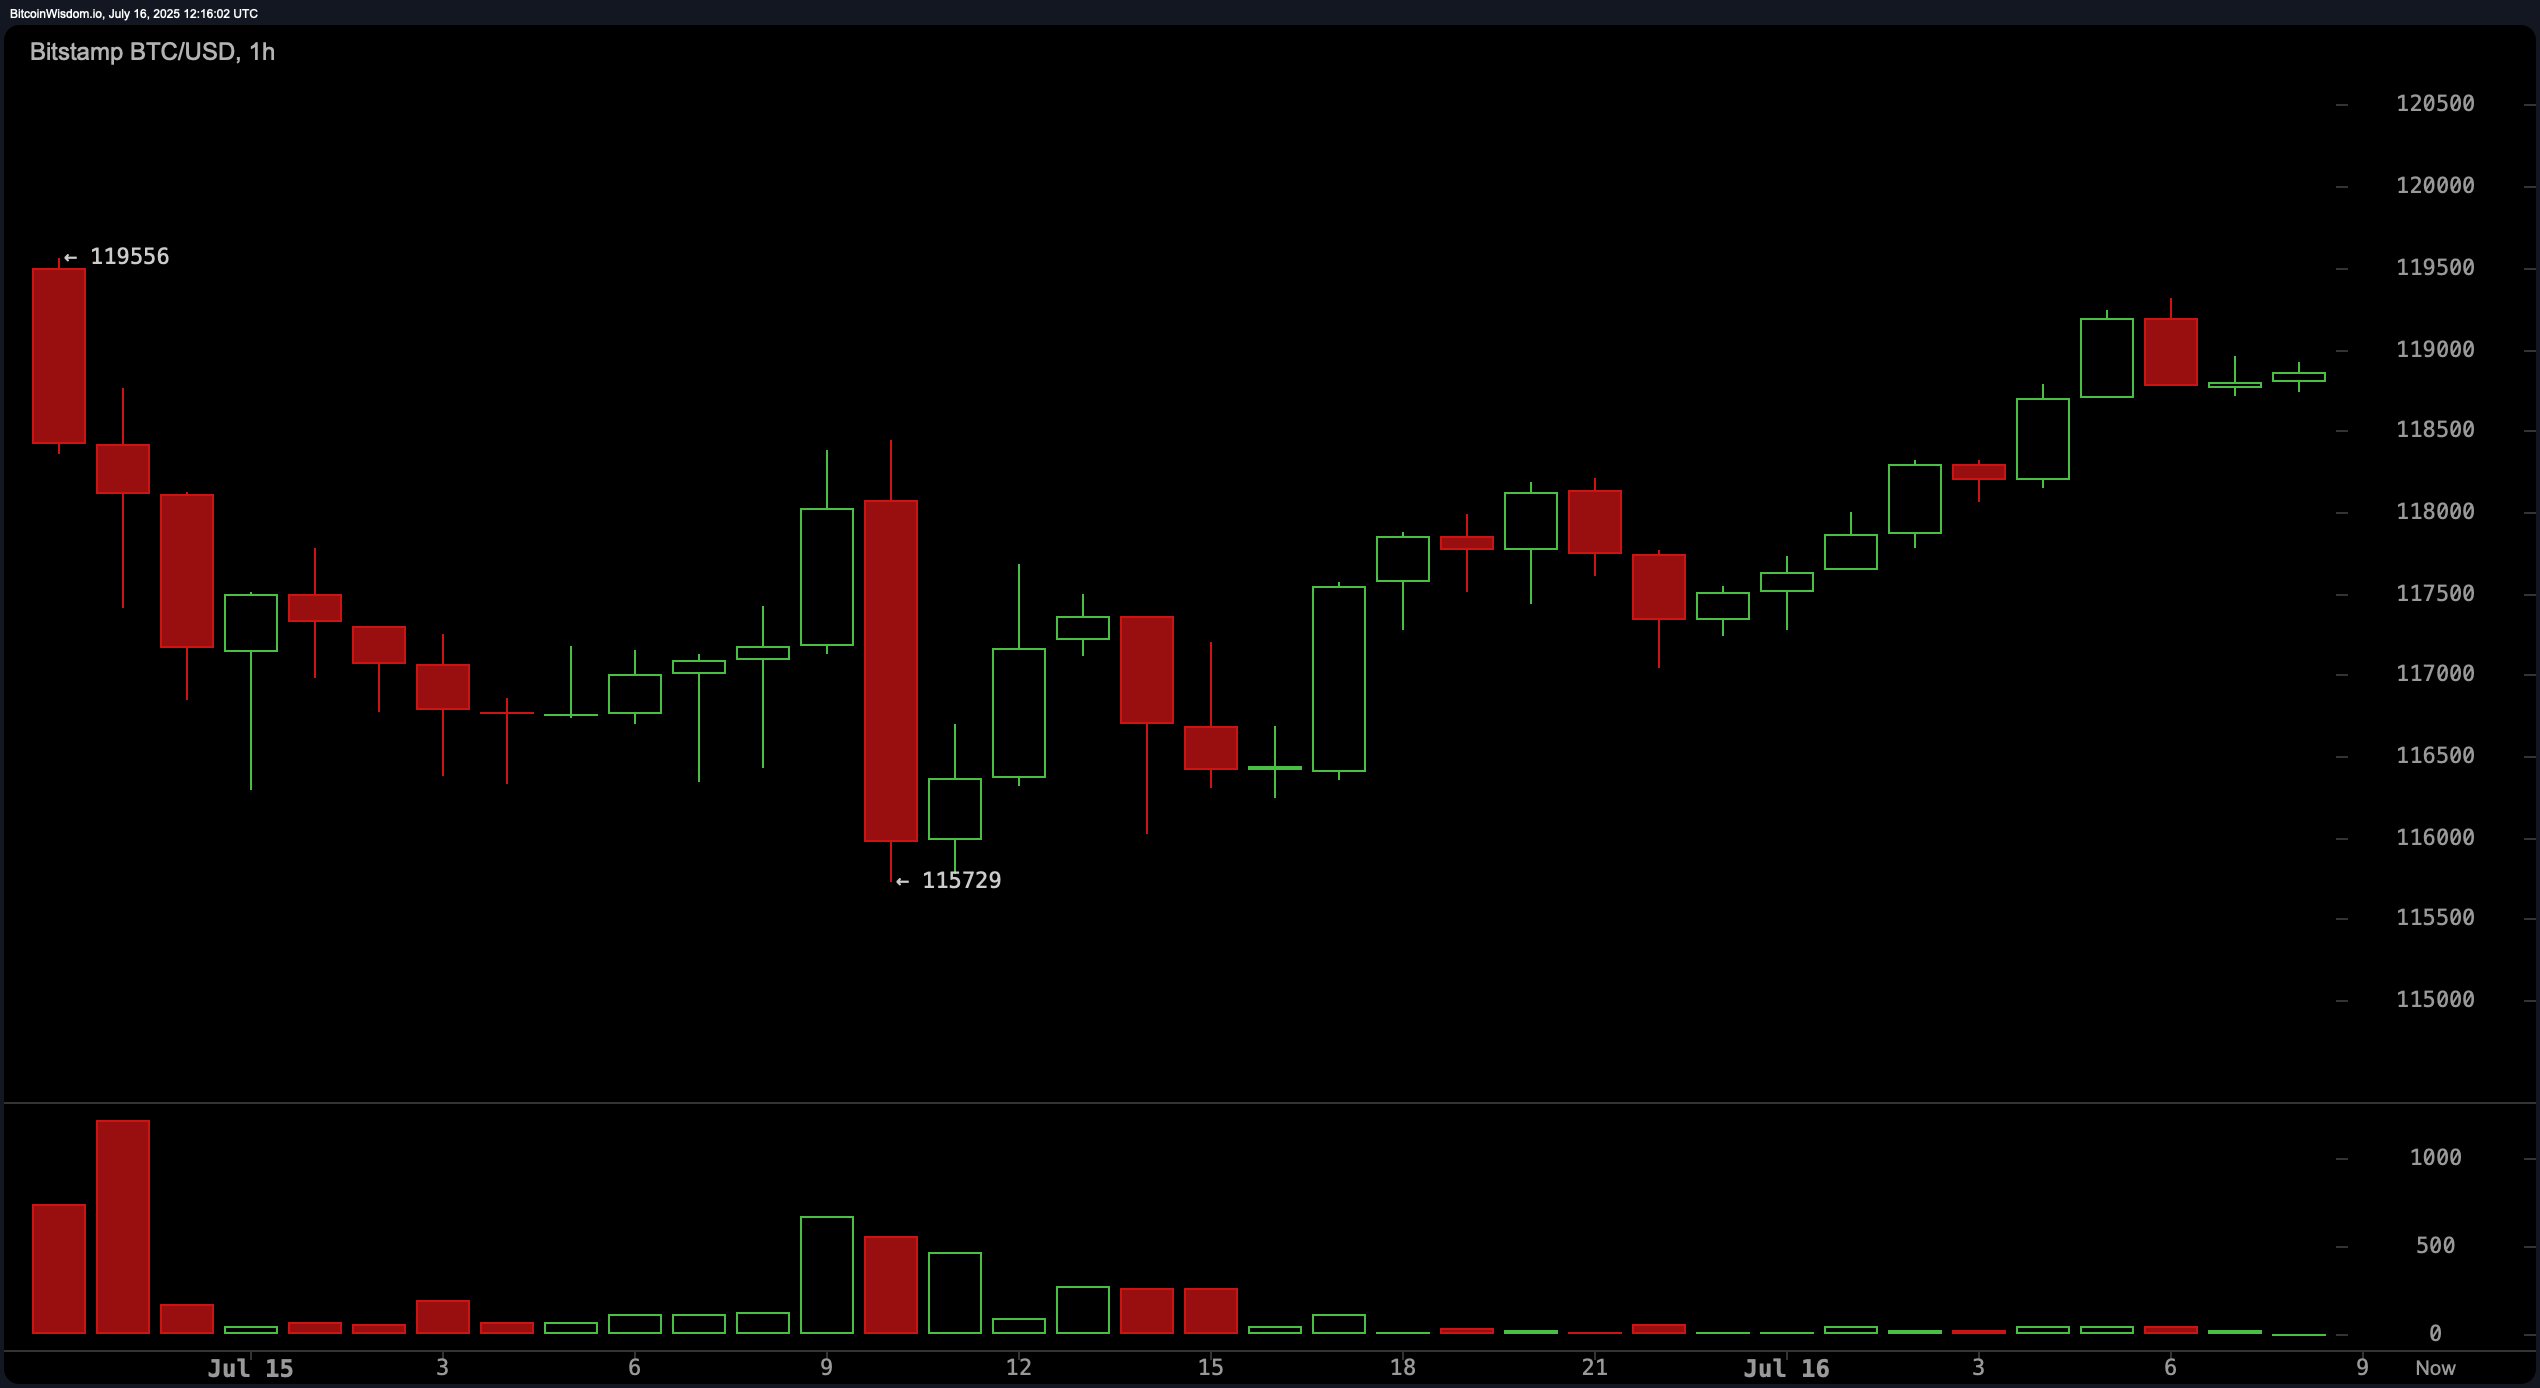
The 1-hour bitcoin chart shows a gradual recovery supported by a pattern of higher lows, suggesting improving short-term momentum. Support is observed at $115,729 and resistance at $119,556, making these the key pivot levels for intraday strategies. Notably, volume remains low, highlighting market indecision or low conviction among traders. A breakout above $119,556 could attract momentum buyers, especially scalpers aiming for near-term gains. However, any drop below $117,500 accompanied by an increase in sell volume could serve as a warning signal.

BTC/USD via Bitstamp on July 16, 2025, 1-hour chart.
From a technical indicator standpoint, oscillators present a mixed outlook. The relative strength index (RSI) stands at 70, signaling neutrality, while the Stochastic at 75 also remains neutral. The commodity channel index (CCI) is at 104, issuing a bearish signal, in contrast to the momentum indicator at 9,657 and the moving average convergence divergence (MACD) level of 3,396, both suggesting a bullish setup. The average directional index (ADX) at 25 and the Awesome oscillator at 9,866 remain neutral, reinforcing the notion of a market in wait-and-see mode.
Moving averages overwhelmingly support a bullish structure across all key timeframes. The 10-day exponential moving average (EMA) and simple moving average (SMA) are at $116,016 and $115,527 respectively, both showing bullish signals. This trend persists through the 20-day, 30-day, 50-day, 100-day, and 200-day EMAs and SMAs, all of which are aligned above key support levels and confirming underlying strength. With the 200-day EMA at $97,326 and the 200-day SMA at $97,361, the long-term trend remains firmly positive. However, without a decisive breakout above $120,000, near-term upside could be capped, and traders should manage risk accordingly.
Bull Verdict:
If bitcoin decisively breaks above $120,000 with increasing buy-side volume, it could validate a continuation of the broader bullish trend. Momentum indicators like the moving average convergence divergence (MACD) and momentum suggest strength, while the full alignment of exponential and simple moving averages across all timeframes underpins long-term upside potential.
Bear Verdict:
A failure to reclaim the $120,000 level with conviction, particularly if accompanied by a rise in sell volume below $117,500, may indicate weakening bullish momentum. The commodity channel index (CCI) already signals a sell, and subdued volume on rebounds points to a market still vulnerable to deeper corrections or a range-bound drift.
免责声明:本文章仅代表作者个人观点,不代表本平台的立场和观点。本文章仅供信息分享,不构成对任何人的任何投资建议。用户与作者之间的任何争议,与本平台无关。如网页中刊载的文章或图片涉及侵权,请提供相关的权利证明和身份证明发送邮件到support@aicoin.com,本平台相关工作人员将会进行核查。


