
Bitcoin has been oscillating near its previous highs, with friends experiencing extreme fluctuations in both surges and drops, which is actually quite normal.
First, there is the issue of unreliable tariffs. Many friends are very anxious; in February of this year, due to tariff issues, Bitcoin dropped from 110,000 to a low of 74,500, losing several tens of thousands of points. Therefore, the tariff issue has been hanging over us. Additionally, there is the issue of interest rate cuts, which have not received a clear response yet, but the probability of a rate cut in September or October is relatively high. Moreover, in recent years, there has been a wave of market activity every September and October, so we will see if this year can continue that trend.
However, the more critical point is to understand the purpose behind these unreliable actions. Whether it can exacerbate the volatility of the financial market and reduce debt is uncertain, but the consortium behind it and its own frenzied profit-making in the capital market are real. The world is essentially a makeshift stage; complaining is useless, and adaptation is key.
Furthermore, the three major U.S. stock indices are performing strongly, having either broken through historical highs or are just below them, which indirectly reflects that tariffs have less impact on the stock market. As Bitcoin is considered a safe-haven asset, there is no need to elaborate further. Now, both Wall Street and many listed companies are accumulating Bitcoin, so what do we, as small investors, have to worry about?
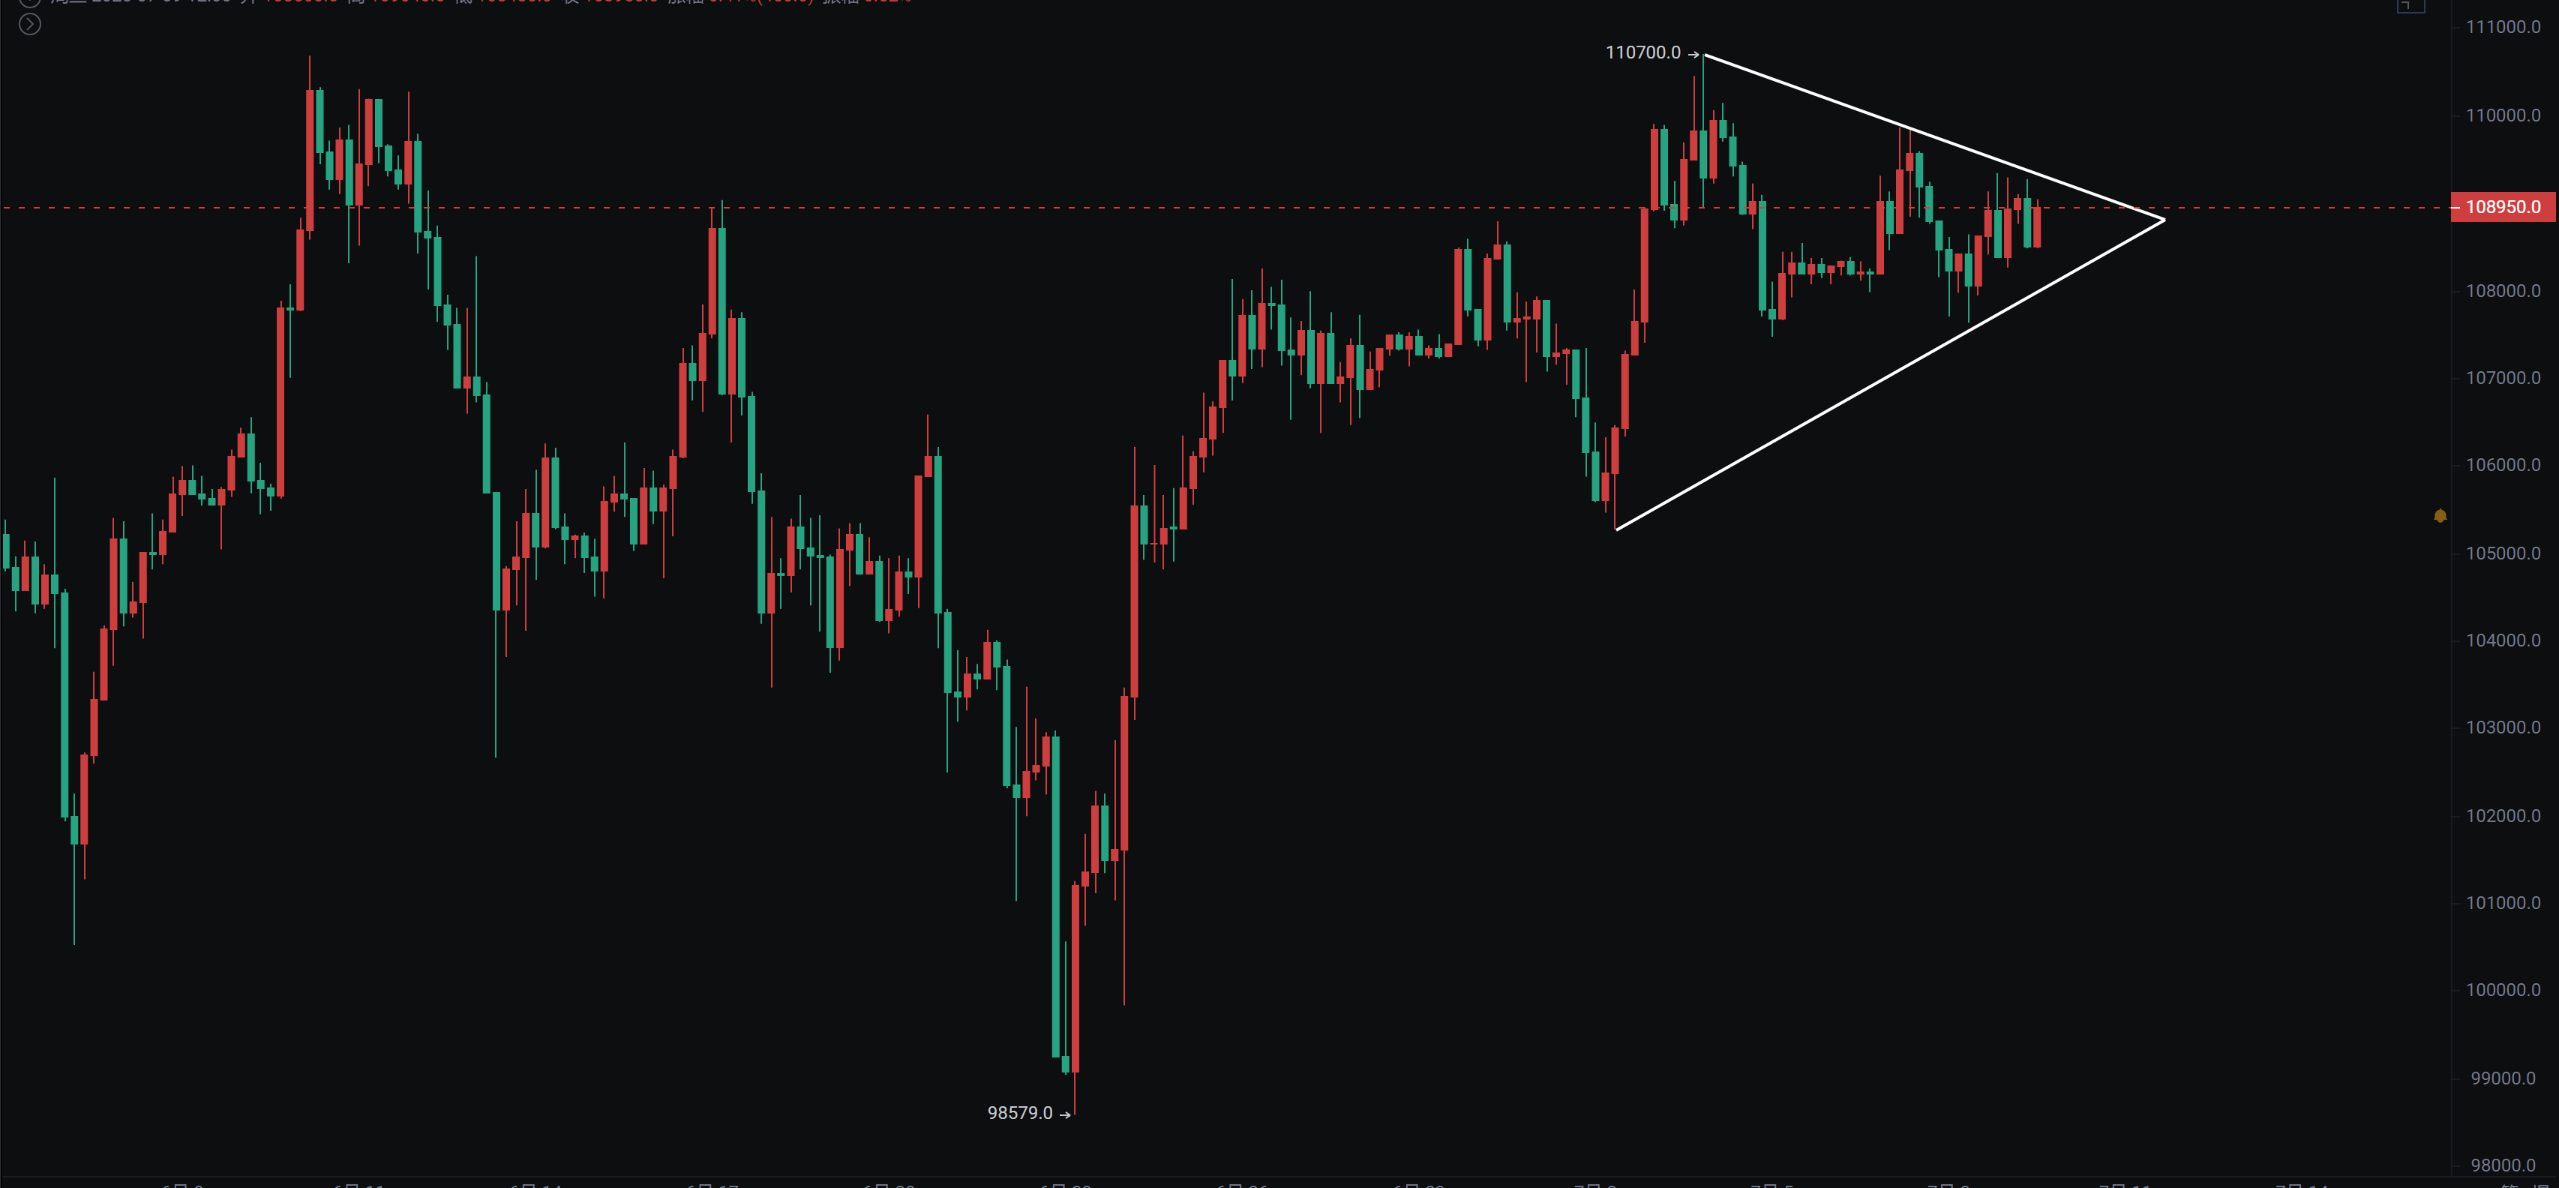
Bitcoin
The volatility of Bitcoin is decreasing, with fluctuations within 1,000 points. The probability of closing a doji star this week is high. If we look at the weekly closing, it has already reached the highest weekly level in history, and the daily lines are above the three moving averages. The bullish sentiment remains strong, with the predicted high point for this round being between 180,000 and 250,000, though the timing is uncertain.
The daily chart shows slight bearish divergence at the top. If you have been holding from the bottom, you can continue to hold. If you haven't entered yet, you might want to wait for some pullbacks or a real breakthrough before entering, as the current cost-effectiveness is not high…
On the 4-hour chart, there is a chance to pull back to 105,000 to 106,000 for consideration.
Support: 105,000 to 106,000
Resistance: 110,000 to 112,000
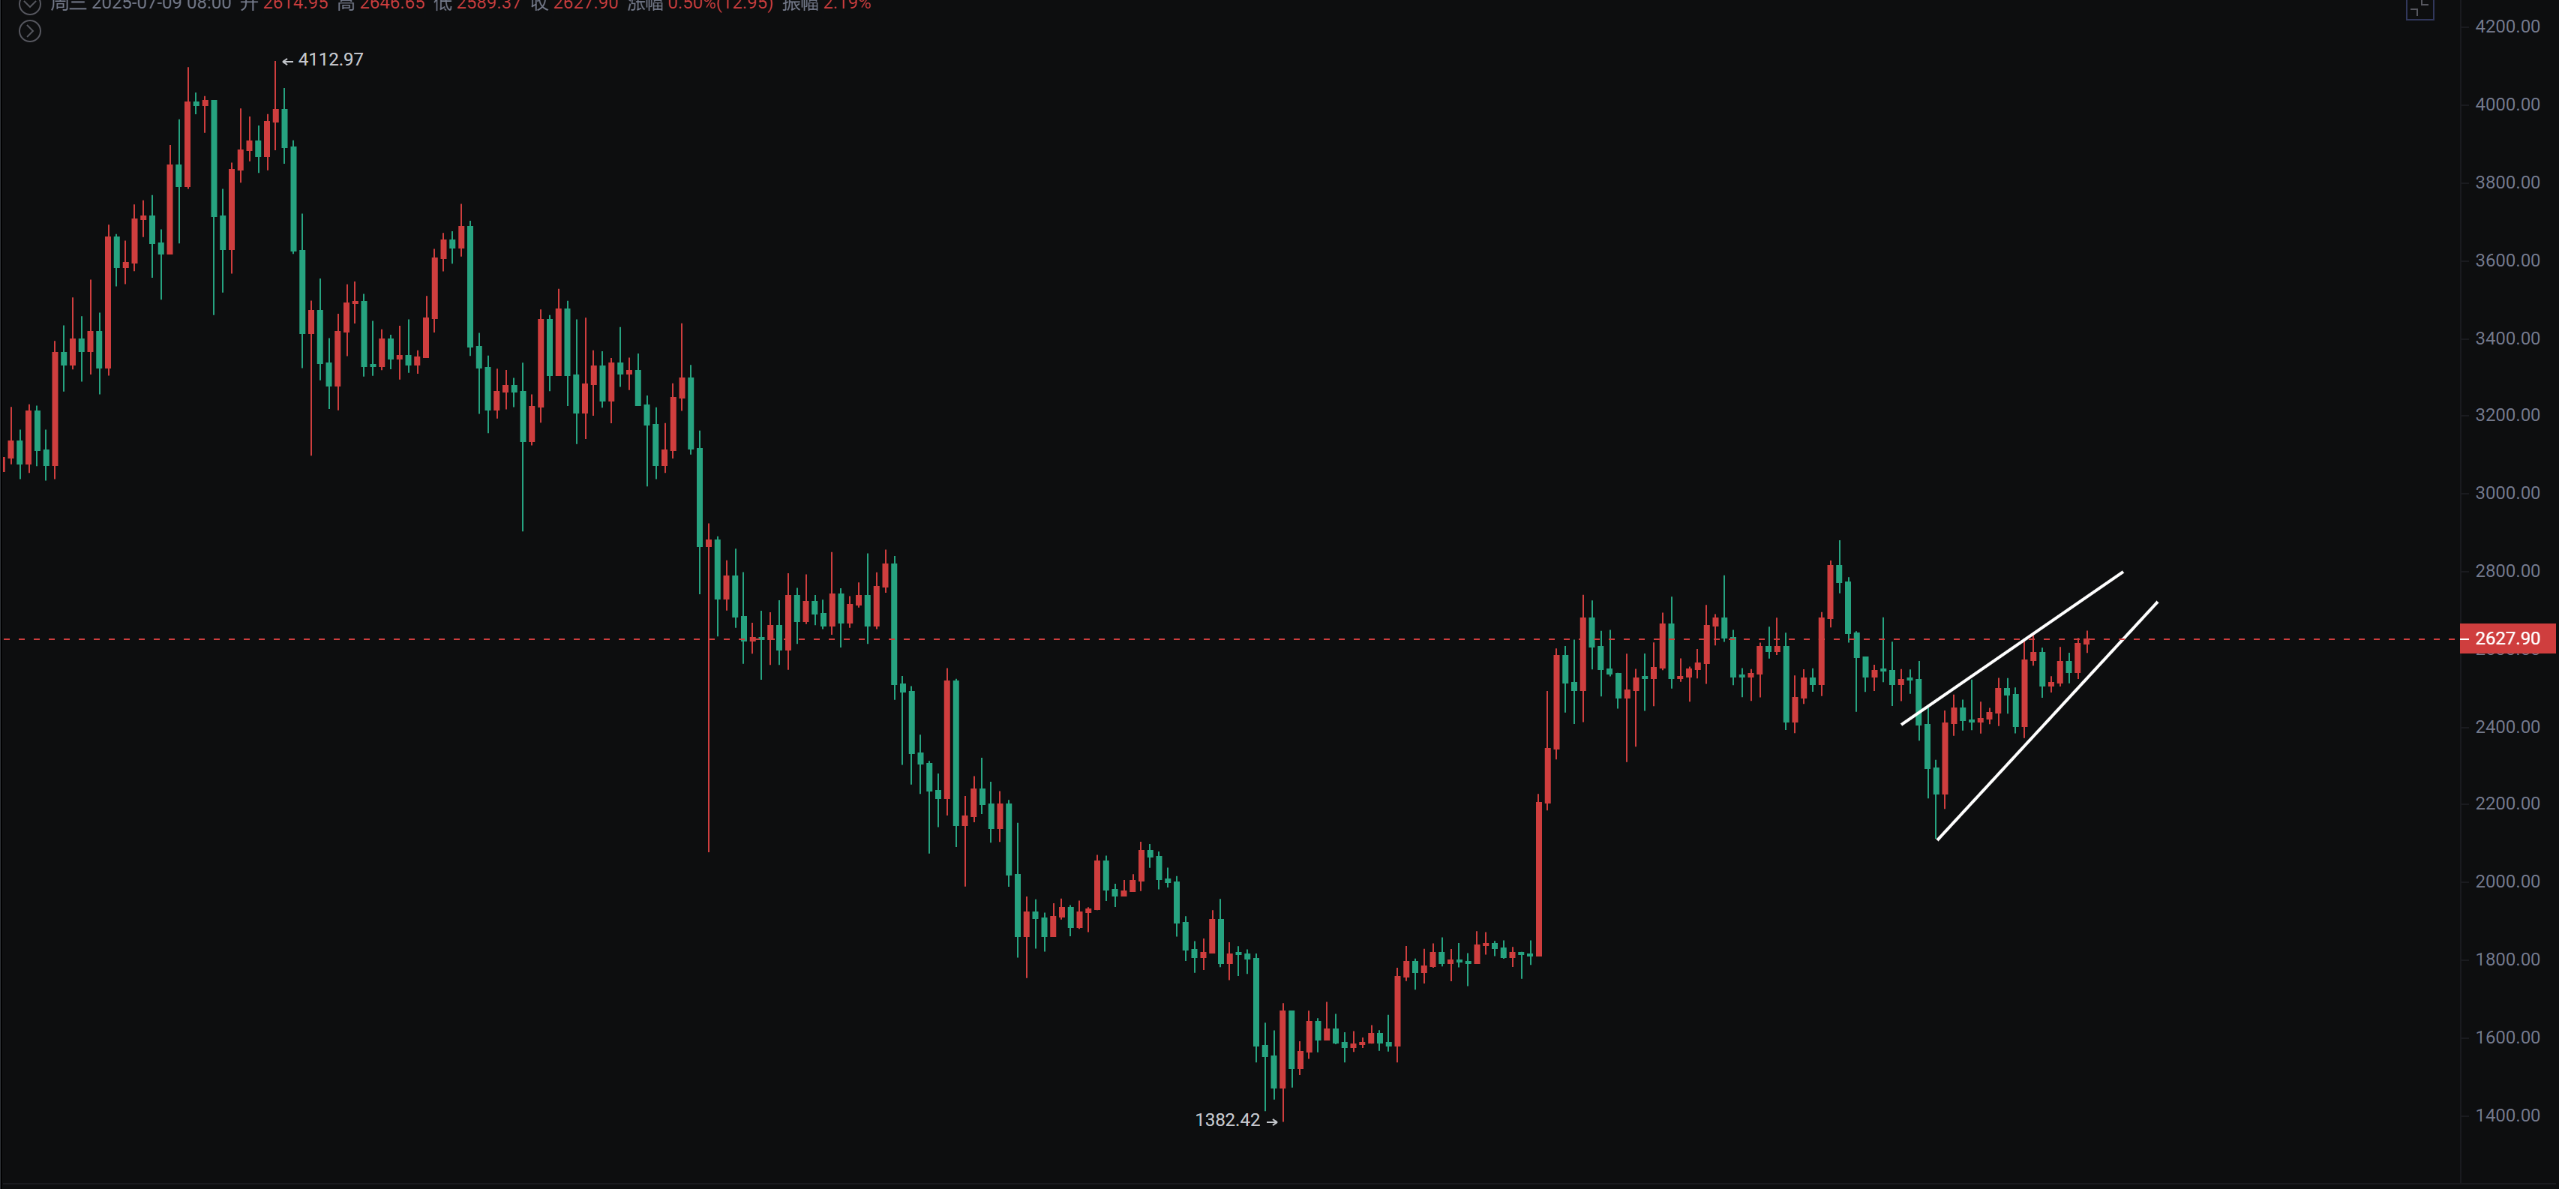
Ethereum
The ETH/BTC exchange rate rebound has driven Ethereum to catch up. Yesterday, I mentioned that as long as the daily line stays above the three moving averages, I remain bullish, and the RSI indicator has broken through multiple levels. If Ethereum recovers above 2,300, I said it would reach the top of the range at 2,700 to 2,800. Currently, the daily line is forming a rising wedge, so pay attention to the potential drop at the end of the wedge.
Support: 2,300 to 2,400
Resistance: 2,700 to 2,800
If you like my views, please like, comment, and share. Let's navigate through the bull and bear markets together!!!
This article is time-sensitive and for reference only; it is updated in real-time.
Focusing on K-line technical research, sharing global investment opportunities. Public account: BTC Trading Prince Fusu

免责声明:本文章仅代表作者个人观点,不代表本平台的立场和观点。本文章仅供信息分享,不构成对任何人的任何投资建议。用户与作者之间的任何争议,与本平台无关。如网页中刊载的文章或图片涉及侵权,请提供相关的权利证明和身份证明发送邮件到support@aicoin.com,本平台相关工作人员将会进行核查。


