This is not just a capital raise; it also indicates the previously unmet market demand for stablecoins in the public market.
Author: Alkimiya
Translated by: Deep Tide TechFlow
"An accurate estimate of intrinsic value is the foundation of stable, rational, and potentially profitable investments."
— Howard Marks
Introduction
Circle's milestone listing in the public market highlights the growing demand from institutions for regulated crypto infrastructure. However, the sustainability of its valuation depends on the expansion of its core revenue engine, which is closely related to the total supply of USDC.
This article aims to shift from narrative to data measurement. Over 95% of Circle's revenue comes from channels related to USDC, making it highly sensitive to short-term interest rates and the total circulation of USDC. We first structurally decompose the supply curve of USDC, analyzing changes in on-chain concentration, relative capital liquidity, and inflection points under specific market conditions to identify the variables that most drive minting activity.
Next, we introduce a recalibrated Auto-Regressive Model that can predict weekly supply with an error margin of approximately ±1.5%, directly translating incremental expansion into sensitivity for EBITDA (Earnings Before Interest, Taxes, Depreciation, and Amortization).
Finally, as a conclusion, we demonstrate how to use this supply metric as a real-time tradable signal, providing market participants with a real-time proxy for Circle's fundamental dynamics.
Circle Valuation Structure Analysis
Based on a market capitalization of $58.2 billion, Circle's price-to-earnings (P/E) multiple has exceeded Visa's by nearly 8 times (Visa's P/E is about 15 times). The steadfast investments from high-profile institutions like ARK Invest and BlackRock indicate that investors are not only pricing in the current fundamentals but are also betting on its potential for widespread adoption in the future.
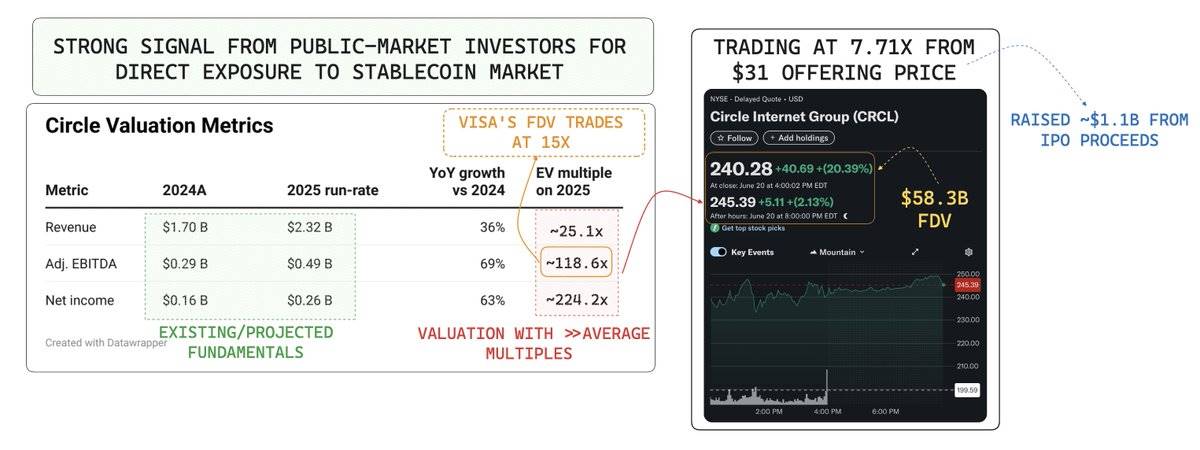
Circle's valuation metrics stock code screen - Data source: Yahoo Finance
To maintain its current valuation, Circle must continue to demonstrate a strong trajectory of earnings growth. Historically, over 95% of Circle's revenue comes from the interest and dividends generated by its fiat asset reserves for stablecoins (such as bank cash, short-term U.S. Treasury bonds, and the Circle Reserve Fund managed by BlackRock). Therefore, its revenue is highly sensitive to short-term interest rates and the circulation of USDC.
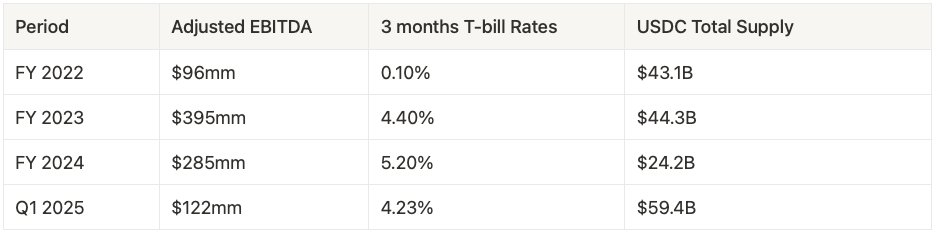
Data source: SEC
EBITDA Sensitivity Decomposition

Where:
Net Interest Margin (NIM): Interest income earned from yield-bearing assets (such as U.S. Treasury bonds).
Supply Flow-Based Fees: Fees generated from the minting and redemption of USDC.
As the Federal Reserve approaches interest rate cuts, the net interest margin (NIM) will be compressed, and the market is pricing in a shift where revenue growth based on transaction volume will outpace the impact of interest rate compression.
This growth relies on the continued adoption of USDC as a global payment network, with its fee capture ability expanding with usage velocity, cross-border capital flows, and ecosystem integration. Therefore, studying the supply dynamics of USDC is crucial. It is not only a leading indicator of Circle's future revenue streams but also a core anchor for its valuation, providing real-time insights into the development of its business model.
Stablecoin Supply Dynamics Analysis
Currently, the total supply of stablecoins has surged to $251 billion, reaching an all-time high, which is a 34% increase from the previous cycle peak of $187 billion in 2021. This growth reflects significant capital inflows and a rebound in confidence in the crypto ecosystem.
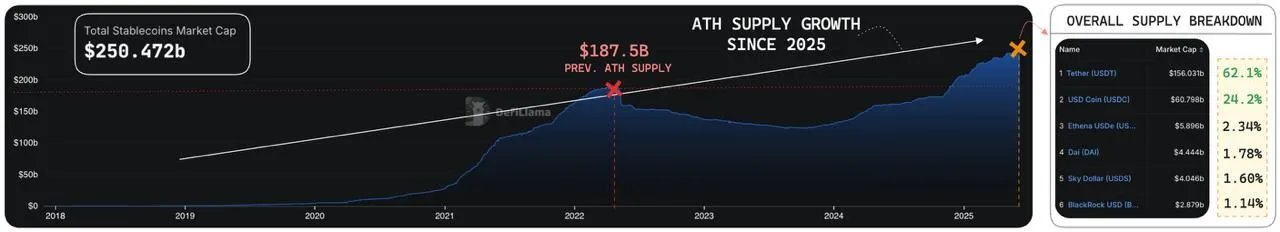
Historical total supply of stablecoins - Data source: DefiLlama
Currently, USDT and USDC account for over 86% of the total supply of stablecoins. Among them, USDT leads with a market share of 62.1%, followed closely by USDC at 24.2%. These two stablecoins play foundational roles in different ecosystems, especially USDC, whose development trajectory provides a more transparent view of regulated, institutional-level demand.
To understand supply performance in market cycles, we start with a simple supply flow formula:
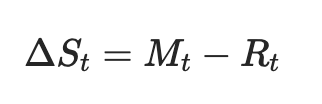
Where:
ΔSt: Net change in total stablecoin supply
Mt: Minting volume (fiat → stablecoin)
Rt: Redemption volume (stablecoin → fiat)
Translation: Deep Tide TechFlow
This dynamic reveals the core logic of stablecoin supply:
Expansion: Supply increases when minting volume exceeds redemption volume.
Contraction: Supply decreases when redemption volume exceeds minting volume.
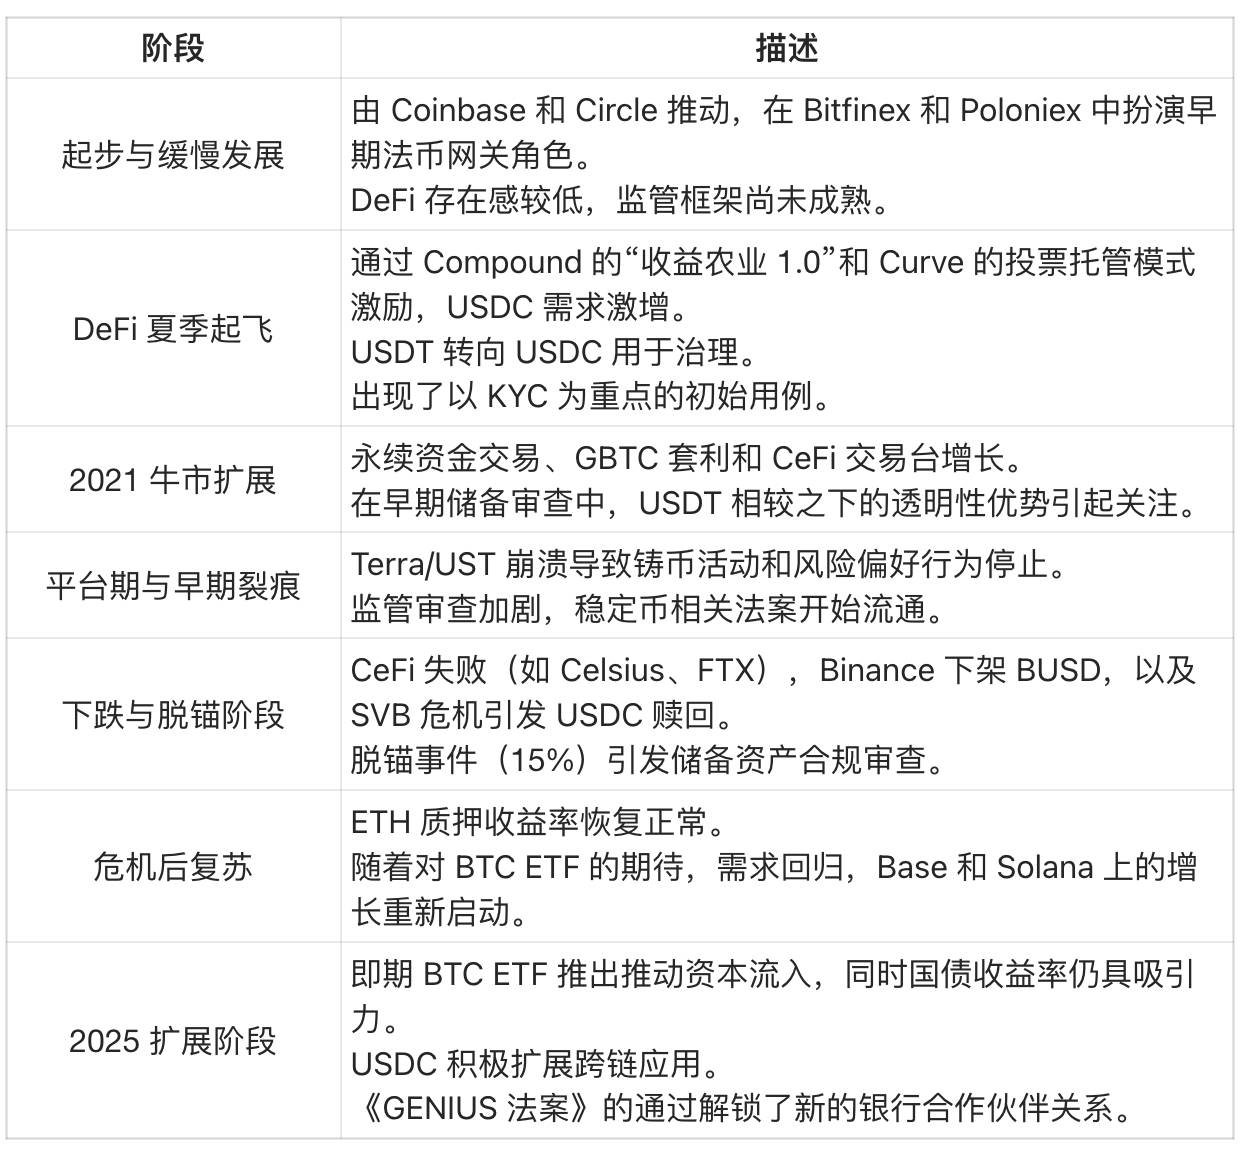
By observing the historical changes in USDC from the perspective of expansion and contraction, we can find that its supply changes are closely related to significant inflection points on the overall timeline of the crypto industry.
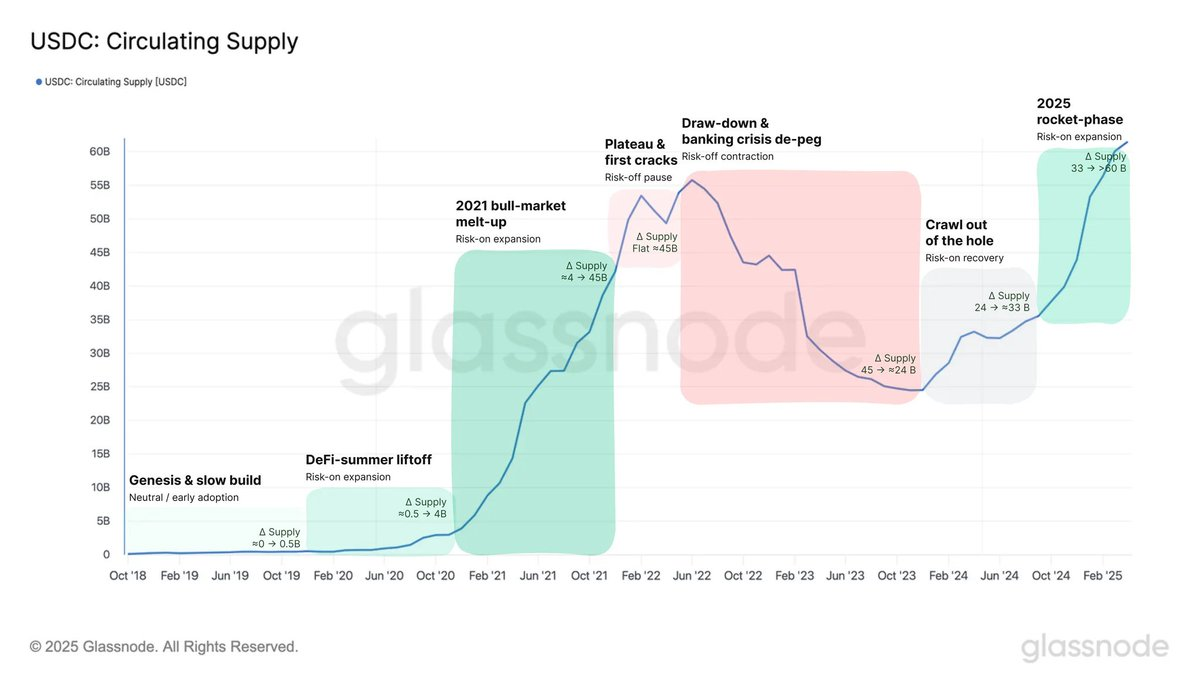
USDC circulating supply - Data source: Glassnode
Translation: Deep Tide TechFlow
Accelerated Expansion (2025 and Beyond)
With Circle's listing, the current circulating supply of USDC has reached a historic high of $61.2 billion. This scale reflects USDC's evolution from a simple transactional stablecoin to a recognized core financial primitive. Since 2021:
Daily trading volume has increased by 406%, jumping from $7.77 billion to $31.52 billion.
Daily active users have rapidly grown at a compound annual growth rate (CAGR) of 142.92% since 2020, reflecting its rapid adoption across major ecosystems.
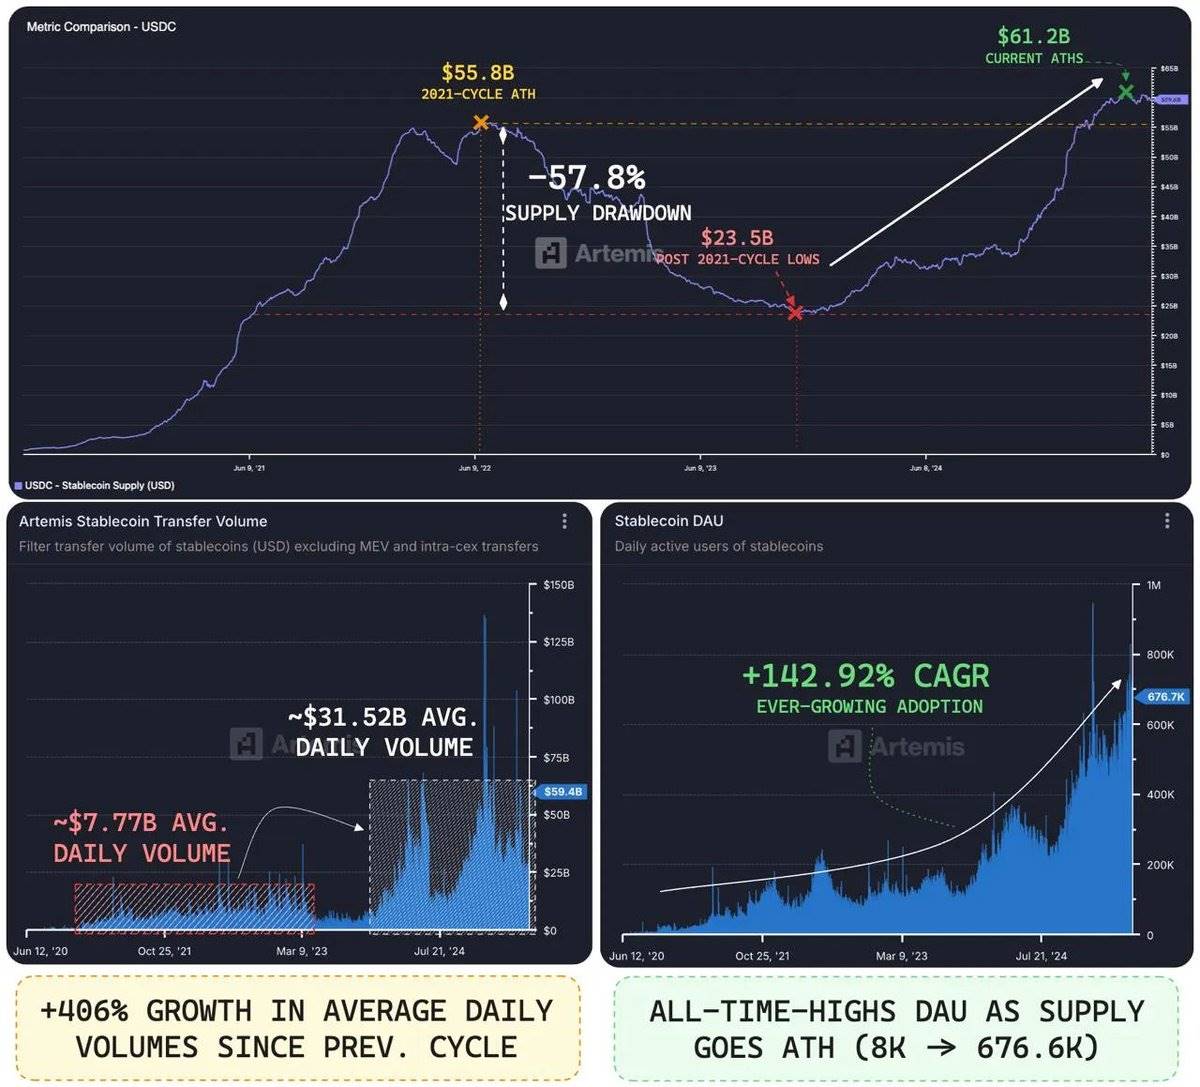
Circle USDC metrics - Data source: Artemisxyz
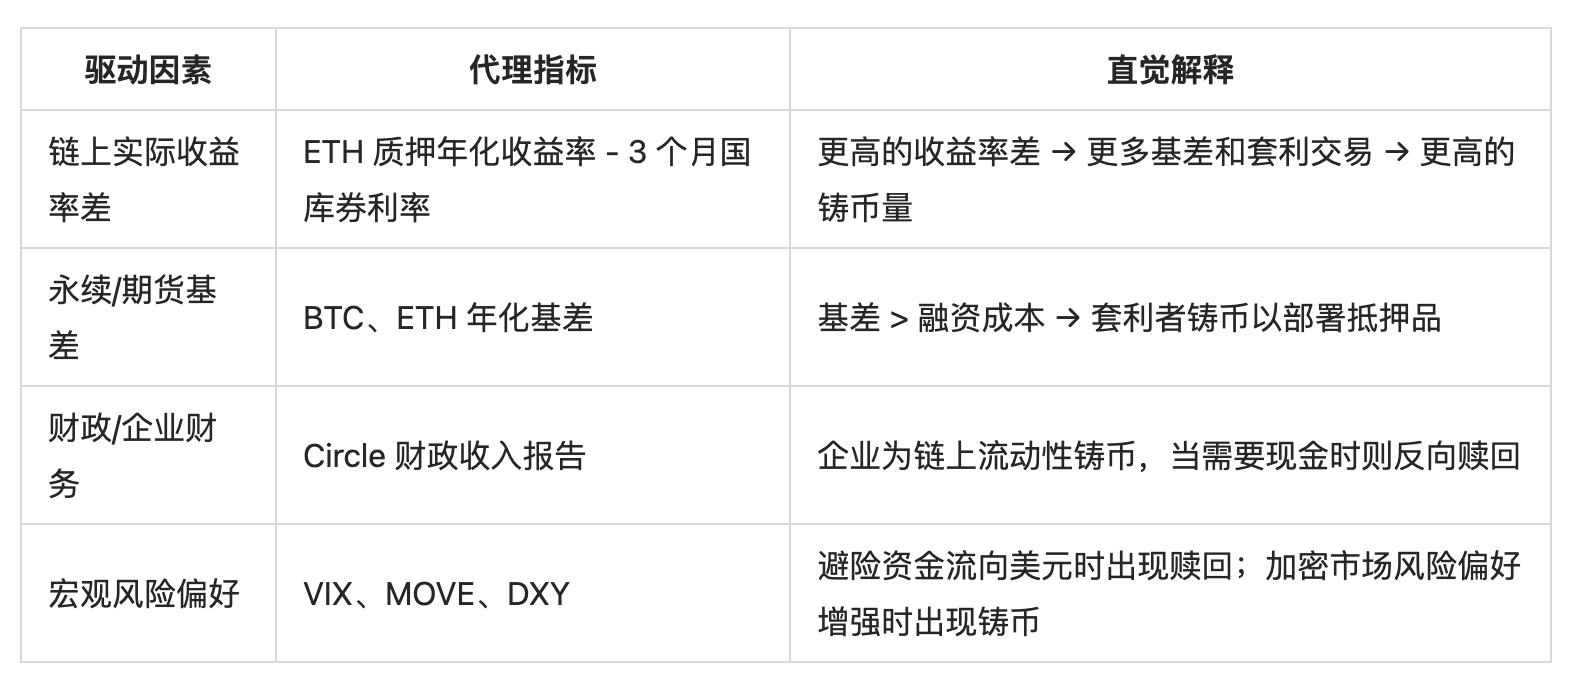
The growth of USDC is primarily driven by three forces:
Revival of DeFi: Renewed interest and participation from the crypto-native user base.
Adoption by Traditional Finance (TradFi): Gradual acceptance by a broader traditional finance audience in settlement, cash management, and capital allocation.
Strategic Partnership with Coinbase: By partnering with Coinbase, one of the largest crypto user bases globally, USDC has gained unparalleled distribution advantages in retail, institutional, and on-chain ecosystems.
Capital Efficiency Reveals True Value
Looking solely at supply is not enough to reflect the actual utility of stablecoins. More importantly, the real value of stablecoins lies in the efficiency of their capital flow.
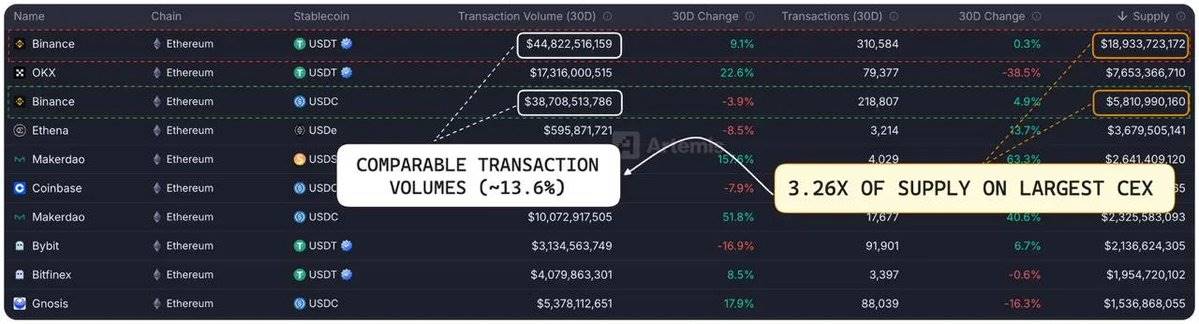
Stablecoin trading volume comparison - Data source: Artemisxyz
On the Binance platform, USDT dominates with a supply of $18.9 billion, while USDC's supply is only $5.81 billion, about one-third of USDT.
However, in terms of trading volume, the gap nearly disappears. In the past 30 days, USDT's trading volume was $44.8 billion, while USDC reached $38.7 billion, trailing by only 13.6%.
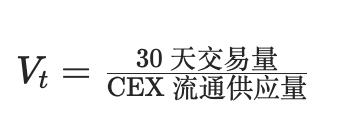
By calculating the velocity of capital (i.e., 30-day trading volume divided by circulating supply), we can quantify capital efficiency:
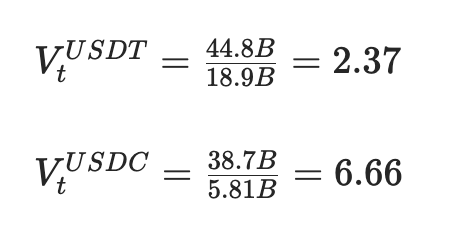
Applied to USDT and USDC:
Data source: DefiLlama, Visaonchain
The results show that the velocity of USDC is 2.81 times that of USDT, meaning that each dollar of USDC is traded nearly three times as frequently as USDT. This indicates that USDC has faster capital flow and higher utility, demonstrating a deeper on-chain value.
On-Chain Growth: Expanding to Alt-VM and Layer 2
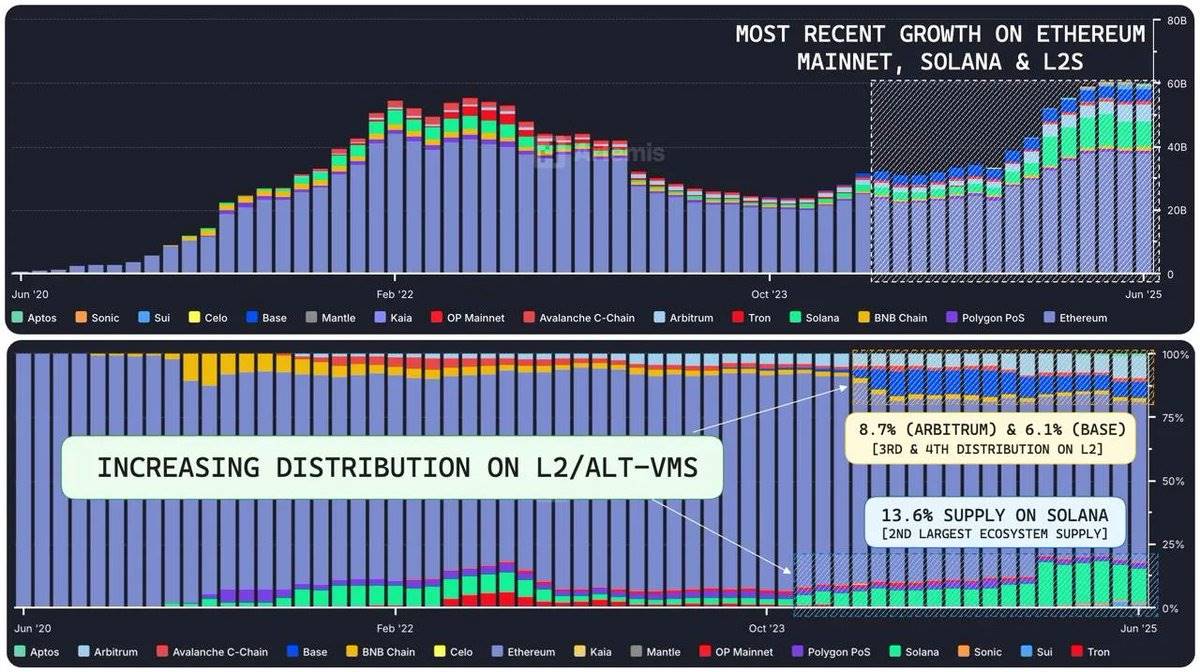
On-chain supply distribution of USDC - Data source: Artemisxyz
The supply growth of USDC has gradually shifted from being Ethereum-centric to a broader ecosystem, including Solana, Ethereum Layer 2, and emerging Alt-VM chains.
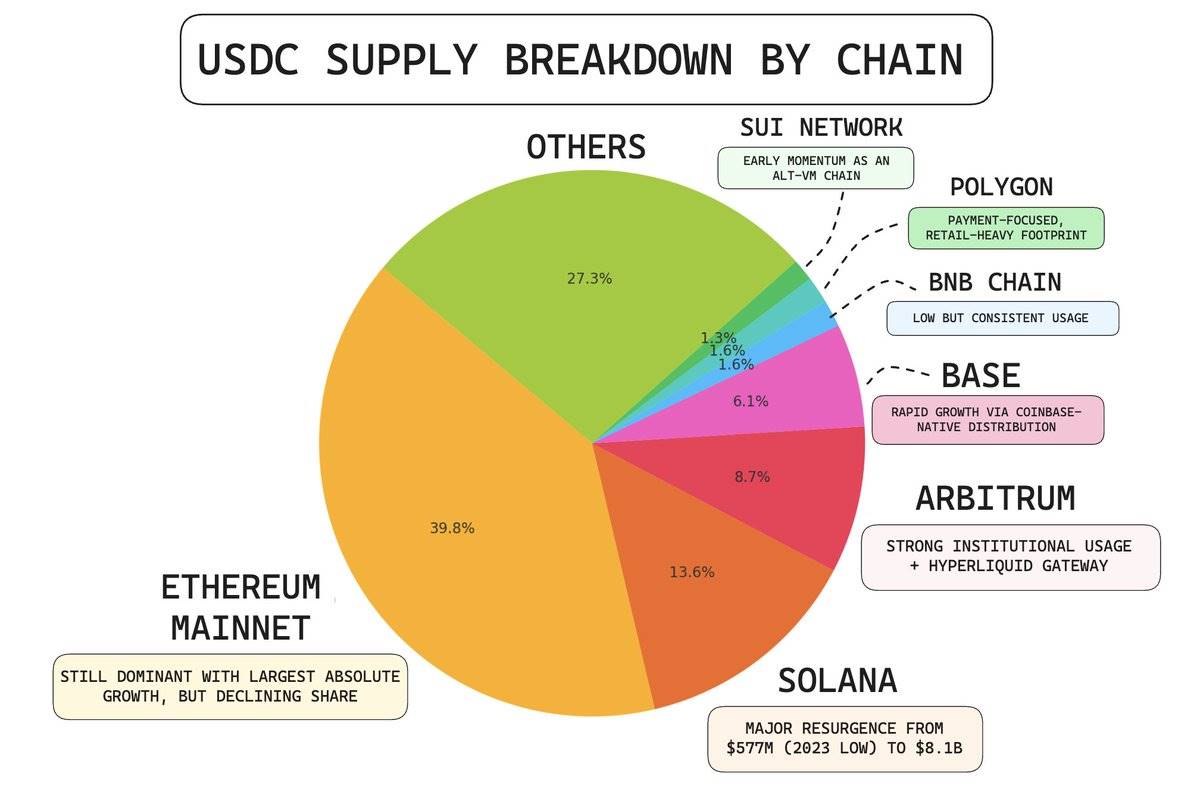
Current Circle USDC supply details - Source: Artemisxyz
Data shows that the supply of USDC is increasingly distributed across diversified ecosystems, aligning with areas of liquidity, settlement demand, and the fastest expansion of on-chain utility.
Dominance of USDC on Solana
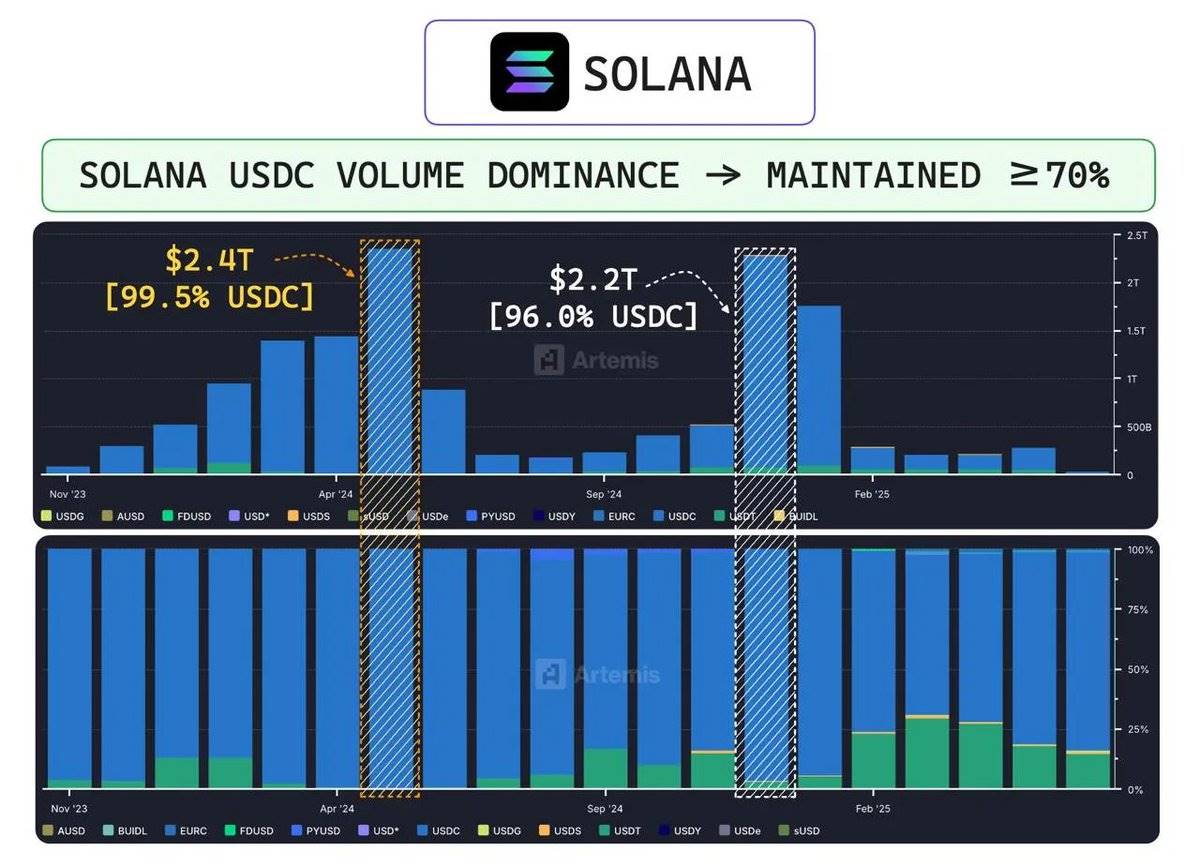
Historical trading volume of USDC on the Solana chain - Data source: Artemisxyz
By May 2024, USDC accounted for 99.5% of stablecoin trading volume on Solana. Even by December, as ecosystem activity became more diversified, USDC still maintained a 96% market share.
The Flippening of Arbitrum
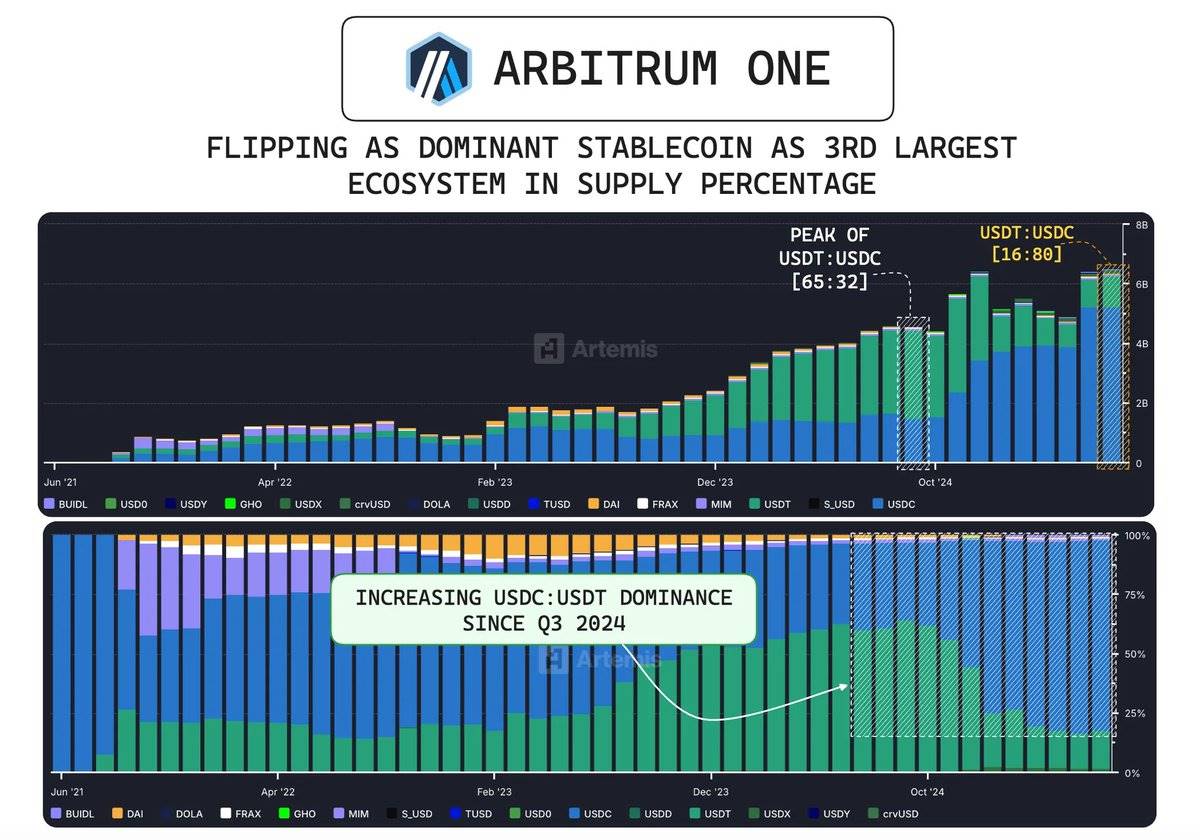
Changes in USDC supply on ArbitrumOne - Data source: Artemisxyz
In September 2024, USDC quietly surpassed USDT on Arbitrum to become the dominant stablecoin. At its peak, the supply ratio of USDT to USDC was 2.03 (meaning Tether's supply was more than double that of USDC). Today, this ratio has dropped to 0.2.
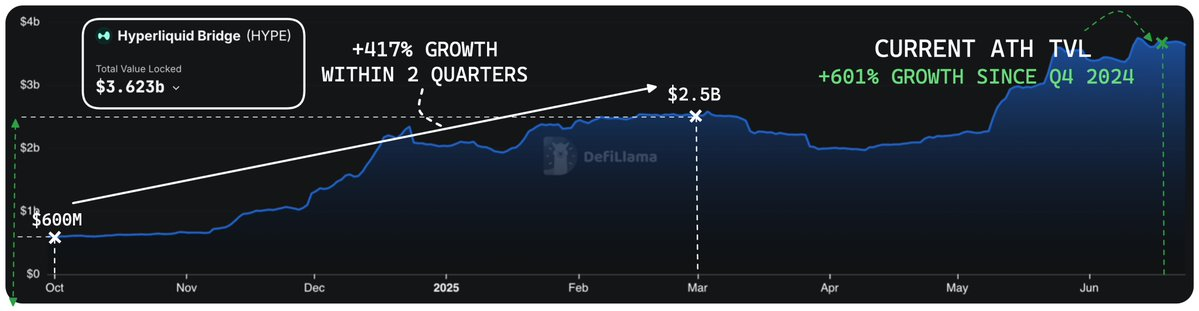
Driving force of Hyperliquid - Data source: DefiLlama
This reversal is primarily due to the explosive growth of Hyperliquid, whose total value locked (TVL) surged from $600 million in Q4 2024 to $2.5 billion by the end of Q1 2025, an increase of 417%. As of now, Hyperliquid's bridged deposits have reached a historic high of $3.62 billion, a 601% increase compared to the Q4 baseline.
This change reflects a unique structural fit between Arbitrum's core ecosystem and its expanded integration, creating conditions for the dominance of stablecoins.
Quantitative Model of USDC Supply Curve: Capturing Stablecoin Supply Dynamics
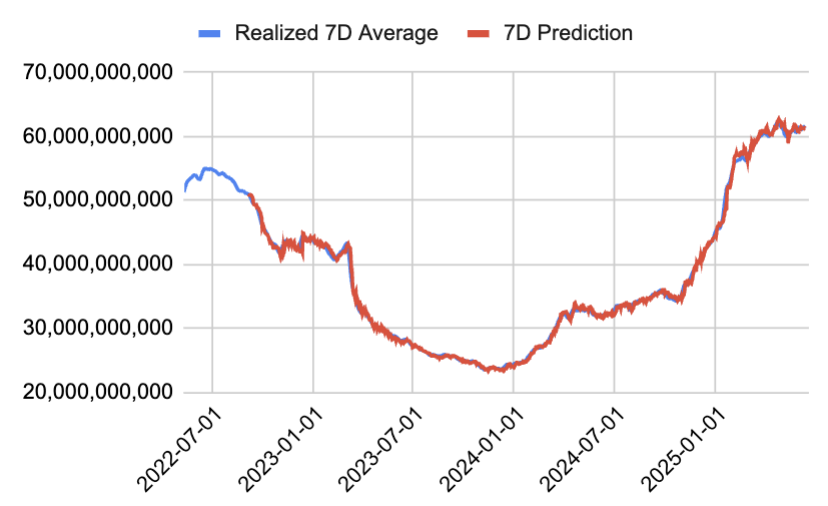
Given the importance of USDC supply dynamics, we constructed an Auto-Regressive (AR) model to predict the total supply of USDC. We chose the AR model for its simplicity, transparency, and good performance in the local linear growth pattern of the USDC supply curve.
Data source: Internal model
The model is recalibrated every 90 days to capture the latest market trends while ensuring that the sample size used for regression and matrix calculations is robust enough. Each prediction period has a dedicated model trained on a 90-day sliding window (7 independent regression models, each with a unique set of beta coefficients). The model uses moving averages (1 day, 3 days, 7 days, 14 days, and 30 days) as feature variables to predict the future n-day average of USDC supply, where n ranges from 1 to 7. The regression constant is set to zero to ensure that the model relies entirely on signal-driven data.
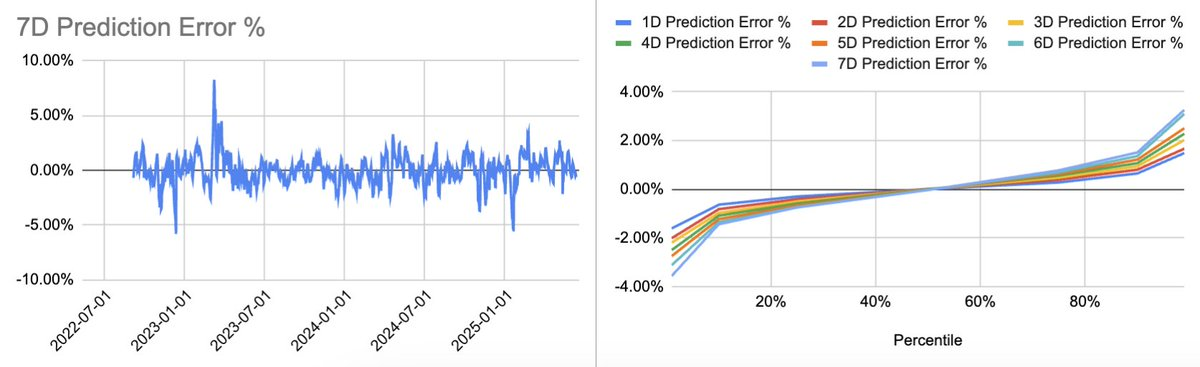
This method has proven very effective in predicting short-term directional changes in supply. Since 2022, the model's predicted 7-day average total supply of USDC has an 80% probability of falling within a ±1.5% range of the actual results.
Data source: Internal model
Conclusion
Circle's listing marks a significant turning point in the crypto industry. This is not just a capital raise; it also indicates the previously unmet market demand for stablecoins in the public market. Its performance highlights investors' deep interest in compliant digital dollar infrastructure, further solidifying Circle's position as the clearest public representative of this emerging asset class.
Currently, Circle's valuation has reached $58.2 billion, becoming a gateway for institutions entering the regulated digital liquidity space, with USDC at the core of this ecosystem. As USDC continues to embed itself in the expanding DeFi ecosystem and traditional financial systems, its role is transforming. It is no longer just a reflection of adoption rates but is becoming a real-time global liquidity barometer capable of reflecting capital flows, risk sentiment, and market positioning. So far, the only way to bet on this growth has been to trade Circle's stock, but the unique factors of the stock often obscure the underlying dynamics.
免责声明:本文章仅代表作者个人观点,不代表本平台的立场和观点。本文章仅供信息分享,不构成对任何人的任何投资建议。用户与作者之间的任何争议,与本平台无关。如网页中刊载的文章或图片涉及侵权,请提供相关的权利证明和身份证明发送邮件到support@aicoin.com,本平台相关工作人员将会进行核查。


