On the morning of June 24, as Trump announced Iran's complete agreement to a comprehensive ceasefire, the cryptocurrency secondary market rebounded after last night's fear of escalating war. BTC briefly fell below $100,000 before rising and breaking through the $106,000 mark, with many altcoins also looking to recover. Affected by the situation in the Middle East, BTC has been in a continuous pullback for nearly a week, hitting a low of $98,200 yesterday and quickly rebounding to $106,075 today, with an increase of over 8.02% during this period.
The Federal Reserve's dovish tone has resurfaced, with Fed Governor Bowman expressing support for a potential rate cut as early as July. Since Trump imposed tariffs on April 2, there has been a lack of significant inflationary pressure, which may allow the Fed to cut rates again.
With the positive news of the formal ceasefire between Iran and Israel, the crypto market has seen a significant rebound, with market capitalization recovering 6% from its low. The expectation of a rate cut from the Fed has also boosted market sentiment, as the "liquidity" brought by a rate cut is expected to initiate a new round of market trends. How BTC will perform next depends on the thoughts of traders in the market.
Related article: "Ceasefire between Iran and Israel expected, Fed turns dovish, BTC surges 8% overnight"
Macro Analysis Group
@Phyrex_Ni
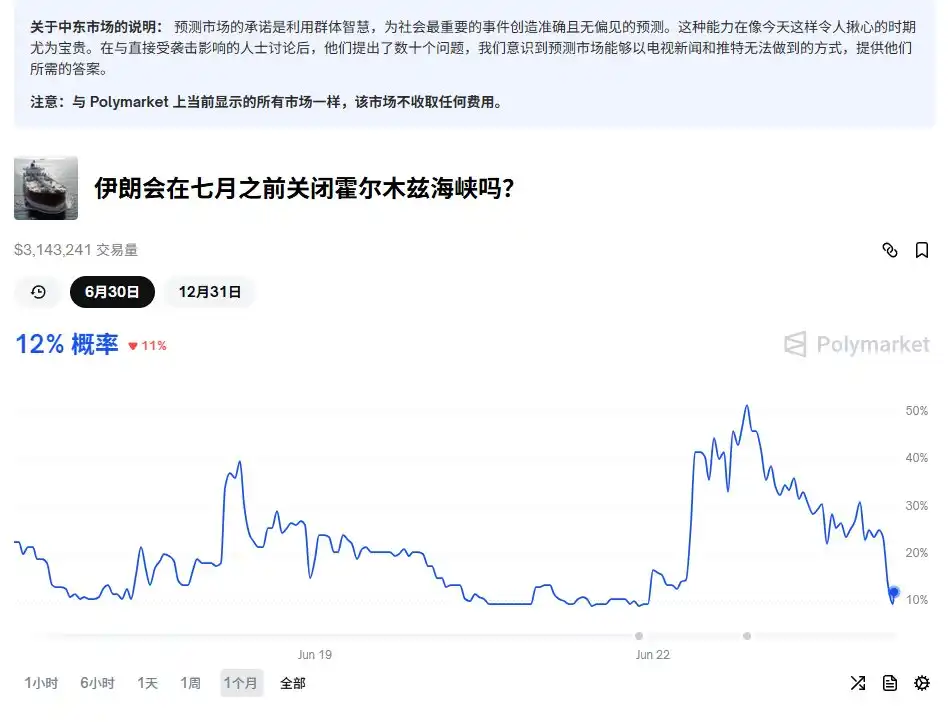
The market has seen a dual explosion of long and short positions today, with the core driving factor likely being the rapid change in oil price expectations, especially the market's reassessment of the possibility of closing the Strait of Hormuz. According to Polymarket data, this probability has now dropped to about 30%, reflecting the market's belief that Iran lacks actual blocking capabilities, thereby weakening concerns about rising oil prices, which have fallen to around $68.
In terms of the crypto market, although BTC has experienced significant volatility, on-chain data does not show obvious panic. Trading has mainly concentrated on short-term bottom fishers, while long-term investors remain cautious. Support remains solid in the $93,000–$98,000 range, while above $105,000, there is a hidden risk of a pullback due to short-term buying pressure. Overall, oil prices and war expectations remain key variables determining the volatility of risk assets.
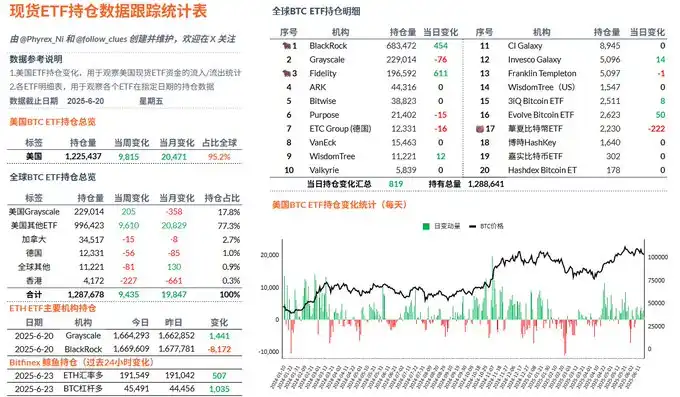
Last Friday, the inflow data for BTC ETFs remained normal, even though there were already signs of escalating conflict at that time, investors were generally still optimistic and did not sell off in large volumes.
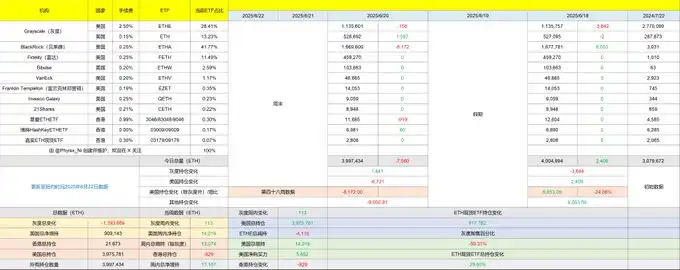
However, the data for ETH is not as good, especially as there has been no net inflow for 29 consecutive days, and during most of that time, the main inflow force, BlackRock, has seen outflows of over 8,000 ETH, leading to a poor overall situation on Friday, with even Hong Kong's Huaxia ETF seeing outflows of over 900 ETH.
Overall, ETH currently does not show the ability to break out independently; it did see a decent increase recently, but as we have emphasized, without sufficient liquidity, prices often struggle to maintain a breakout, and without liquidity, it is also difficult to drive the altcoin season that many investors are looking forward to.
@Cato_CryptoM
Currently, the market shows an optimistic performance regarding geopolitical and potential risks, with the mainstream view being that Iran and the U.S. are "just playing along." Geopolitical risks and energy price risks have temporarily eased, but that does not mean all risks are gone. If Iran takes actions beyond market norms, all views will be overturned, and I prefer to watch and see.
As for BTC's price, I also agree that the impact of geopolitical risks on price is gradually weakening, but the question remains: where will the short-term upward momentum for BTC come from after the geopolitical risks are lifted?
If the rate cut in July does happen, it could stimulate market sentiment. I am not extremely bearish on the market, but I wonder if there will be a resting phase after the short-term price breaks new highs.
Technical Analysis Group
@biupa
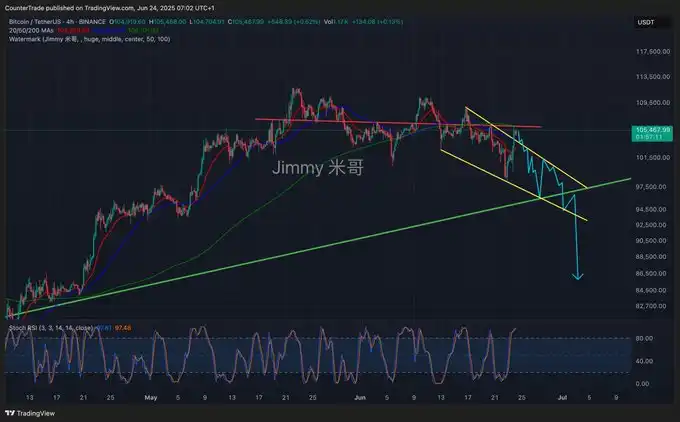
Although the market has rebounded due to positive news, there is resistance at $106,000 for BTC, and it is recommended to exit most of the bottom positions. While there is a certain degree of bearishness, I do not foresee a significant drop; it may enter a new round of market trends after the rate cut.
Looking horizontally, it seems that it has not "broken down" from the top range. Using horizontal support or indicators like VP TPO, one can indeed conclude that it has "not broken down." For example, those bullish on Credibull are based on this logic. (Such traders do not consider moving averages in their charts.)
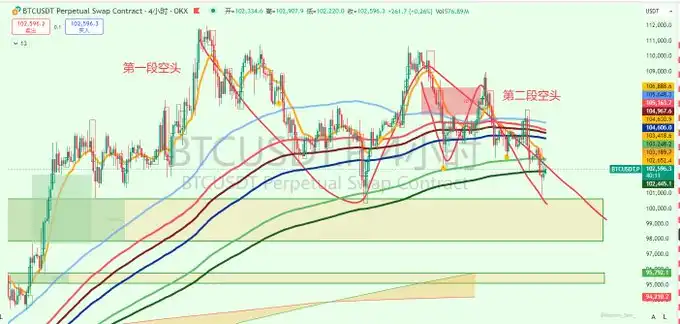
For me personally, moving averages are more important than horizontal ranges. It can be seen that June 6 was the first downward touch of 2x VEGAS, which quickly recovered after the spike. The probability of recovering after the first breakdown is very high (initial momentum, then decline, then exhaustion); moving averages are still showing a bullish upward divergence. Currently, it is at the same price level, but the price is already below 2x VEGAS, and both 1x VEGAS and MA100 EMA200 have turned downward. Similarly, the second touch of the moving average did not show a significant spike recovery but has been consolidating below the channel. Therefore, I am not very optimistic.
Structurally, there has been a large segment of bearishness (strictly speaking, it has not yet been established since there has not been a lower low) and a small segment of bearishness (from June 10 to now), creating two nested bearish structures.
On the order book level, since the rise on April 10, there has been no significant amount of spot orders below. The previous bottom fishing on June 6 and June 13 was based on moving averages and other factors. Since the price is in the top range and "still in a bullish trend," it is natural not to wait for a large number of spot orders below before entering. However, if the bullish trend ends here and returns to a wide range of fluctuations, we still need to enter based on the large orders in the order book (the main basis for bottom fishing last year), which would likely need to reach around $98,000 to consider.
What position can be bottomed? On the order book level, the $98,000 range is where support is provided structurally in the weekly FVG $100,600–$97,900 and the lower daily FVG $95,700–$95,000. The daily MA100 is at $95,600 (currently in an upward trend). These three indicators are independent of each other, but if they are all met simultaneously, the win rate will not be low.
What about altcoins? They have already fallen below $220 billion and have not shown a significant rebound, and the structure has also deteriorated. Key support levels below include $200 billion (April 11 spike / April 16 spike position), $193 billion (weekly diagonal trend line support), and $186 billion (daily FVG / April 7 low). If Bitcoin falls to the $97,000 range, these three positions for altcoins may also be affected.
@CryptosLaowai
BTC has seen a short-term rebound after reaching $98,000. $98,000 is not a significant support level; it is merely a rebound after briefly falling below $100,000 and sweeping a lot of liquidity, and further dips may continue. The visible pressure levels here are $101,500 and $103,500; if it reaches these levels, it would be a good position to add shorts.
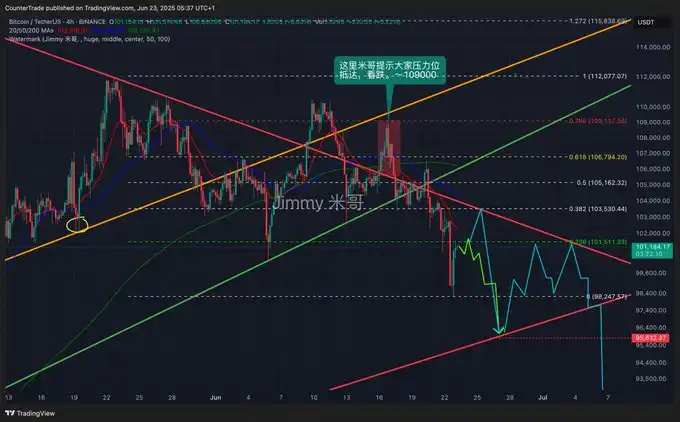
BTC reached $103,500 as expected, even higher. Although driven by news, its essence in the market is to force shorts. The news-driven rise has pushed it higher. There is significant pressure around $106, a red line, a dividing line between long and short. It would not be surprising if it returns to the $90,000 range in a day or two. The rate has turned positive, indicators are overbought, and both 4-hour and daily pressure levels have been reached. Recent market movements have been characterized by sharp declines followed by rapid increases.
@roger73005305
The current situation is that the more it rises, the more bearish it looks; the market needs a healthy pullback, and capital outflows are accelerating.
@market_beggar
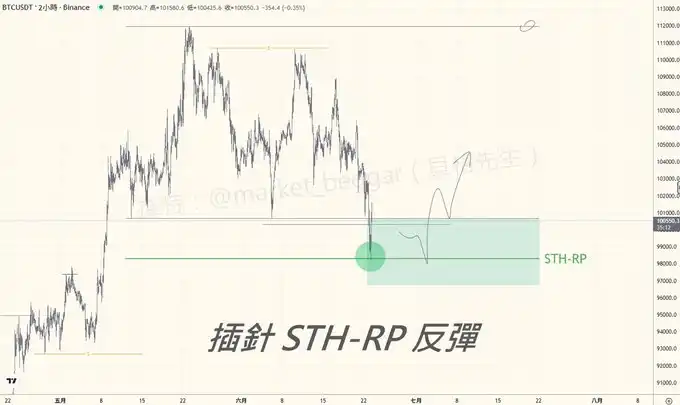
Spike STH-RP, the short-term support level has been reached. It seems the market is quite respectful of STH-RP; the lower reference is the chart drawn yesterday, which mentioned in the weekly report: the position of STH-RP is at $98,297, and this morning it just spiked to $98,200.
The short-term support level has now been reached; if it continues to dip for a second test, the acceptable margin for bulls roughly falls between $93.5K and $98K.
The price has now re-established above the previous low, and some taker buys can be seen, but the trading volume is average; perhaps waiting for the market attitude after the U.S. stock market opens will provide a more stable reference.
Data Analysis Group
@Murphychen888
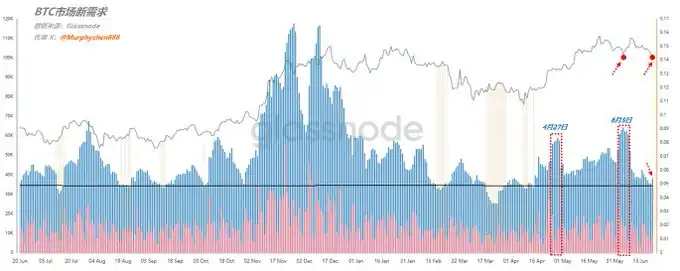
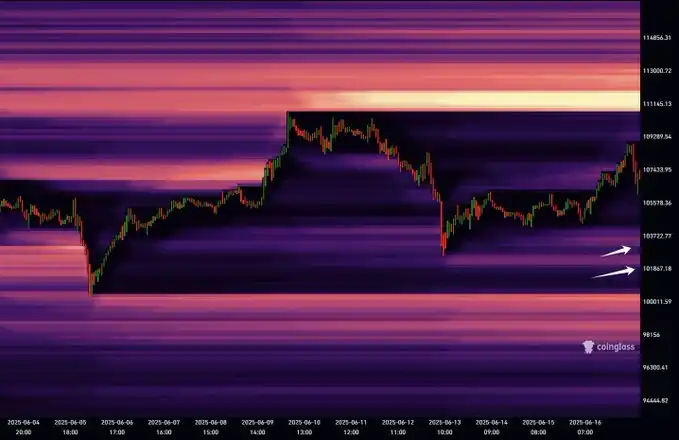
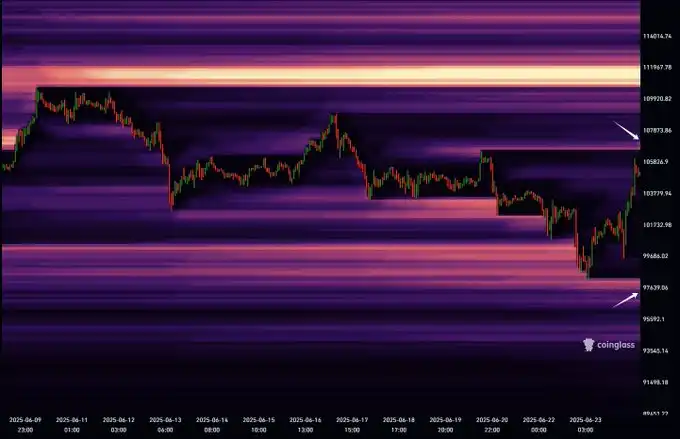
By comparing the data from June 22 and June 5, we can see that when BTC's price also pulled back to around $100,000, the scale of new demand in the market was vastly different. The demand scale on June 5 even exceeded the previous peak on April 27, laying the foundation for BTC to rebound back to $110,000 afterward.
However, in the pullback on June 22, I did not see similar data performance. Perhaps the current geopolitical conflict and macro background have made capital more cautious, but regardless, the weakening of demand will inevitably affect the strength of the rebound, which may not be as strong as the last time.
If there are no particularly obvious changes in the next few days, BTC may continue to show weak performance. For those who bottom-fished on the left, it is advisable to manage positions carefully.
@CryptoPainter_X
After a series of positive news, BTC confirmed a false breakdown and exhibited price behavior that directly rebounded to the mid-range; meanwhile, the spot premium significantly increased, and the funding rate noticeably decreased, indicating that buying pressure mainly came from the spot market, while some futures longs were liquidated.
The next steps remain clear: if it holds above the mid-range, continue to look bullish towards the upper range; if it fails to hold, the price may need to retest $102,000.
Data that can be used for early judgment includes:
- If the funding rate remains negative, the probability of breaking through the mid-range will increase;
- If the spot premium index does not significantly decline during the mid-range consolidation phase, the probability of breaking through the mid-range will increase;
If neither of the above conditions is met, the probability of the price being blocked at the mid-range and retesting $102,000 will increase.
The strong rebound overnight validated the logic of the $8,000 spot buying pressure entering early, thus the current spot market leans towards dominance, and the futures market's two consecutive incomplete liquidation price behaviors indicate that the dominant force in futures is declining.
Currently, it can be seen that the residual short liquidity at $107,000 is very close to being liquidated. If market sentiment is good tonight, this position is likely to be touched. Based on the price behavior after the liquidation at $107,000, we can consider several short-term trading ideas:
- If a spike liquidation occurs at $107,000, forming a breakout, the price will likely initiate a pullback, targeting the starting point of the left-side rally, which is around $102,000;
- If the price does not show a significant pullback but instead maintains a steady upward trend, then this price behavior is likely targeting the large short liquidity at higher levels, with a target around $112,000 to $113,000.
Often, a new high is not achieved gradually but rather reverses suddenly at the end of a prolonged downtrend, spiking to a new high to capture liquidity. Therefore, whether bullish or bearish, one must be cautious of such deliberate price behavior, which is a common phenomenon in the distribution range at the top.
Personally, I actually hope the price first retests $102,000, gains effective support, and then reopens the short liquidation market. After all, this scenario is more stable and allows for the possibility of a new bullish trend afterward. If it simply rallies recklessly to clear shorts, the probability of a "spike and drop" will significantly increase. Once the high liquidity is cleared, I will definitely consider shorting.
@DL_W99
Last night, geopolitical conflicts escalated, but during low liquidity moments, there was an excessive panic reaction that pushed prices down to around $98,500. Now, with the U.S. stock market opening and oil prices dropping, BTC has rebounded somewhat, fluctuating above $100,000. Last night, SOL also broke below the $140 support, now arriving at a new support range of around $123 to $138.
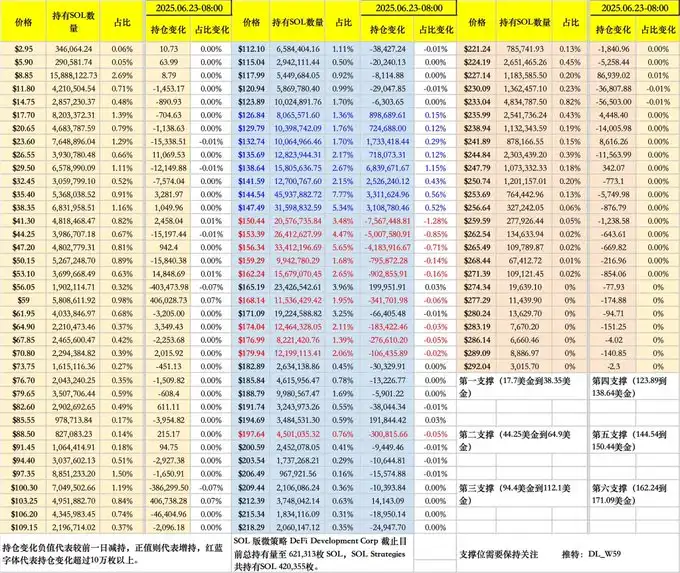
Returning to SOL's data, the turnover rate over the three days from Friday to Sunday was not high, with over 19 million tokens exchanged, as seen in the red text in the chart. It remains in the recent consolidation range, with short-term chasing high tokens above $150 exiting. Other longer-term tokens have seen very few exits.
The mid to long-term holdings have remained relatively stable after several months of market activity. Each price point still sees reductions of hundreds to thousands of tokens, which is not much. From the perspective of token accumulation and short-term turnover, there is still a significant accumulation at $144, with over 45 million tokens, but the $140 to $147 range has become a short-term pressure zone, while the new support range is around $123 to $138.
Currently, following the market's rebound, the upper half of the $123 to $138 range is fluctuating. Although market sentiment has not further panicked, for the already weak SOL, following the market's fluctuations does not create an independent market.
@AxelAdlerJr
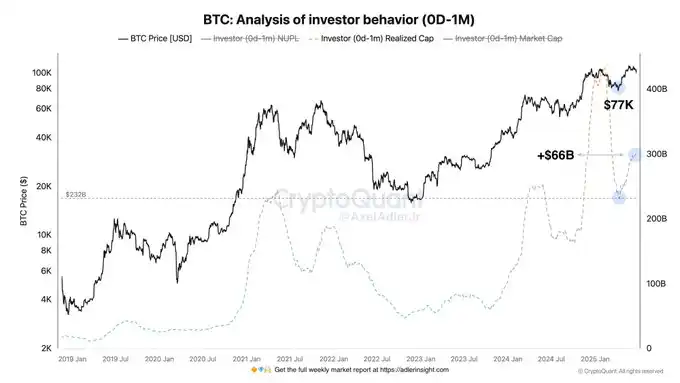
Since April 13, the realized market value of the 0-1 month holding group has increased by $66 billion, indicating that recent buyers are actively taking profits. However, despite approximately 720,000 BTC being sold, the Bitcoin price remains within a narrow range, suggesting that new buyers are continuously absorbing selling pressure. This reflects the current market's buying power is relatively solid.
免责声明:本文章仅代表作者个人观点,不代表本平台的立场和观点。本文章仅供信息分享,不构成对任何人的任何投资建议。用户与作者之间的任何争议,与本平台无关。如网页中刊载的文章或图片涉及侵权,请提供相关的权利证明和身份证明发送邮件到support@aicoin.com,本平台相关工作人员将会进行核查。


