There are two great joys in life: one is to savor what you have, and the other is to feel immensely fulfilled in the pursuit. Some people suffer their whole lives for pleasure, while others are busy their whole lives for rest. People are always in pursuit of beauty, yet often miss the beauty of the present moment. Greed is the truest form of poverty, while contentment is the truest form of wealth! May we all be genuine and wealthy individuals!
Yesterday's market didn't have anything particularly noteworthy to emphasize. After the drop in the early morning, the rest of the time was spent in a fluctuating manner. In our operations yesterday, we adopted a slightly bearish mindset, but in reality, the market rebound did not provide us with the most suitable shorting position. There were still quite a few opportunities for short-term buying. Our approach to buying was to use the low point of the early morning pin bar as a defense, which indeed met our expectations, as the low point was not refreshed again. According to the ultra-short-term buying mindset, we were still able to make some profits yesterday.
Returning to the market, regarding liquidity today, the short-term bearish liquidity clearing intensity is mainly located around 106,000, and there has been a certain increase in the current intensity. Meanwhile, bullish liquidity has increased in the range of 102,000-103,000. Looking back at yesterday's market trend, we can see that there were several dips close to the previous low points. Our judgment yesterday was that if the low point was refreshed, it would inevitably trigger further deep clearing of bullish liquidity, and our expected target was around 101,000. However, the several dips did not continue downward; instead, we observed that when the market dipped, the buying volume from the spot market increased, and the buying power protected the market from further decline.
Now, the key point is that we cannot currently determine whether the buying from the spot market is speculative, intending to participate in the short term, or value buying. Therefore, we need more data to improve our reference. For now, our operational mindset does not need to change. If the market first goes up to clear bearish liquidity, we will wait to short on the bearish reversal. Conversely, if it goes down to clear bullish liquidity, we will wait for the bullish clearing to complete before going long.
From a technical perspective, the daily chart maintains a fluctuating doji star, indicating its expectation of fluctuation. Currently, the coin price is still running below the MA7 daily line, so in the short term, it remains in a fluctuating bearish state. However, on the technical indicators, the MACD has already converged in the bearish cycle, and the bullish golden cross expectation is still delayed. As analyzed yesterday, if this bullish expectation is affected by fluctuations for too long, there will be energy consumption, leading to a lack of strength in the rebound after entering the bullish phase. Other indicators are basically flat, facing a directional choice in the fluctuating performance.
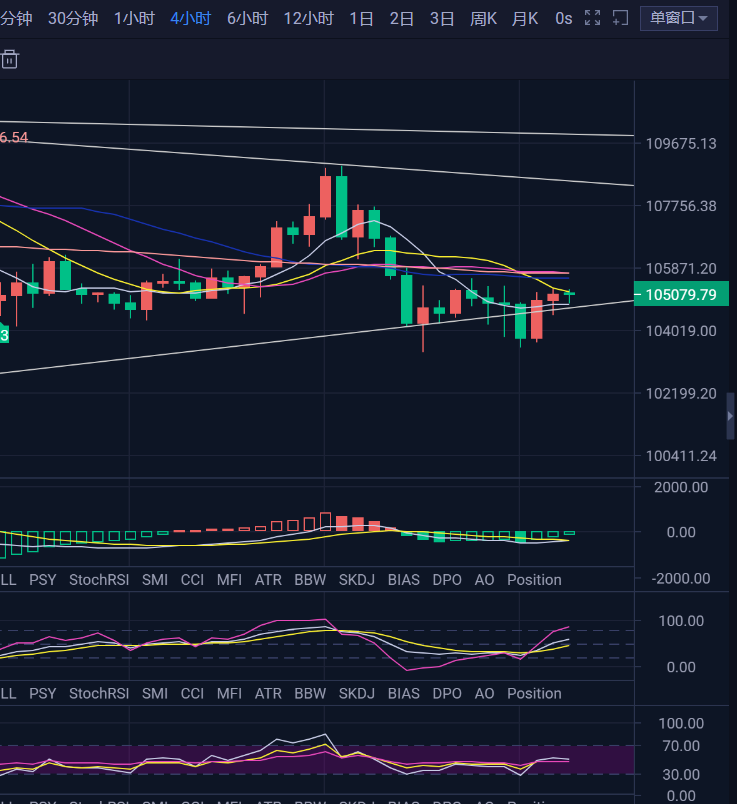
On the four-hour level, it is almost a low-level fluctuating trend. From a structural perspective, the short-term upward focus on the four-hour chart is the small-level rebound high point of 105,600, while downward is still the previous pin bar low of 103,400. The breakthrough situation of these two positions should determine whether the market clears upward or downward. The technical indicators are all showing a flat trend and are running at the midpoint. It can be noted that under the current shrinking fluctuation, if the price first drops slightly, there may be a significant rise later, and a larger drop. Conversely, if the price first makes a false breakout at the upper range, the probability of this eventually forming a distribution range and turning into a bearish trend will increase. In summary: after a long-term shrinking fluctuation, if the price first rises, it will later drop; if it first drops, it will later rise.
In terms of operations, there are also two mindsets. For large area operations, the layout is to short in the upper bearish intensity clearing area, as there is currently an increase in liquidity above. Therefore, our corresponding expectation for clearing is in the 106,500-107,500 area, while for the bullish intensity clearing area below, the layout is in the 101,000-102,000 area. For small area ultra-short-term operations, we can use the two breakthrough positions of 105,600 and 103,400 as defenses for our operations.
For Ethereum, pay attention to the weekly chart. Such a K-line arrangement structure is quite rare. Counting this week's K-line, it has been a continuous six-week high-level fluctuating arrangement, accompanied by upper and lower shadows, while the K-line body is small. In such a structure, there are absolute reasons to look both bullish and bearish. Generally, in this type of structure, the choice of direction for predicting the subsequent major trend is particularly important. An upward movement may lead to another violent surge, while a downward movement may easily result in a significant market event. For the short-term small trend, it is still advisable to follow Bitcoin primarily, with short positions around 2,580 and long positions around 2,400 being more suitable.
【The above analysis and strategies are for reference only. Please bear the risks yourself. The article has been reviewed and published, and market changes in real-time may lead to information lag, making strategies not timely. Specific operations should be based on real-time strategies. Feel free to contact us for market discussions.】

免责声明:本文章仅代表作者个人观点,不代表本平台的立场和观点。本文章仅供信息分享,不构成对任何人的任何投资建议。用户与作者之间的任何争议,与本平台无关。如网页中刊载的文章或图片涉及侵权,请提供相关的权利证明和身份证明发送邮件到support@aicoin.com,本平台相关工作人员将会进行核查。


