Recently, on-chain funds suddenly "turned around."

Do you remember the news that went viral a few days ago? In the past week, Arbitrum's cross-chain bridge saw a net inflow of $162 million, making it the most attractive among all public chains. Meanwhile, Ethereum experienced a net outflow of $123 million—can even the main chain not hold up? Many people felt a tightening in their hearts upon seeing this data.
But today, the plot has reversed. Data shows that Ethereum's single-day net inflow has rebounded to $95 million, as if it has just "stopped the bleeding," and even seems to be recovering. So the question arises:
"What exactly is the money doing? Is this a normal inter-chain rotation? Or is it a prelude to a new market trend?"
"For us ordinary traders, how should we understand and respond?"
Don't worry, let's break it down slowly.
First, let's clarify: where did the funds actually flow to?
When we say Arbitrum is "attracting funds," how exactly is it doing that? In fact, most of the funds have been transferred from Ethereum through Arbitrum's official cross-chain bridge. Simply put, it's like transferring money from the "bank account" of Ethereum's main chain to the "sub-account" of Arbitrum, making it easier to perform cheaper and faster operations on Layer 2.
And where did these funds go? According to on-chain visualization tools, a lot of the ETH and stablecoins flowing into Arbitrum have gone into projects like GMX, Pendle, and Camelot, either for trading, mining arbitrage, or directly claiming airdrops.
So, why have funds recently started to flow back into Ethereum? There could be several reasons:
- The difference in on-chain transaction fees has narrowed: Arbitrum's gas fees have increased significantly, while the ETH main chain has become relatively cheaper.
- New narratives are brewing for Ethereum: such as the "Cancun upgrade" and "L2 data availability reform," with some people positioning themselves in advance.
- Market sentiment has changed: main chain assets have become more popular, signaling a "squat then jump" market trend.
In summary, this is a phenomenon of inter-chain liquidity "rotation"—it's not about who wins, but rather that funds have different preferences at different stages.
For us, the more important question is: what should we do in trading?
At this point, you might think, should I also transfer my money back and forth? Follow the funds?
That depends on your trading style. I've summarized the mainstream approaches into three categories, and you can find where you fit:
✅ If you are a conservative investor: treat the fund flow as position adjustment signals + technical bottom references
When funds flow back to the Ethereum main chain, it often indicates a decrease in market risk appetite, and at this time, charts often show some "stop falling + bottom building" signals. You can focus on observing:
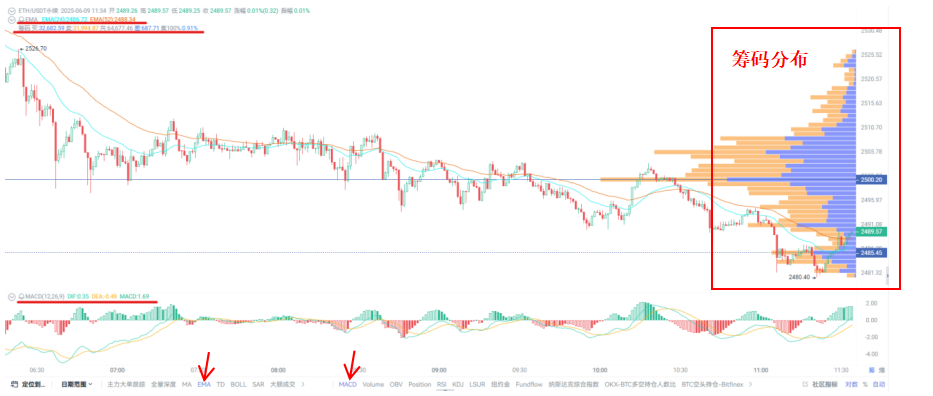
Daily EMA: A turning point in moving averages (for example, EMA 20 starting to approach EMA 60) indicates a weakening of downward momentum.
MACD bullish divergence: Prices make new lows, but the indicator does not, which may indicate a bullish accumulation phase.
Chip concentration area remains unbroken: This means that historically significant trading ranges are still being "defended," indicating strong support.

Suggested response strategies:
- After confirming a stop-fall pattern, gradually increase positions in mainstream coins (like ETH, LDO, UNI), avoid chasing highs, and wait for opportunities to enter on volume pullbacks.
- For L2 assets, consider gradually reducing positions or bridging back to the main chain to participate in stable protocols (like staking, lending, stablecoin strategies, etc.).
- If you're worried about buying too early, you can set a stop-loss point at the EMA 20 not being broken to control the risk of drawdown.
AiCoin has a dedicated alert system; if you want to learn more, you can refer to these articles:
“Signal Alert User Manual - Beginner's Edition”
“Signal Alert User Manual - Professional Edition”
“Signal Alert Mobile Setup Tutorial”

✅ If you are a flexible trader: focus on fund rotation + technical rhythm coordination
At this time, the focus is on the rhythm between chains and short-term structures, so the "bull-bear conversion points" on technical charts are especially important for you. Therefore, technically, you can pay attention to:
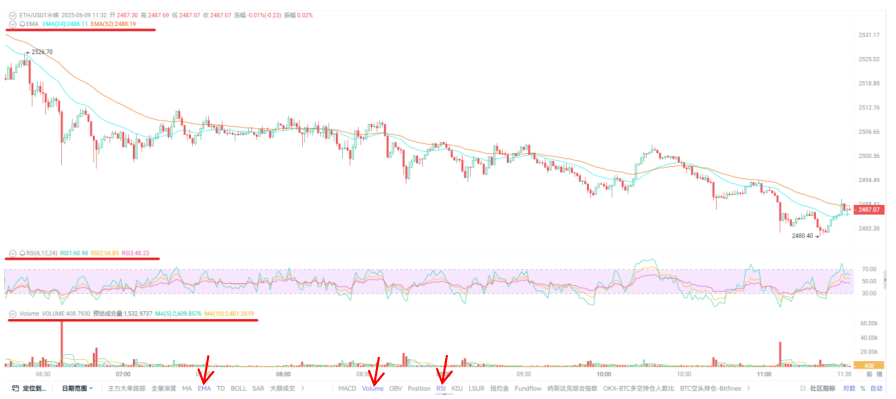
Hourly EMA crossovers: For example, EMA 5 crossing above EMA 20 indicates the initiation of short-term momentum, commonly seen in the phase when hot money starts to flow into L2.
Increased trading volume + price breaking through ranges/trend lines: This confirms that a wave of funds is indeed "moving."
Observe the Relative Strength Index (RSI): The early rebound from the oversold zone often indicates the eve of a rotation starting.

Suggested response strategies:
- As ETH recovers, look for assets on the main chain that have just rebounded in TVL and are lagging in price to perform "catch-up" arbitrage.
- With hot money entering Arbitrum, seek out small projects that have yet to explode, using trading volume + price breakthroughs to "seize the runway."
By now, you may realize that besides alerts, filtering for potential trading pairs is also extremely important. Conveniently, here’s a reference article on how to use AiCoin for indicator-based coin selection: “Custom Indicator Coin Selection: Say Goodbye to Blindness, Precisely Target Potential Coins”

✅ If you are an aggressive speculator: focus on technical anomalies + whale movements
At this point, the focus is actually on the first hour before a hot trend starts, and technically, you need to capture those explosive signal combinations. On the charts, you will typically see:
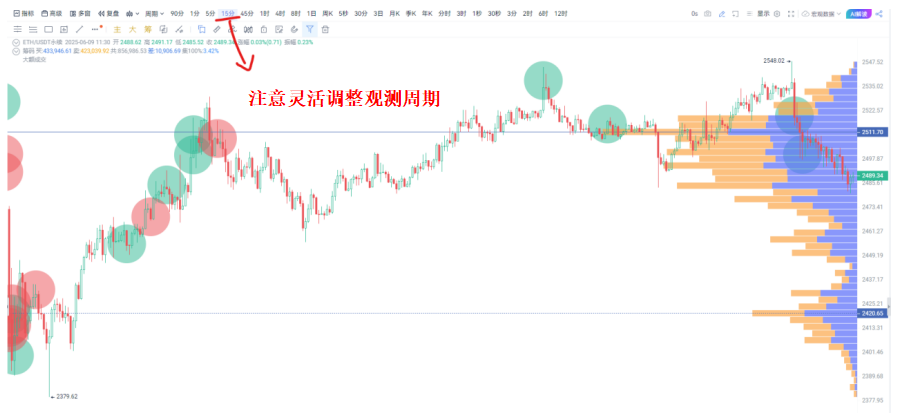
15-minute candlestick large bullish candles + volume breaking through consolidation zones: This is a typical "news-driven entry point."
Chip distribution gaps being broken: This indicates that resistance levels are being consumed by funds.

Suggested response strategies:
- Quickly determine whether it is a false breakout: check if the volume is sustained and whether it drives related sectors.
- Once funds are confirmed to be gathering, you can "lightly position in the front row," then set profit-taking and stop-loss points based on candlestick structures (whether it breaks the 5-period average, whether it experiences volume stagnation).
- Frequently use combinations of indicators to trigger conditions, such as "MACD golden cross + RSI breaking above 50 + candlestick closing above the upper trend line," which is likely a bullish signal.
Funds can speak, but they never explain.
Every inflow and outflow you see may be the precise layout of arbitrageurs or the impulsive following of emotional players. What you need to do is find your own signals amidst this noise.
Don't forget: the chain is changing, money is moving, and opportunities are constantly shifting. You can never catch all the hot spots, but you can choose to follow the parts you understand and can manage steadily.
So now—has your strategy kept up?
免责声明:本文章仅代表作者个人观点,不代表本平台的立场和观点。本文章仅供信息分享,不构成对任何人的任何投资建议。用户与作者之间的任何争议,与本平台无关。如网页中刊载的文章或图片涉及侵权,请提供相关的权利证明和身份证明发送邮件到support@aicoin.com,本平台相关工作人员将会进行核查。


