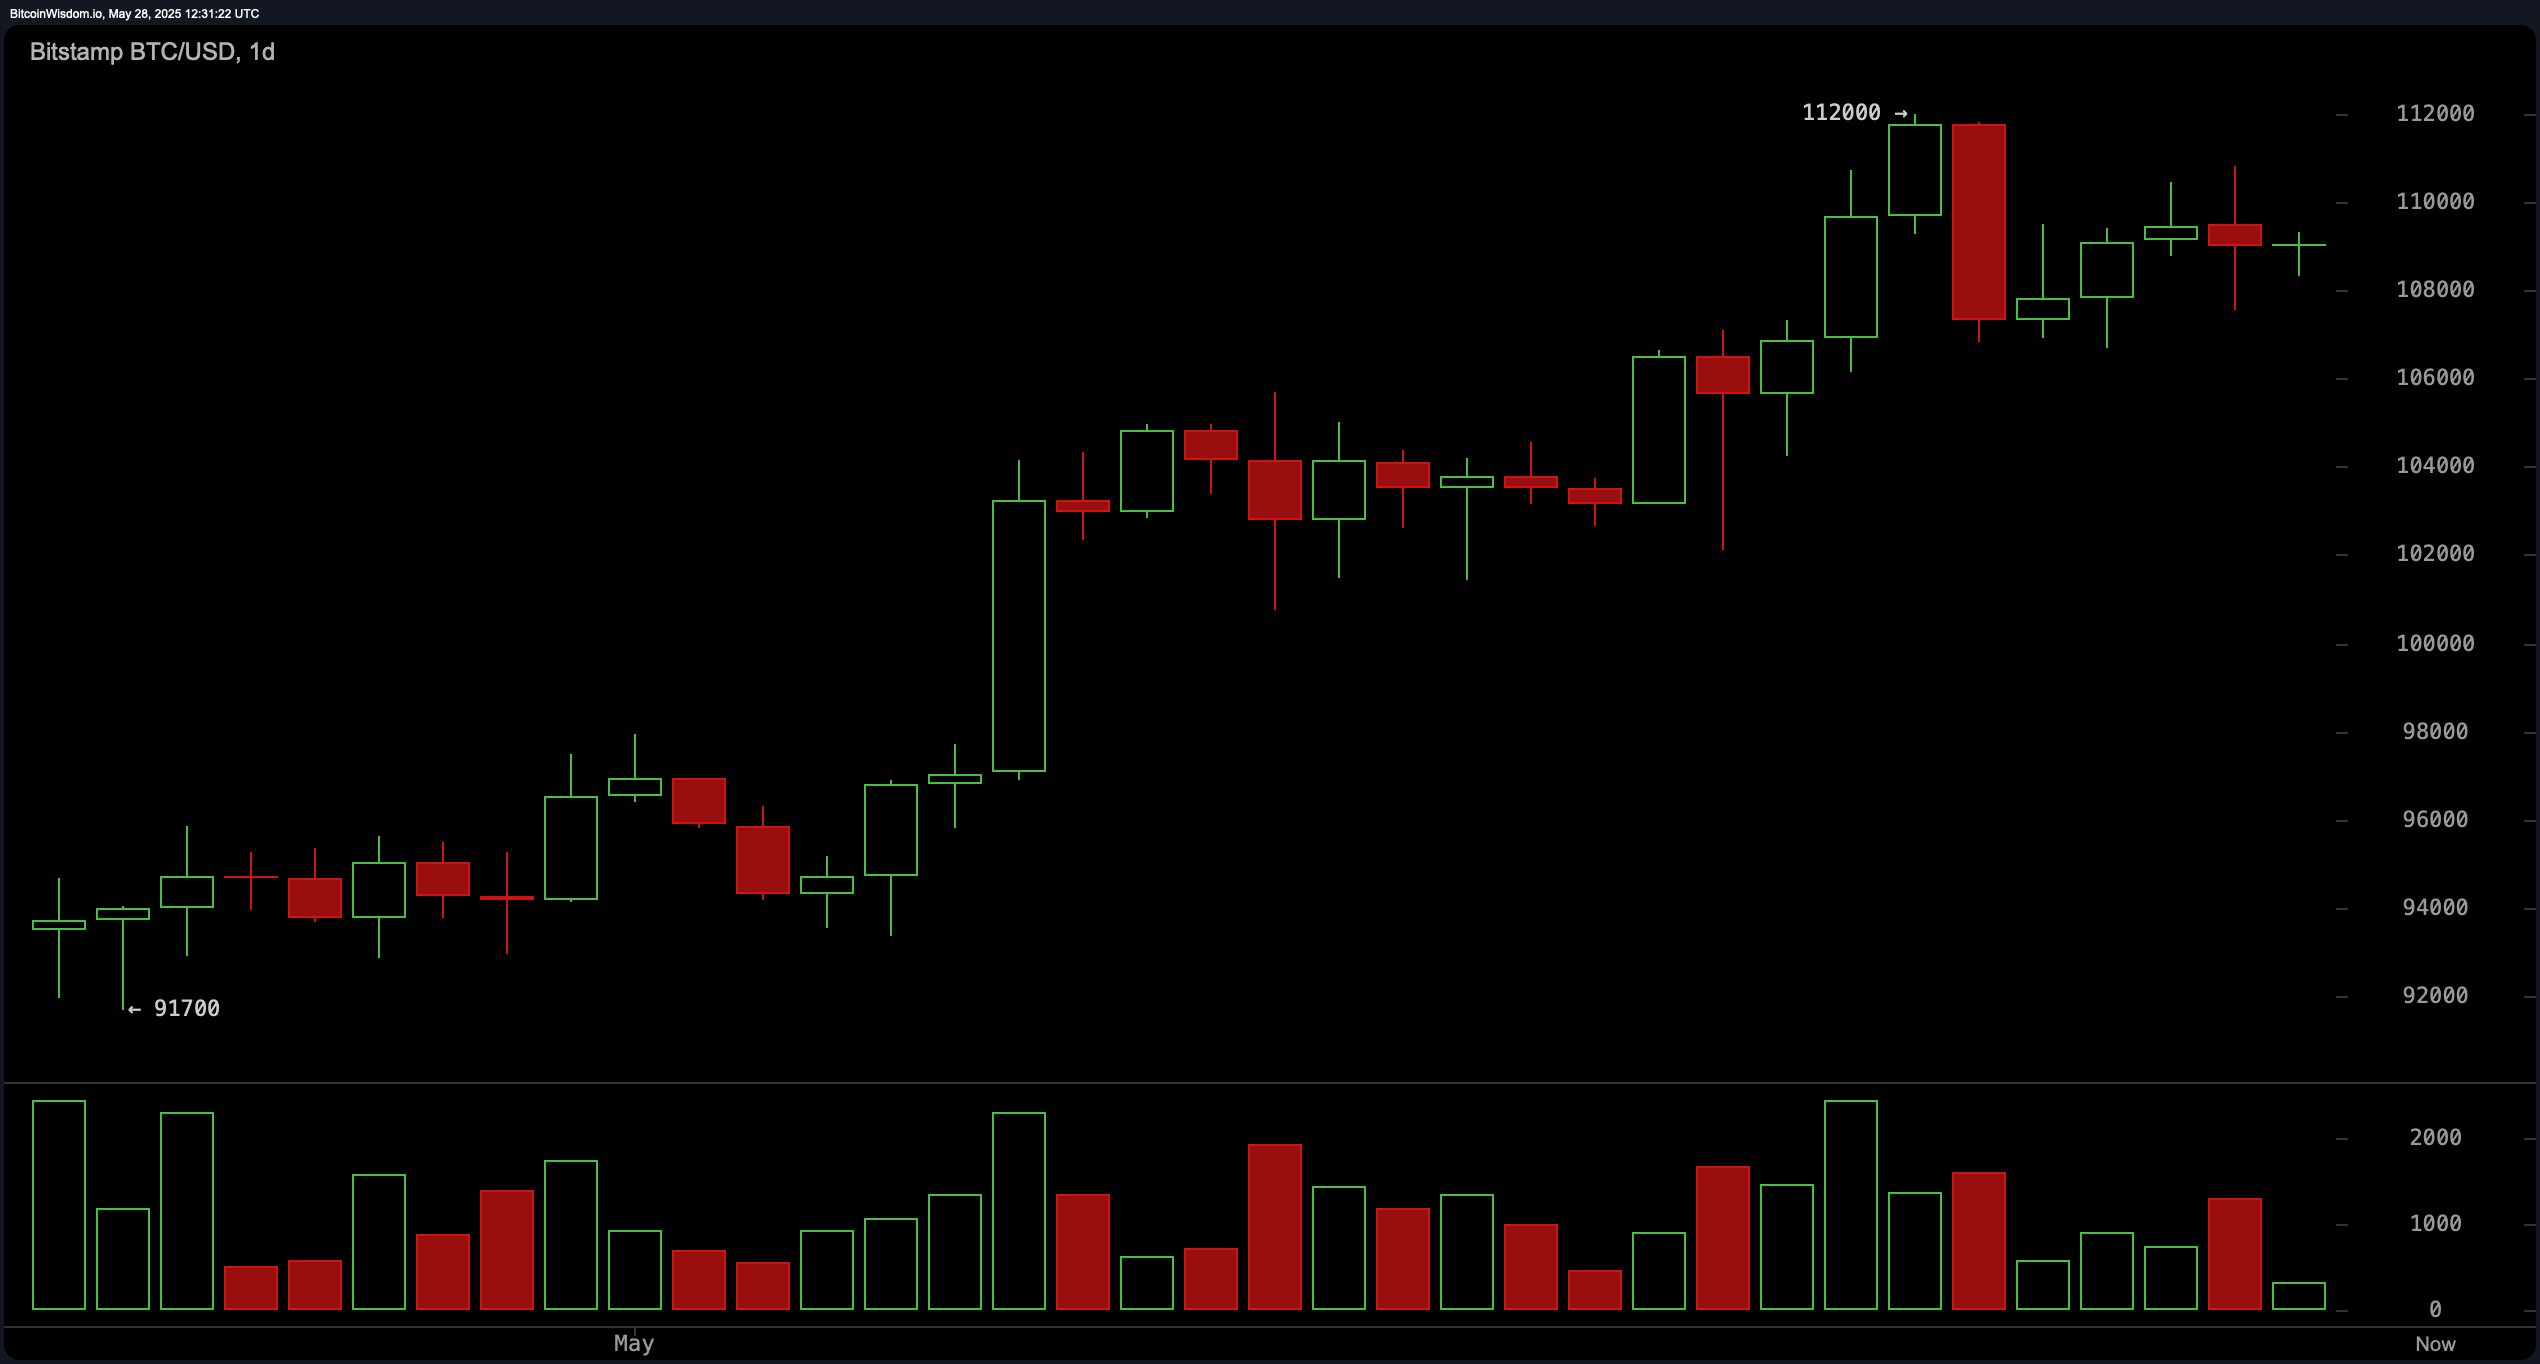
On the daily chart, bitcoin maintains a bullish structure despite a retreat from the $112,000 level. Support near the $106,000 to $107,000 range has held firm, indicating consistent buying pressure. Lower volume on the most recent red candle suggests a lack of conviction among sellers, reinforcing the underlying bullish sentiment. Key resistance remains at the $112,000 local top, and a break above this with substantial volume would indicate a new upward leg. Accumulation near $107,000, should it persist, could offer a favorable entry point for long-term positioning.

BTC/USD 1 day chart via Bitstamp on May 28, 2025.
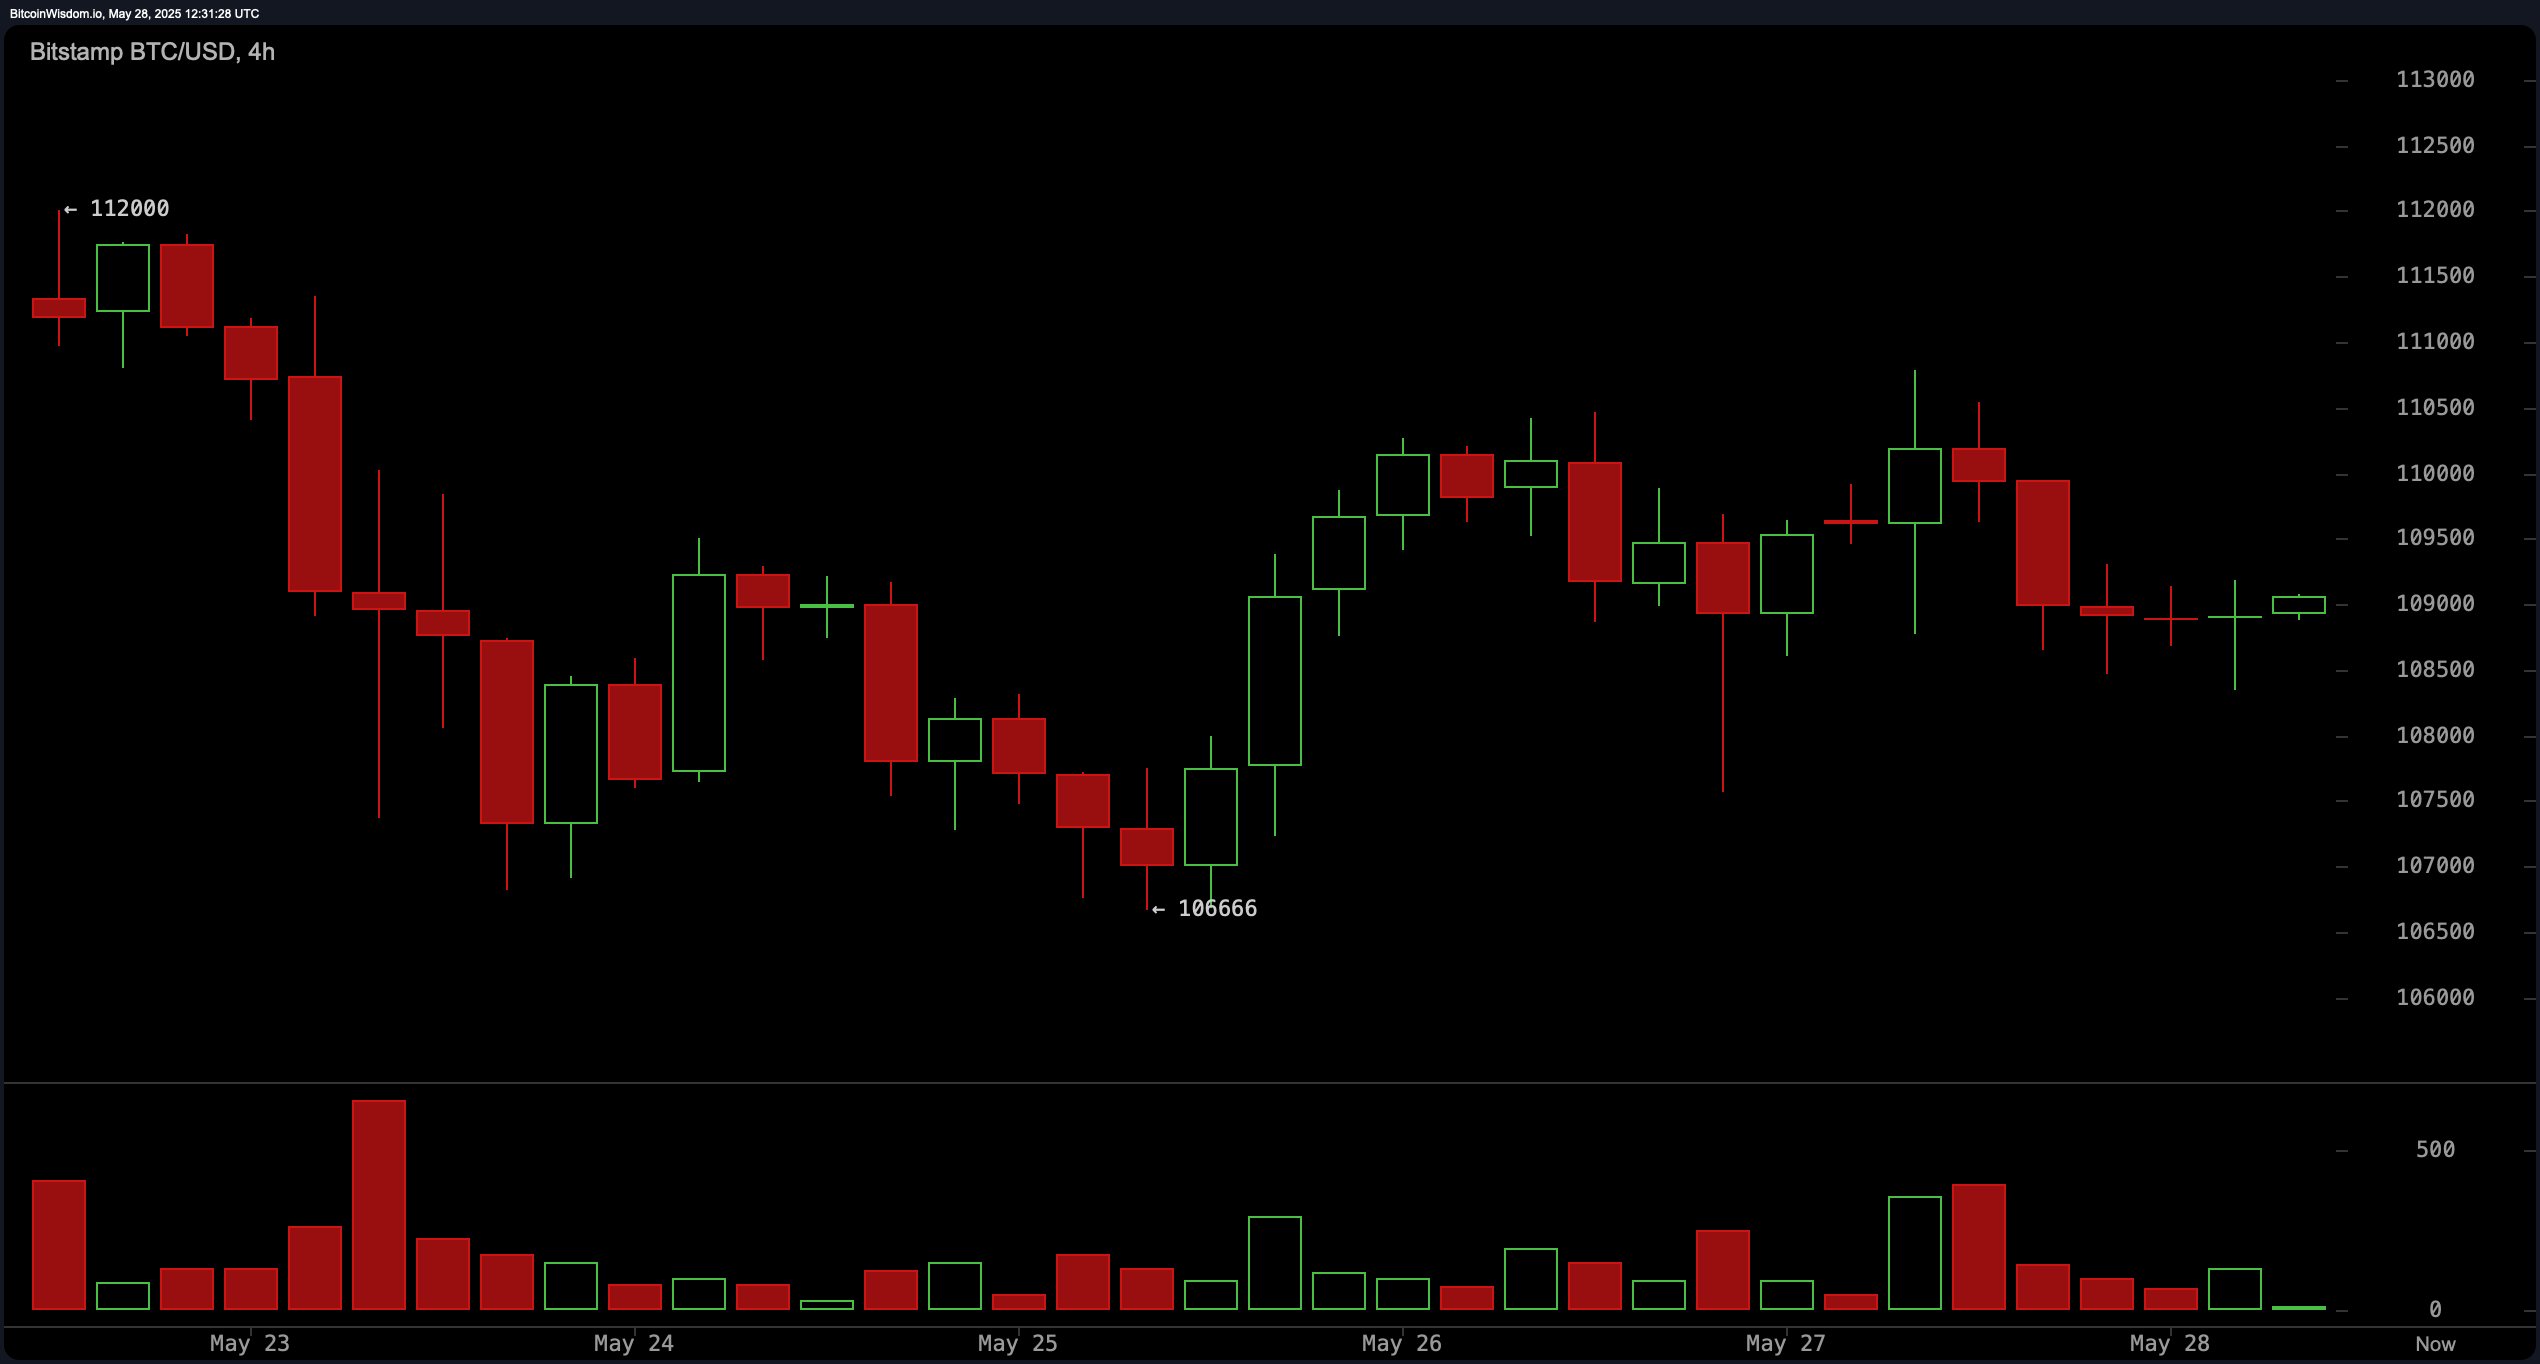
The 4-hour bitcoin chart reveals a short-term downtrend following the peak at $112,000, with the market now in consolidation. Support at $106,666 has been defended multiple times, while resistance in the $110,500 to $111,000 range caps upward movement. The bearish volume during the sell-off phase has since tapered, signaling reduced downward momentum. Tactical entries near $108,000 are supported if bullish reversal patterns emerge. Profit-taking near resistance remains prudent as long as the consolidation persists.

BTC/USD 4-hour chart via Bitstamp on May 28, 2025.
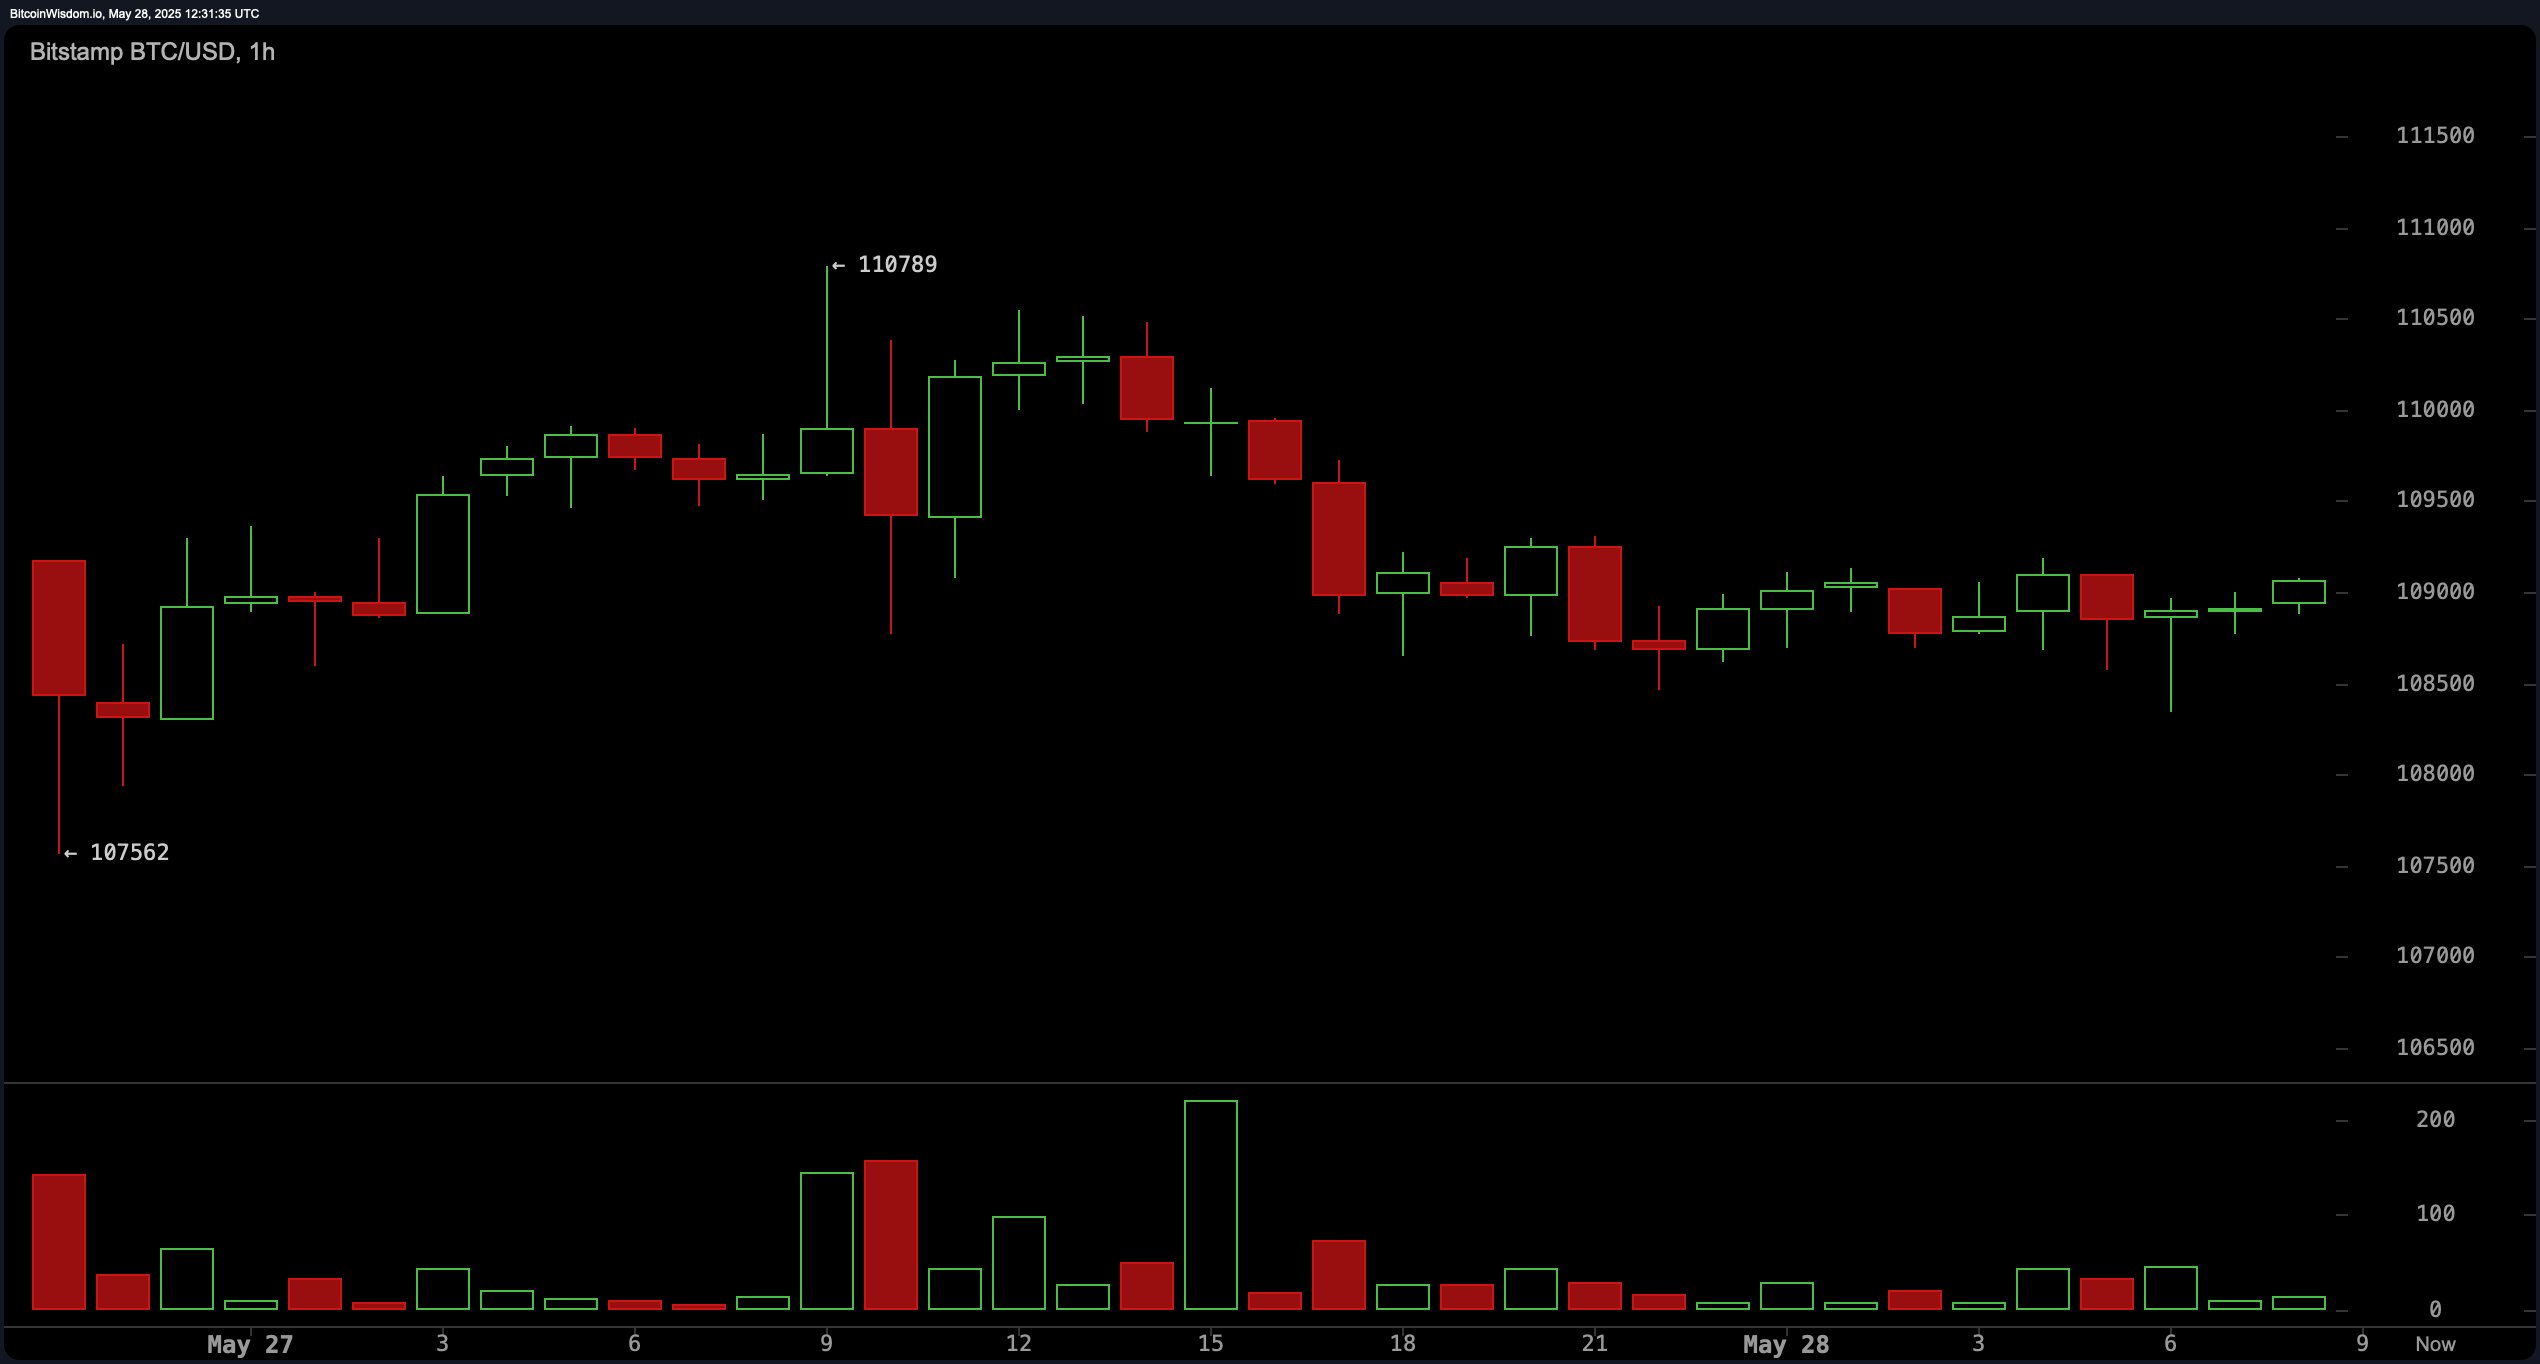
Bitcoin’s 1-hour chart illustrates a choppy range-bound environment with a slight upward bias. Price action repeatedly finds support around $108,000 and meets resistance near $110,000, underscoring market indecision. Volume remains light, suggesting a potential pause before a larger directional move. Scalping opportunities exist for intraday traders between $108,000 and $110,000. Close monitoring of price behavior near these levels can inform short-term trade decisions.

BTC/USD 1-hour chart via Bitstamp on May 28, 2025.
Technical oscillators offer mixed signals, reflecting the market’s tentative posture. Among oscillators, the relative strength index (RSI) at 65, the Stochastic at 73, the commodity channel index (CCI) at 79, the average directional index (ADX) at 31, and the Awesome oscillator all register neutral readings. However, momentum at 2,545 and the moving average convergence divergence (MACD) level at 3,510 both signal selling pressure. These divergences indicate waning upside momentum and reinforce the importance of support level holding.
Conversely, moving averages reflect a predominantly bullish stance across all periods. The 10-, 20-, 30-, 50-, 100-, and 200-period exponential moving averages (EMAs) and simple moving averages (SMAs) all suggest bullish conditions. For example, the 10-period EMA and SMA stand at $108,082 and $108,561 respectively, both below the current price, offering immediate support. The longer-term 200-period EMA at $90,251 and SMA at $94,466 further cement the bullish foundation. As long as bitcoin remains above its short-term averages, bullish sentiment is likely to prevail.
Bull Verdict:
Bitcoin’s price structure remains firmly intact above key support zones, with all moving averages pointing upward and consistent buying interest near $107,000. As long as $106,000 holds and the price reclaims $110,000 with volume, a bullish continuation toward or beyond $112,000 is likely.
Bear Verdict:
Despite bullish moving averages, selling signals from the momentum and moving average convergence divergence (MACD) indicators suggest weakening strength. A decisive breakdown below $106,000 could trigger an accelerated downside, invalidating the bullish trend and opening room for a deeper correction.
免责声明:本文章仅代表作者个人观点,不代表本平台的立场和观点。本文章仅供信息分享,不构成对任何人的任何投资建议。用户与作者之间的任何争议,与本平台无关。如网页中刊载的文章或图片涉及侵权,请提供相关的权利证明和身份证明发送邮件到support@aicoin.com,本平台相关工作人员将会进行核查。


