
The beautiful valley has completely formed the bat pattern as expected. Now there is a lot of FOMO outside as it hits new highs. Since April 9, when it broke out with a large bullish candle, I believed the probability of forming a bat pattern was high. I also reminded that Bitcoin has a chance to complete a shark pattern, and Bitcoin's rebound came earlier than the beautiful valley's rebound.
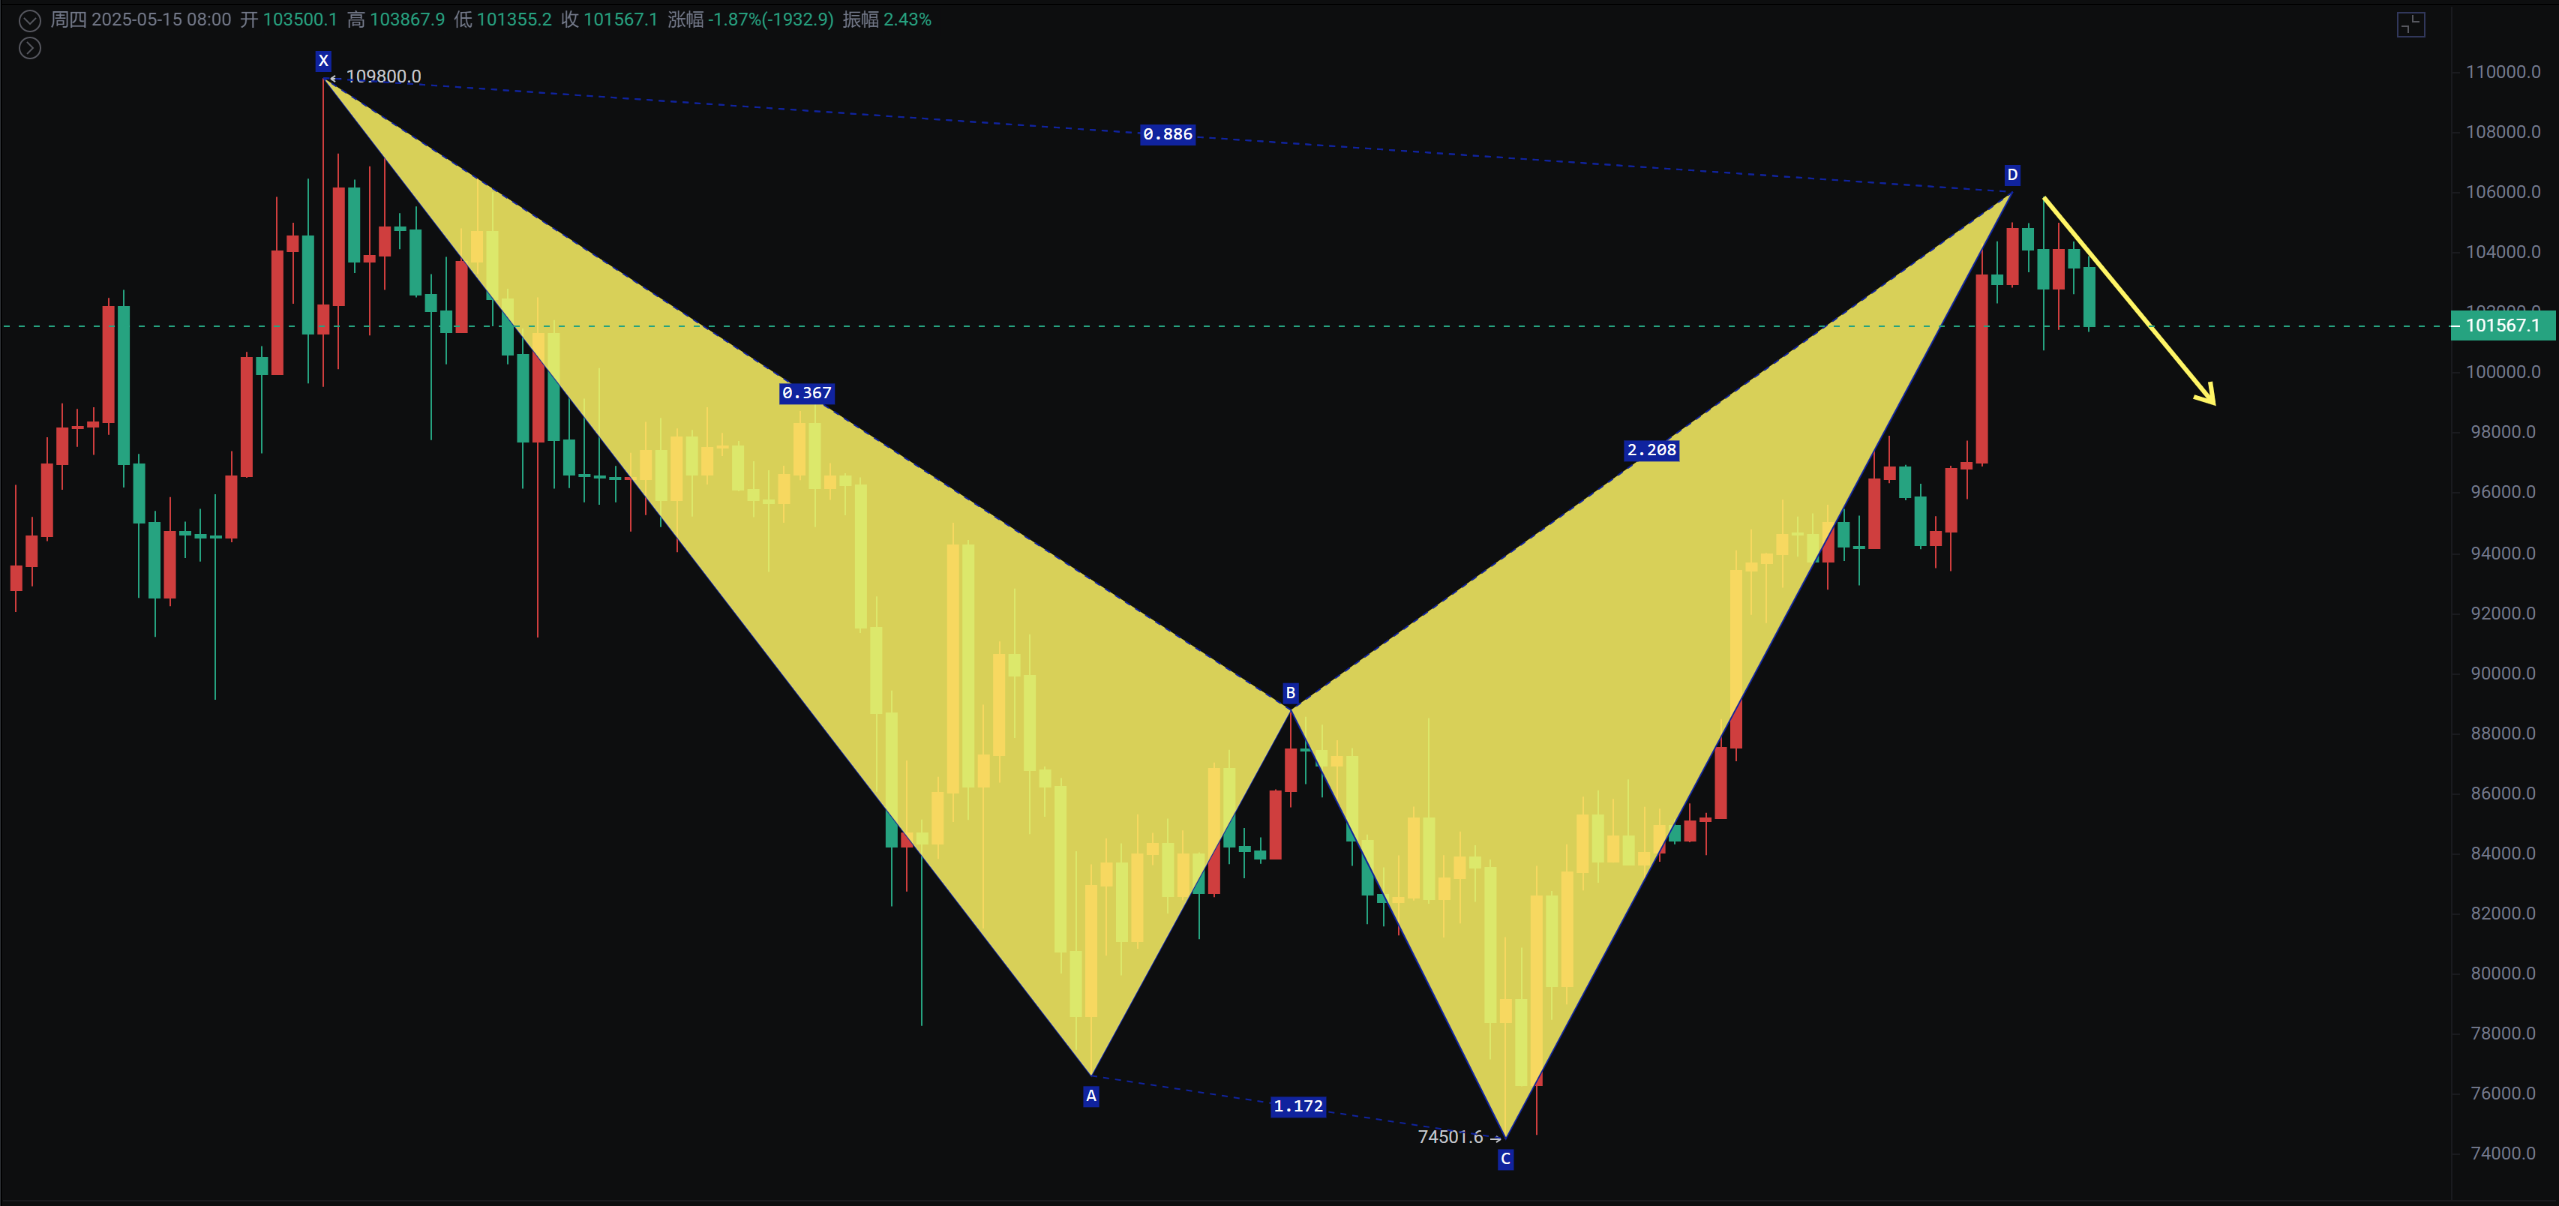
A few days ago, I reminded that BTC has completed the shark pattern and has been oscillating for about a week. There is a short-term need for a pullback, but the depth of the pullback is limited.
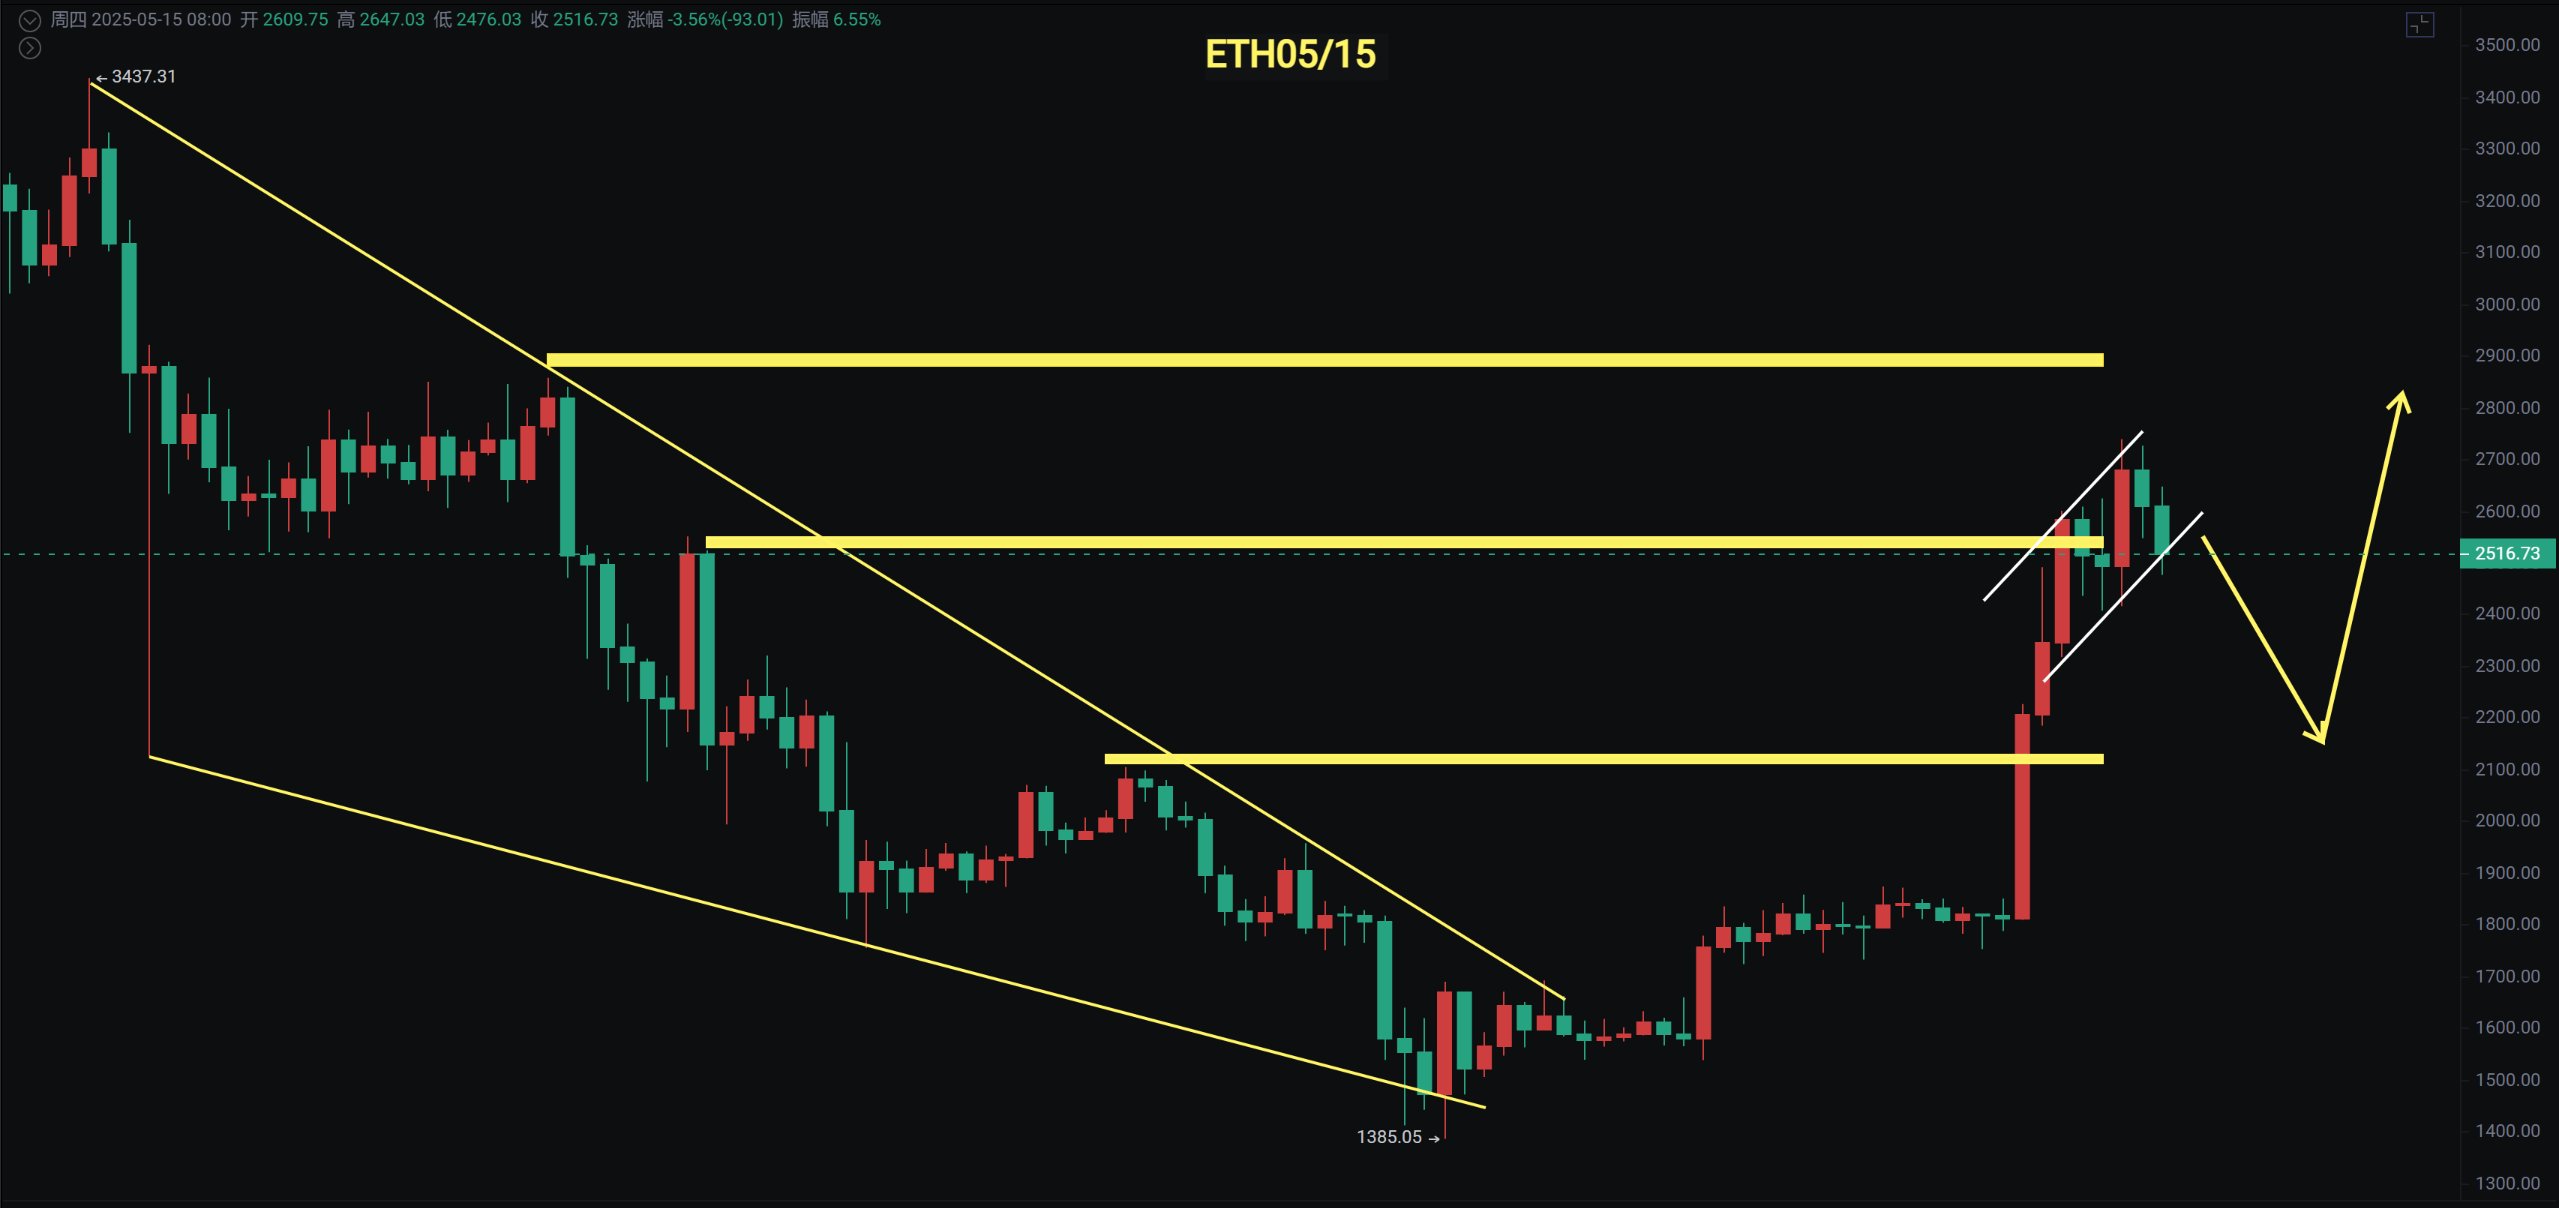
Ethereum reached a high of 2738, with the daily line pressure at 2856, which is also the pressure that came down with the crash in February. The probability of directly stabilizing and breaking through is relatively small; we still need to wait for a pullback to get more opportunities.
Bitcoin
If it oscillates above 0.786 for a week and then falls back, we need to be cautious about a pullback. In past history, this kind of movement is very common, and there is a chance to pull back to the CME gap of 95800—97700. If the pullback is deeper, it could be 91600—93300. In the later stages of the pullback, I will gradually increase my position in these two ranges.
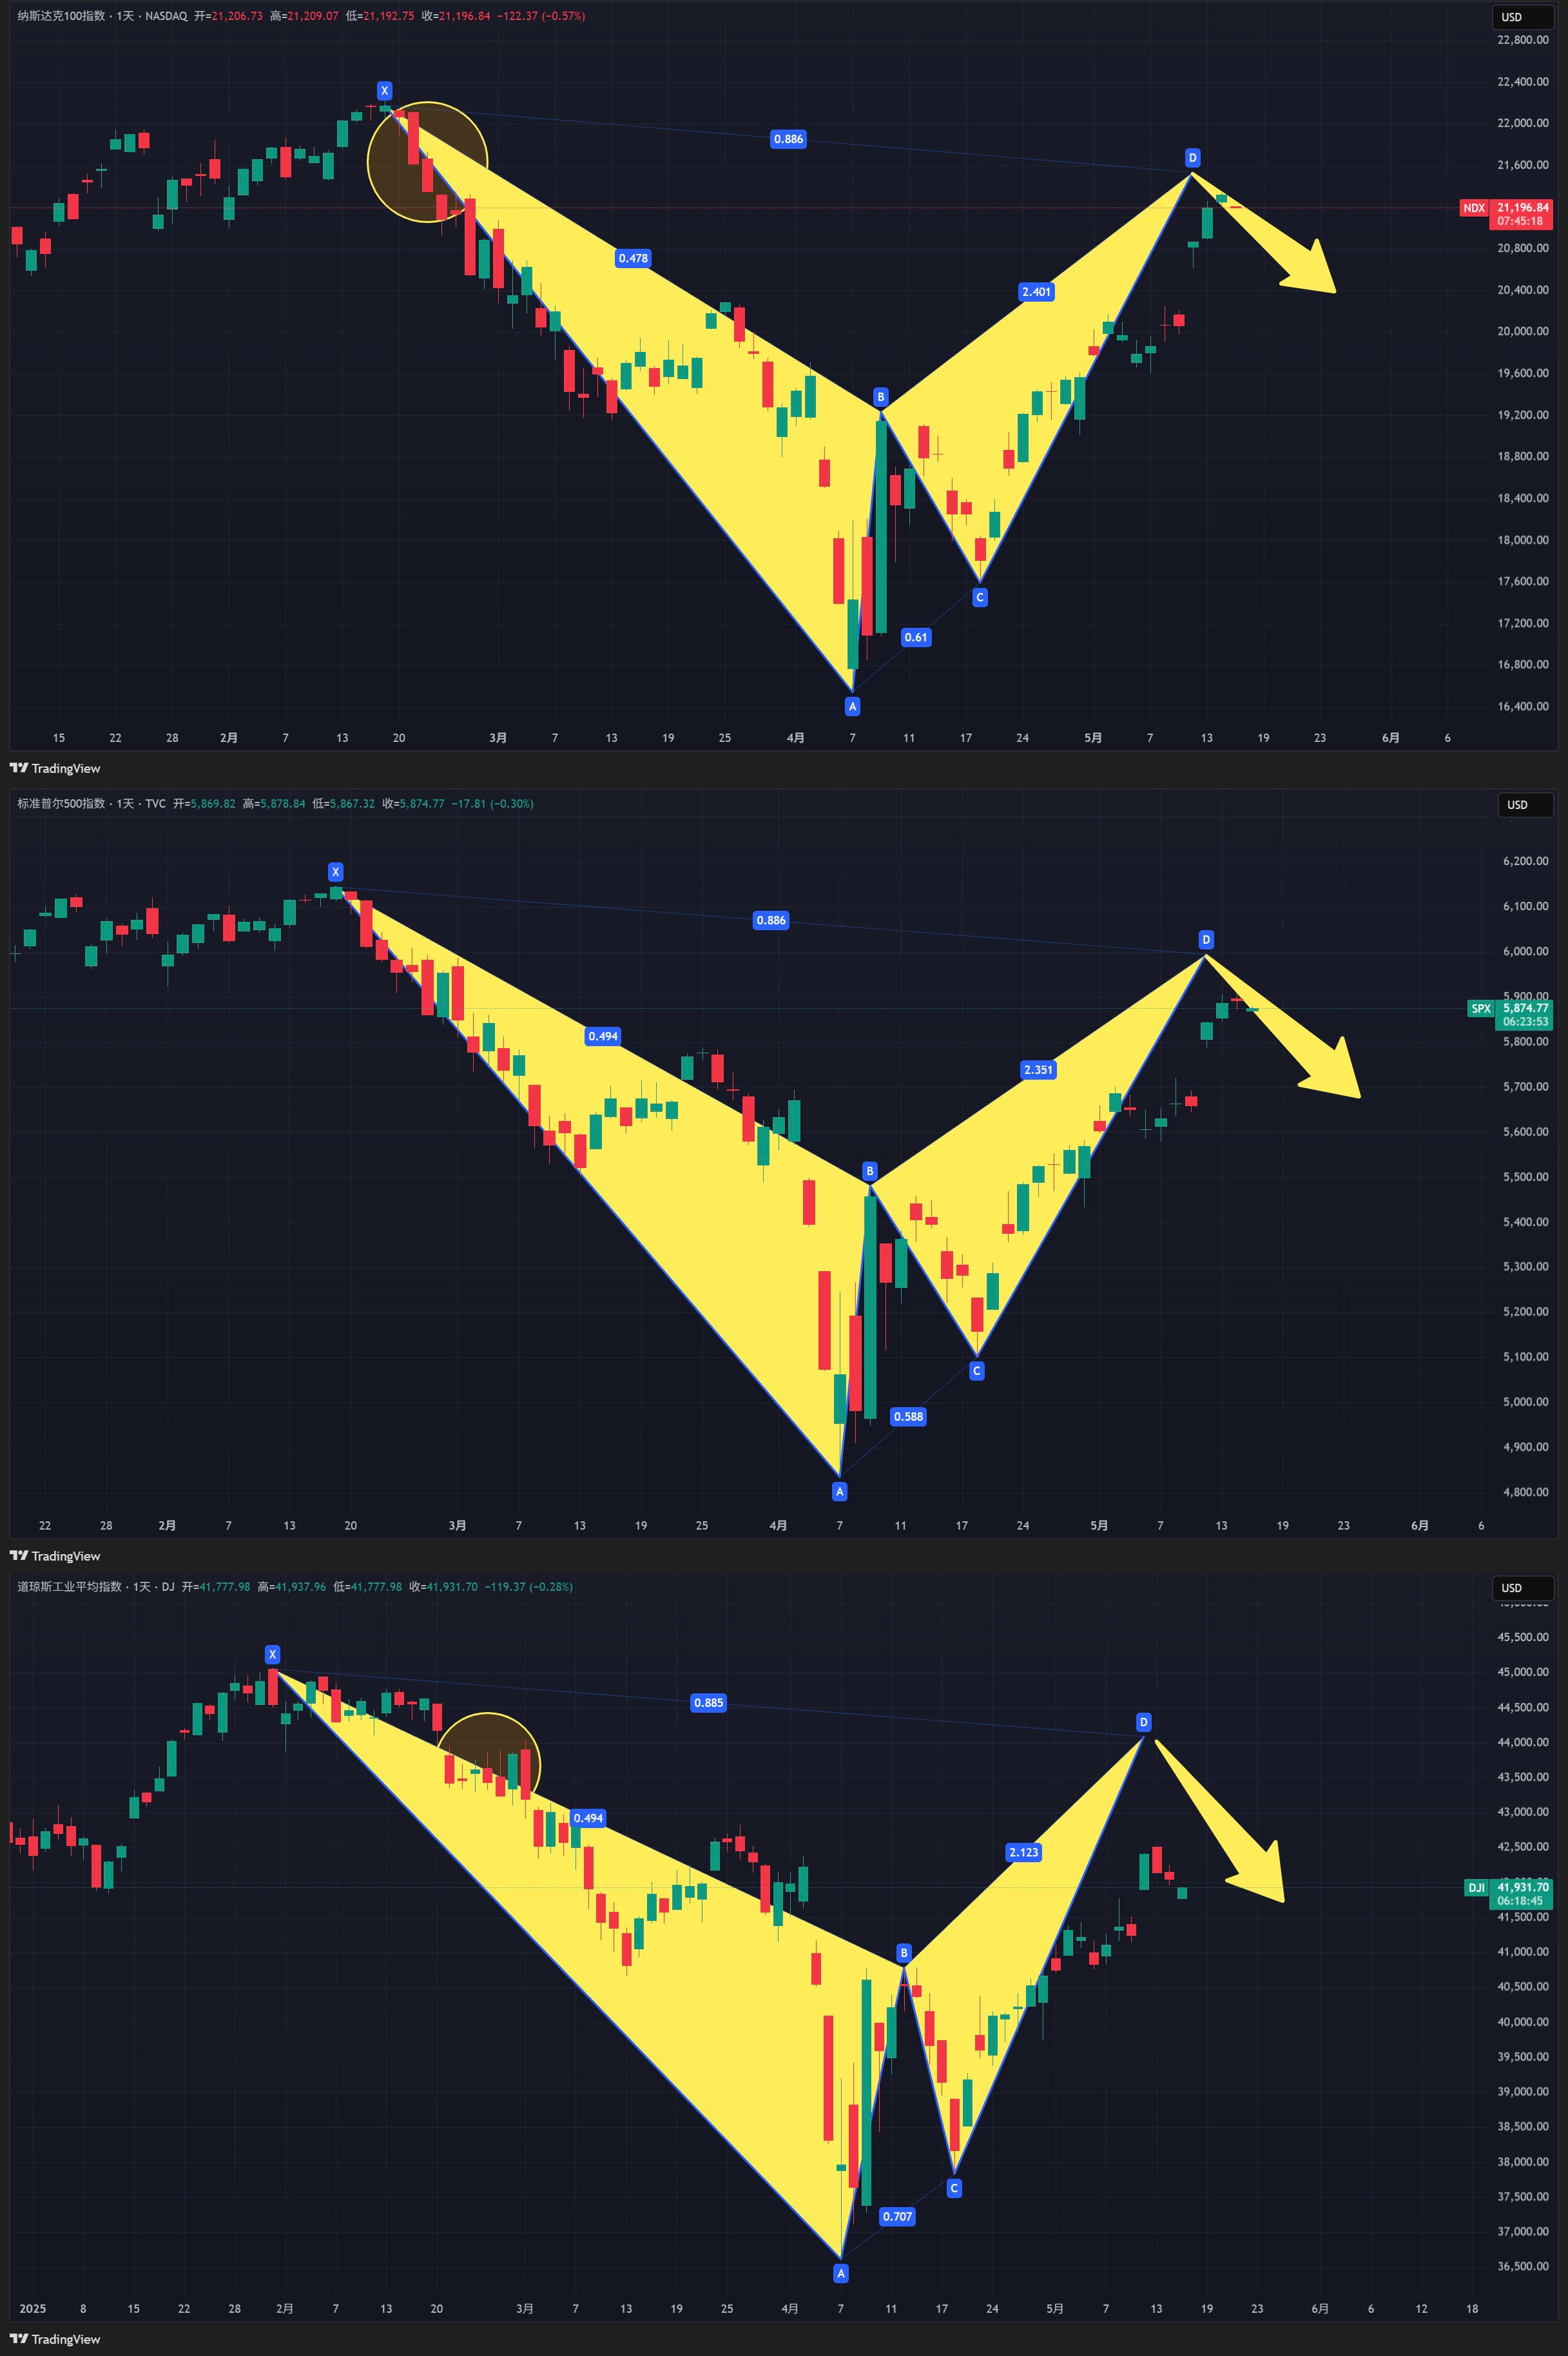
On the daily line, pay attention to the rising trend line. The 4-hour MACD shows a top divergence, indicating that the fifth wave of the rise is complete, entering a phase of oscillation adjustment or pullback. From the upward momentum, it has previously been an upward trend, and now it is moving sideways. If it breaks below 100000, pay attention to the depth of the pullback.
Support: 91500—93000—95800
Resistance: 110000
Ethereum
As early as 1700—1800, I kept reminding that after the oscillation, it looked bullish. Currently, having pulled up from the lowest point to nearly double, it is definitely not suitable to chase the rise. This rebound just touches the Fibonacci 0.5 resistance and is pulling back. The daily support is at 2400. If Bitcoin falls below 100000, there is a chance to pull back to 1900—2000.
Support: 1900—2000
Resistance: 2856—3200
If you like my views, please like, comment, and share. Let's traverse the bull and bear markets together!!!
The article is time-sensitive and for reference only, updated in real-time.
Focusing on K-line technical research, sharing global investment opportunities. Public account: BTC Trading Master Fusu

免责声明:本文章仅代表作者个人观点,不代表本平台的立场和观点。本文章仅供信息分享,不构成对任何人的任何投资建议。用户与作者之间的任何争议,与本平台无关。如网页中刊载的文章或图片涉及侵权,请提供相关的权利证明和身份证明发送邮件到support@aicoin.com,本平台相关工作人员将会进行核查。


