Market Overview: Bitcoin Surges in the Early Morning, Reversing to $96,000
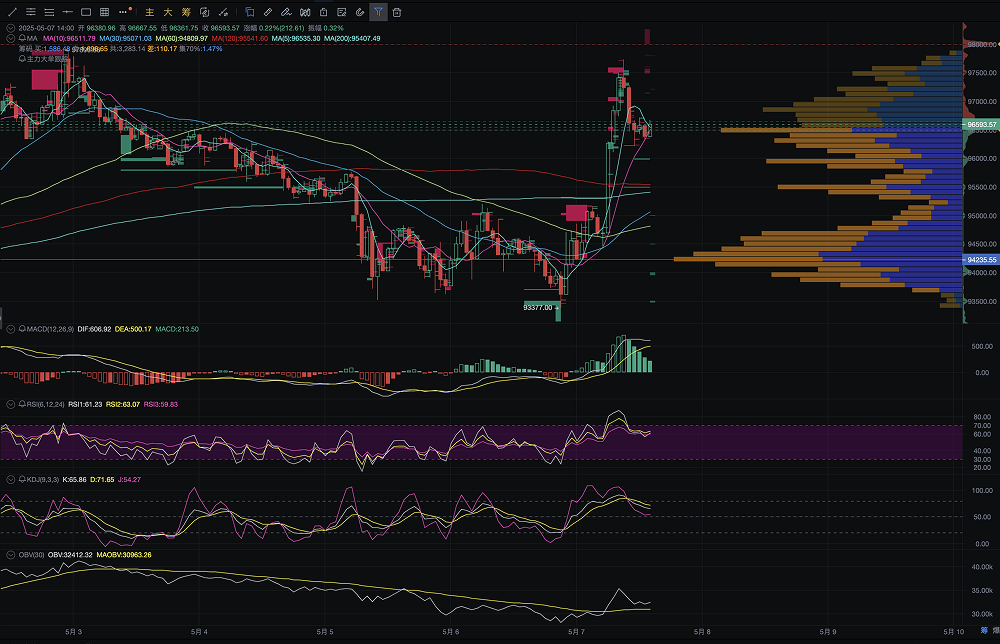
Starting from 6:00 AM on May 7, 2025, the price of Bitcoin surged significantly from $93,577 within just 3 hours, reaching a high of $96,861 during the day, with a maximum increase of over 3.5%. Trading volume skyrocketed, and the price broke through multiple moving average resistances, completely reversing the weak pattern that persisted during the May Day period, and re-establishing itself above the key integer level of $95,000.
AICoin charts show that since the evening of May 6, a large amount of proactive buying has poured in, with multiple indicators such as MACD, RSI, and KDJ reversing simultaneously. Coupled with the technical resonance from breaking through the high-volume area (Volume Profile), this has prompted bulls to accelerate their positions, forming a clear short-term trend reversal.

Candlestick Structure: Bottom "Engulfing + Breakthrough" Pattern Confirmed, Clear Signal for Bears to Exit
(1) Hourly Chart Level: Typical "V-shaped Reversal" Structure, with Double Confirmation from Pullback
Since 11:00 PM on May 6, Bitcoin completed a pullback confirmation at $95,377, followed by two consecutive bullish candles engulfing all previous bearish candles, forming a V-shaped reversal. From 2:00 AM to 6:00 AM on May 7, the price strongly broke through the constraints of the 5-day, 10-day, 30-day, and 60-day moving averages, and stabilized above MA60 (approximately $94,800), releasing a very strong bullish signal.
(2) High-Volume Area Breakthrough: Breaking Through the Dense Trading Zone Releases Structural Rebound Momentum
According to the Volume Profile analysis on the right side of the chart, the price was originally in a high-volume area between $94,500 and $95,500, forming a strong resistance zone. However, this round of increase directly broke through this structural zone with volume, and after the breakthrough, it effectively confirmed support on the pullback, indicating that the main funds have completed their turnover and entered a new upward trend structure.
Technical Indicators Synchronize: Bullish Forces Fully Awakened
- Since the evening of May 6, MACD has shown a clear bottom divergence pattern, and at 12:00 AM on May 7, it officially formed a "golden cross" structure between DIF and DEA, with the red momentum bars rapidly increasing, forming a trend resonance signal. This technical feature often indicates that a trend reversal has been established.
- RSI quickly rose from the previous day's 45 area to above 63, escaping the weak oscillation range and entering a strong technical area, with no significant divergence, indicating that bullish buying is dominating the trend.
- The K, D, and J lines are arranged in a bullish formation, with the J value quickly rising to around 75 after a turning adjustment yesterday, forming a new buying signal, showing that the technical aspect has completely escaped the previous downward channel pressure.
- OBV formed a structural turning point on the evening of May 6, crossing back above the MA OBV moving average, indicating that there is actual capital inflow behind the trading volume, rather than just short covering.
On-Chain Data Tracking: Surge in Large BTC Transfers, Whale Accounts Clearly Accumulating
According to on-chain monitoring data from Lookonchain and Arkham Intelligence, since 9:00 PM on May 6, multiple transfers of BTC worth over $100 million have moved from exchanges like Binance, OKX, and Coinbase Pro to cold wallets, suggesting that whale accounts are suspected of completing large accumulations.
At the same time, a large wallet "bc1q***kg0x" transferred 3,275 BTC from the exchange to an offline address in the early morning, marking one of the largest single short-term transfers this year, indicating a significantly optimistic attitude towards the market outlook.
News Drivers: Nasdaq's Surge Boosts Crypto Risk Appetite
CME FedWatch Tool shows that the market's probability of a rate cut starting in September 2025 has risen to 68%, with capital market risk appetite rapidly recovering.
On May 6, the Nasdaq Composite Index rose by 1.9%, reaching a two-week high, with AI leaders like Nvidia, Meta, and AMD all rising, prompting investors to reprice the "Tech + Crypto" dual-driven logic, encouraging BTC to rally in tandem with the strength in the tech sector.
Summary and Outlook: Bitcoin Officially Breaks Out of Consolidation Zone, Short-Term Target May Point to $98,000–$99,000
Considering the market structure, technical patterns, capital flow, and news logic, Bitcoin's breakthrough of $96,000 on May 7, 2025, can be seen as a signal of "the end of the short-term bearish trend and the initial establishment of an upward trend."
We believe that if the price stabilizes in the $95,500–$95,800 range today, it will continue to challenge the $98,000 resistance zone in the short term, and may even aim for the $99,000–$100,000 integer level; conversely, if there is a long upper shadow with increased volume and a drop below $94,000, caution should be exercised regarding the risk of a pullback.
Strategy Recommendations:
- Short-term investors can set stop-loss orders for long positions around $95,800, targeting $97,500–$98,500;
- Mid-term investors are advised to accumulate on dips, paying attention to Fed policies and ongoing ETF purchase signals;
- Risk control should set dynamic profit-taking levels and be wary of volatility triggered by CPI data around May 10.
This article represents the author's personal views and does not reflect the stance or views of this platform. This article is for informational sharing only and does not constitute any investment advice to anyone.
Join our community to discuss this event
Official Telegram Community: t.me/aicoincn
Chat Room: Wealth Group
免责声明:本文章仅代表作者个人观点,不代表本平台的立场和观点。本文章仅供信息分享,不构成对任何人的任何投资建议。用户与作者之间的任何争议,与本平台无关。如网页中刊载的文章或图片涉及侵权,请提供相关的权利证明和身份证明发送邮件到support@aicoin.com,本平台相关工作人员将会进行核查。


